


Opportunities in The Gold/Silver Ratio!
The gold/silver ratio is the amount of silver it takes to buy one (1) troy ounce of gold. This is a metric that has been available for thousands of years, so it provides a very good long-term barometer of value. It allows gold bugs and metals traders to evaluate how expensive one metal is in relation to another.
To find the gold/silver ratio, simply take the spot price of gold and divide it by the spot price of silver.
Gold Spot / Silver Spot = Gold-Silver Ratio
Mining companies report that for every one ounce of Gold they successfully mine, they extract around 9 ounces of Silver from the earth. Historically, during the time of the Roman empire the price ratio was set to 12 to 1 and when Gold was used as money this was the exchange rate.
In 1792 the United States set the Gold Silver Ratio to 15:1.
Using ratios to help uncover value is a method that investors and traders have used for centuries. This method can be very useful to longer term investors.
Warren Buffet, one of the world’s most successful investors, evaluates companies through a valuation method based upon a company’s price in relation to its historical earnings. This metric which is also referred to as the price to earnings ratio is an important barometer that long term investors use to determine historical value and try and minimize exposure to risk.
Here is a chart of the Standard and Poors 500 Index Price to Earnings ratio over the last 90 years.
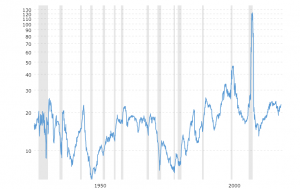
S&P 500 Index Price To Earnings Ratio Chart
Historically, the stock market was considered to be “EXPENSIVE” when the P/E ratio was 25 or higher. In 1982 this important benchmark hit an all-time low of 5. At that time the Dow Jones Industrial Average was trading at around 770.
You can see that during the 2008 financial crisis this benchmark ratio got as high as 120 to 1 indicating that stocks were very, very overvalued.
At the time of this writing, the S&P 500 Price to Earnings ratio is 21. Historically this is still a little on the overvalued side.
Ratio valuation methods look for longer term holding periods. They can be very helpful in terms of understanding the sentiment of the marketplace at the time the valuation occurs.
At the time of this writing, the precious metals complex is testing its yearly highs. Over the last three months while the stock market has sold off sharply and recovered, the metals are up roughly 10%. This is an indication that with all of the quantitative easing done by the Federal Reserve that a large portion of investors are seeking refuge in the metals which historically act as a hedge against crisis and inflation.
The Current Gold Price is $1751
The Current Silver Price is $17.25
The current Gold to Silver Ratio is 101.5 to 1.
Historically this ratio is very high which means that it eventually should return to its historical norms. This favors SILVER in terms of percentage upside potential to GOLD. Or better stated, even if the metals complex were to fall, Silver should fall less than Gold based upon this valuation.
When the Gold/Silver Ratio rises, it means that gold has become more expensive compared to silver, and the cheaper metal might offer better value. When the ratio falls, it means gold has become less costly relative to silver.
The average Gold/Silver price ratio during the 20th century, however, was 47:1. This means that it took 47 ounces of Silver to purchase one ounce of Gold.
Over the past 20 years, the ratio has averaged right around 60:1.
Just based upon these two benchmarks we can look at multiple theoretical scenarios assuming a bullish and bearish perspective.
If Gold prices rise to $2,000 per ounce and the ratio holds true it would price silver fairly at anywhere between $33 to $42 per ounce.
If Gold were to Selloff to $1,500 per ounce and the ratio holds true, it would price Silver fairly between $25 and $31.91 per ounce.
In either scenario, assuming a fairly-priced Gold to Silver ratio is a winning trade for Silver.
Here is a long-term chart of the Gold To Silver Ratio:
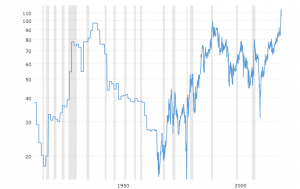
Just through a very quick “eyeballing” of this ratio you can see that it is at the most extreme place that it has ever been.
What is this comparable to?
Imagine it is Mid-August, and the temperature is 115 degrees outside. While it is possible that it might get warmer, the probabilities favor that it will most likely get cooler. Focusing on the probabilities this is the way that “Gold bugs” are evaluating these two metals at present time. They are bullish both metals but from a historical basis, the odds favor more upside potential to Silver rather than Gold.
Likewise, in the metals when you see these extreme valuations it is time to focus on the undervalued metal and explore trading strategies that can increase profit potential and further minimize risk.
With the Gold/Silver Ratio we can distinguish 4 different market scenarios as follows:
- If the gold price rises faster than the silver price, the ratio will increase.
- If the gold price falls faster than the silver price, the ratio will decrease.
- If the silver price rises faster than the gold price, the ratio will decrease.
- If the silver price falls faster than the gold price, the ratio will increase.
Here are some historical benchmarks for this ratio:
- 323 BC, this ratio stood at 12.5 to 1 at the time of Alexander the Great’s death
- Throughout the entirety of the Great Roman Empire this ratio stood at 12 to 1
- In 1980, at the time of the last great surge in metals prices the ratio stood at 17
- In 1991, When Silver hit its record low price the ratio peaked at 100. Great profits were available in a matter of months as the ratio reverted to its average
- Over the past 20 years, the ratio has averaged right around 60:1
What’s a trader to do?
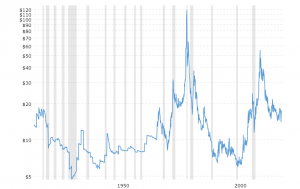
Last Hundred Years of Historical Silver Prices
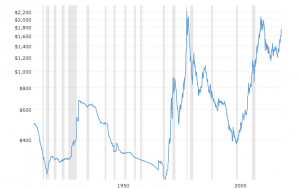
Last 100 Years Historical Gold Prices
This is the type of scenario that makes artificial intelligence invaluable to traders.
At Vantagepoint A.I. our focus for 40 years has been to Empower Traders Daily with our Machine Learning, Neural Networks and Artificial Intelligence Market Forecasts.
Our forecasts are created by looking at the top 30 drivers of an assets price. We do this from the foundational perspective that we live in a global marketplace. What happens in one part of the world has global implications and your charts and analysis need to communicate this information to you before you ever think of putting on that next trade.
So, if you are looking at SILVER as a trading opportunity, you can drill down and see what the most statistically correlated markets are to Silver’s price action. Here is the list that I see when you look at the software:
| ETFs | Commodity | iShares Silver Trust | SLV |
| ETFs | Commodity | Market Vectors Gold Miners | GDX |
| ETFs | Commodity | Market Vectors Junior Gold Miners ETF | GDXJ |
| ETFs | Commodity | SPDR Gold Shares | GLD |
| ETFs | Leveraged Bull | Direxion Daily Gold Miners Bull 3X | NUGT |
| ETFs | Leveraged Bull | Proshares Ultra Consumer Goods | UGE |
| ETFs | United States | Consumer Staples Select SPDR | XLP |
| ETFs | United States | iShares DJ Real Estate IDX | IYR |
| ETFs | United States | PowerShares QQQ | QQQ |
| Futures | Currencies | Euro | EC |
| Futures | Currencies | Japanese Yen | JY |
| Futures | Currencies | U.S. Dollar IDX | DX |
| Futures | Energies | Light Sweet Crude Oil | CL |
| Futures | Energies | Natural Gas | NG |
| Futures | Indices | E-Mini DJIA | YM |
| Futures | Indices | E-Mini S&P 500 | ES |
| Futures | Indices | FTSE 100 | LZ |
| Futures | Interest Rates | 10 Year U.S. Treasury Notes | TY |
| Futures | Metals | COMEX miNY Gold | QO |
| Futures | Metals | Gold | GC |
| Futures | Metals | Platinum | PL |
| US Stocks | Basic Materials | Pan American Silver | PAAS |
| US Stocks | Basic Materials | Royal Gold | RGLD |
| US Stocks | Basic Materials | Wheaton Precious Metals | WPM |
| US Stocks | Conglomerates | General Electric | GE |
| US Stocks | Consumer/Non-Cyclical | Hershey | HSY |
| US Stocks | Consumer/Non-Cyclical | Mondelez International | MDLZ |
| US Stocks | Financial | Digital Realty Trust | DLR |
| US Stocks | Financial | VERIT | VER |
| US Stocks | Technology | SINA Corp | SINA |
These are the REAL FACTS that affect the future price of SILVER.
The very first ETF is iShares Silver Trust (SLV).
Two weeks ago, the Gold Silver Ratio was trading at 115 to 1, making it almost irresistible to not buy Silver.
Think about this entire post above that data from the A.I. and recognize it is one GIANT, FAT Opinion. Everybody can have an opinion. Opinions are a penny a dozen. They will never make you money.
They are “SHOULDS.” The market “SHOULD” behave according to my opinion.
But here is the cold hard reality –
The market does not care one bit about my opinion.
It never has and never will. The only thing that creates wealth is “PRICE.” In other words, to make money in the markets we have to do what price does.
When “SHOULD” and “IS” meet, some pretty explosive stuff can happen and that is where you want to be as a trader.
Let me give you a recent example, that will illustrate the power of artificial intelligence when combined with the opinion I have provided on the Gold- Silver Ratio:
The artificial intelligence evaluates all these relationships to create the following trend forecast for the ETF SLV.
By simply waiting for the artificial intelligence to forecast an uptrend you would have seen a crossover in the forecast on May 7, 2020 at $14.20. In only 8 trading sessions this ETF is up 10.83% or $1.53 a share.
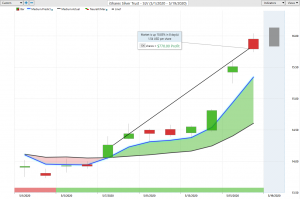
iShares Silver Trust (SLV) ETF
This is the kind of EDGE that Vantagepoint Power Traders consistently have in the market.
If you wanted to use more leverage we could apply this same perspective to the SILVER FUTURES contract. This would amplify the risk/reward ratio substantially.
The key is to have a trading plan and then drill down to focus on the right opportunity at the right time to uncover the best opportunity for your trading style.
Moving forward – HOW you are going to trade the markets if you do not have an edge? As the volatility of the past few months becomes commonplace are you prepared? The challenge facing every trader is trying to make sense of the tsunami of financial information to make better trading decisions.
Think about those losing trades and ask yourself what did you learn from that experience? What is your method for analyzing risk?
Are you capable of finding those markets with the best risk/reward ratios out of the thousands of trading opportunities that exist?
The beauty of artificial intelligence is that it looks at these global correlations for each asset statistically to uncover the best opportunities and trends.
Futurist Alvin Toffler, the author of “Future Shock” predicted that in the future change will happen faster and faster.
No truer words have ever been spoken.
Which is why artificial intelligence gives traders that important edge responsible for long term success!
During tough times in the markets, if you turn on your television and watch your favorite financial news show you will quickly see the talking heads debating what the news means in light of all the economic indicators. In the process, they create enough content to fill up the 24-hour news cycle.
It’s horribly complicated.
Stimulus Bills, Interest rates, Unemployment, Trade Balances, Budget Deficits, Political Tensions, Retail Sales, Crude Oil Prices, Technological Innovations.
I’m hearing words that I have never heard before.
A “V” Recovery!
An “L” Recovery!
A “W” Recovery!
InDeflation (Yes it’s a new hybrid term!)
Massive Hyperinflation!
Stagflationary Depression!
It’s very easy to get lost and confused trying to connect all the dots and feel good about trade selection. I’m not smart enough to try and figure out what happens next. No one is! And trading on an opinion and great story line is a very fast way to lose money.
Thanks to artificial intelligence it’s also unnecessary.
I, like everybody else, have my opinions about what will happen next. But I never let my opinion get in the way of what the artificial intelligence is forecasting.
SHOULD” is the most expensive word in a traders vocabulary!
I have a very strong opinion that SILVER will do well based upon all of the new money that has been pumped into the economy in the form of new stimulus bills. But my “NORTH STAR” will always be the artificial intelligence.
Sometimes the trades only last a few days.
Sometimes they last a few weeks.
There is a lot of money to be made in short term swing trades.
When “SHOULD” and “IS” meet, that is where you want to be as a trader. This is how you put the probabilities of success overwhelmingly in your favor.
- Have a plan
- Manage your risk
- Be patient
- Let the A.I. be your North Star
This is how Vantagepoint artificial intelligence simplifies and empowers traders daily!
Intrigued? Visit with us and check out the a.i. at our Next Live Training.
Discover why artificial intelligence is the solution professional traders go-to for less risk, more rewards, and guaranteed peace of mind.
It’s not magic. It’s machine learning.
Make it count.


