


All Eyes On The U.S. Treasury Market And The Government’s Printing Press!
The U.S. Treasury Market is over $41 Trillion in size and allows corporations to borrow, governments to finance themselves efficiently by selling debt, while investors can gain fixed returns with lower risk. For several hundred years communities have used the US Bond market to help build infrastructure. Roughly $500 billion dollars in bonds change hands every single day. For all of these reasons the BOND market has a very central role in the world economy.
The interest rate paid by the U.S. government to its lenders is considered to be the “risk free” rate and it acts as a benchmark for millions of transactions around the world. But there is a major problem in the U.S. Treasury Bond Market today. In a nutshell, risk-free has come to mean negative returns.
Risk means many things to different people. For purposes related to this article I will define risk traditionally as the threat of loss. In the world of finance there is a very basic definition which is central to all financial planning. This guideline is referred to as the Real Rate of Return which is defined as your Percentage Return on Investment less the Inflation Rate for that period.
Example: in 1987 When The Stock Market Meltdown occurred the US Treasury Bonds were yielding 9%. The Inflation rate was 3.65%. So the Real Rate of Return for a Bond Investor in 1987 was 9% minus 3.65% which equals 5.35%.
In comparison, two weeks ago when the Stock market accelerated a steep selloff, the 30 year US Treasury Bond reached a yield of .3%. Who is going to lock their money up for 30 years and guarantee a negative rate of return after inflation is factored into their investment? Would you put your hard-earned dollars in a 30 year US Treasury Bond that was guaranteed to earn you a negative rate of return? This dilemma creates massive uncertainty for investors particularly when it is posed by the largest debtor in the world, The U.S. government.
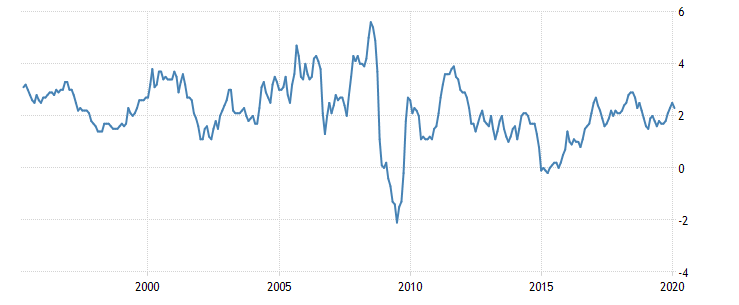
Here is a chart of the annual inflation rate as compiled by the Bureau of Labor Statistics over the last 25 years. You can quickly see that the inflation rate has been as high as 6% and as low as -2%. But on average over the last 25 years the average Inflation rate has been around 2.5%. This means that at any yield less than the inflation rate will result in trillions of dollars being locked in to negative returns.
United States Inflation Rate 1995 to Present
This problem is central to how the United States has funded its debts over the last 12 years since the 2008 financial crisis.
Over the last 30+ years, one of the new financial terms which is bandied about in financial media is “QE” or quantitative easing. This has been the practice that central banks use to literally create money out of thin air and flood the economy with new money in the hopes of spurring on greater productivity.
The way this occurs is that the US. Government sells its debt in the form of U.S. Treasury Bonds. Since this debt is considered to be risk-free, the buyers of these bonds are usually foreign governments, pension funds, mutual funds, as well as the U.S. government itself. Whatever these entities do not purchase in any given week, the Federal Reserve acquires these debts and places them on their balance sheet.
Herein lies one of the major risks.
While this sounds all well and good, it is analogous to living off of your credit cards and making the minimum interest rate payment every month to maintain your good credit standing. What is more problematic in this regard is the quantity of the debt that the Federal Reserve has created over the last 30 years and how today the total US Debt stands at over $24 trillion. This is not counting the recent stimulus bill which added over $2 trillion. And remember that this stimulus was promised to be the first of many!
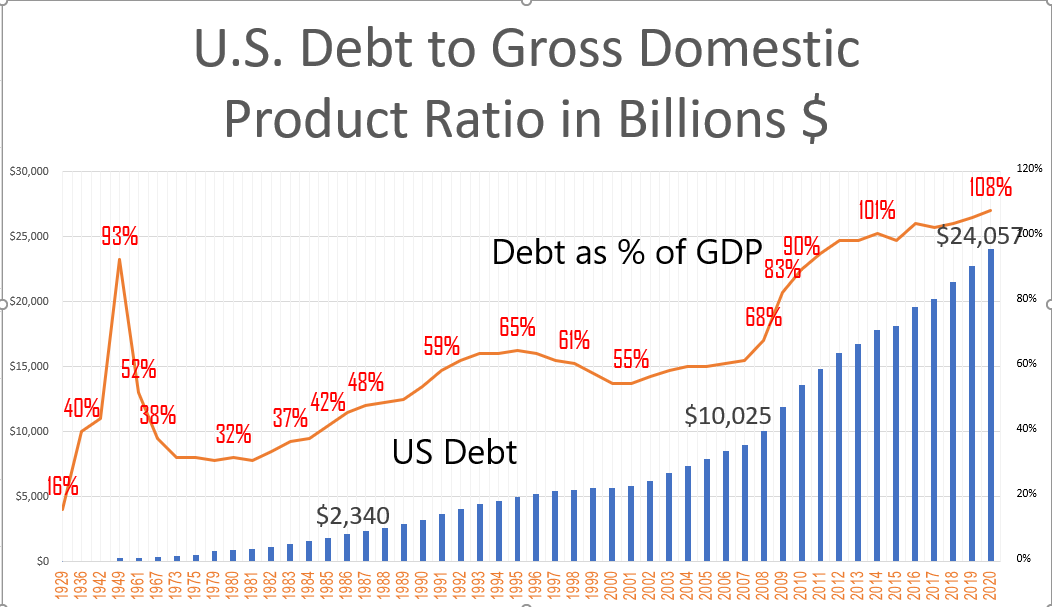
The following chart of US Debt to GDP ratio will provide a snapshot of how debt has grown exponentially in the last 30 years.
This ratio is a very practical tool for investors, leaders, and economists. It allows traders to determine a country’s ability to pay off its debt.
A high ratio means a country isn’t producing enough to pay off its debt. A low ratio means there is plenty of economic output to make the payments.
If a country were a household, GDP is comparable to its income. A lender will gladly give you a bigger loan if you can demonstrate that you make more money. In the same regard, investors are happy to take on a country’s debt if the country is stable, healthy and proves it can continue to grow. Once investors begin to worry about repayment, they will demand more interest rate return for the higher risk of default. That increases the country’s cost of debt. It can quickly become a debt crisis.

U.S. Debt As A Percentage of G.D.P
Where’s the tipping point?
A Study by the World Bank found that if the debt to GDP ratio exceeds 77% for an extended period of time it slows economic growth. In 2009, one year after the financial crisis the ratio stood at 83% and has climbed steadily to 108% today!
Here are the cold hard numbers:
In 1987 U.S. Debt stood at $2.34 trillion. This represented only 48% of the GDP. (Everything produced in the economy.)
In the 2008 Financial Crisis U.S. debt had grown to $10.025 trillion and this represented 68% of the GDP.
Today, in 2020 U.S. Debt is at $24.057 trillion and this amount represents 108% of GDP. In other words, the debt is greater than the entire output of the country.
QE has added 22 trillion dollars of debt or grown by 928% over the last 33 years. However, GDP has only increased by 124% during this same time frame. This indicates that DEBT is piling up 700% faster than real growth and that is a recipe for tremendous volatility across all financial assets!
The financial system is facing a debt crisis.
This is due primarily to the reality that The Real Rate of Return on U.S. Treasuries is negative. This trusted benchmark is signaling to the world that if you lend the US government money, you will lose money after inflation is factored in. Stated another way, the words “risk-free” have been distorted to mean you will lose. Since risk-free returns are central to all portfolio theory you can easily understand how this has created wild swings in the markets across all sectors during the recent COVID-19 scare. There is a ton of re-positioning occurring.
The unintended consequence of printing trillions of dollars in debt with these negative real rates of return is that money flows where return on investment grows. Since the risk-free rate of return is now negative, many investors are forced to become shorter-term swing traders looking at much smaller times frames to create positive yield on their portfolios.
It is in environments like this that artificial intelligence is an absolute necessity for finding predictable trend movements that offer profitable returns.
Most traders define risk in one of two ways. The first method is the probability of earning a profit versus the probability of incurring a loss. The second way is the amount of money you could lose compared to the amount of money you could win. But the third way of understanding risk is in ignoring how global financial markets have become intertwined.
One day we’re up 1,000 points… one day we’re down 1,000 points.
The media blames coronavirus… the election… Fed rates… oil prices… Trump… Pelosi….
These are all great story lines that will create enough content to fill up a 24 hour news cycle.
But don’t let what the talking heads are saying, get in the way of being on the right side of the trend.
For example, after the SARS crisis in 2003, the S&P 500 quickly dropped by almost 15%…
And it rebounded by double-digits within just one month. Vantagepoint kept Power Traders on the right side of the trend every step of the way.
It was a similar rebound story after the Ebola crisis in 2014.
Here are some charts of the recent selloffs over the last two years, please notice how the artificial intelligence kept traders on the right side of the trend.
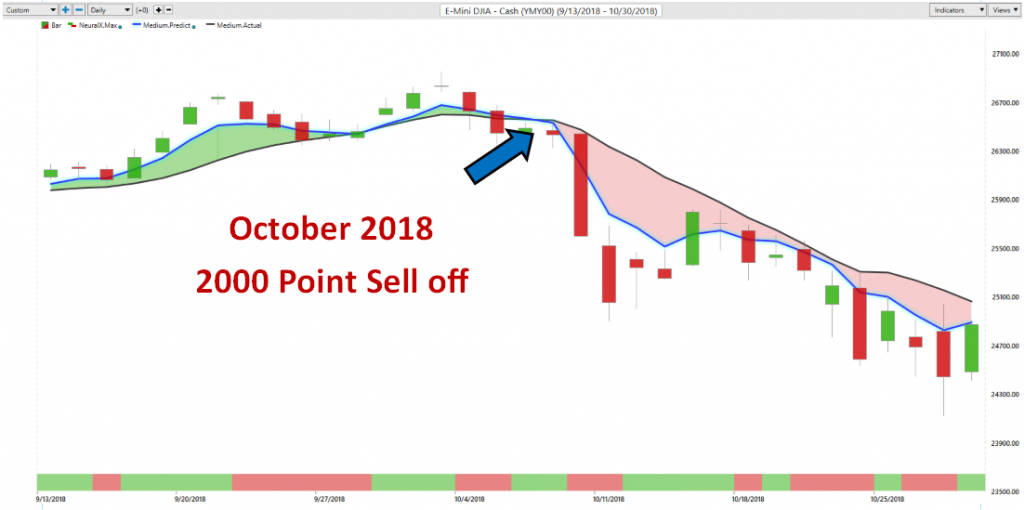
October 2018 Selloff
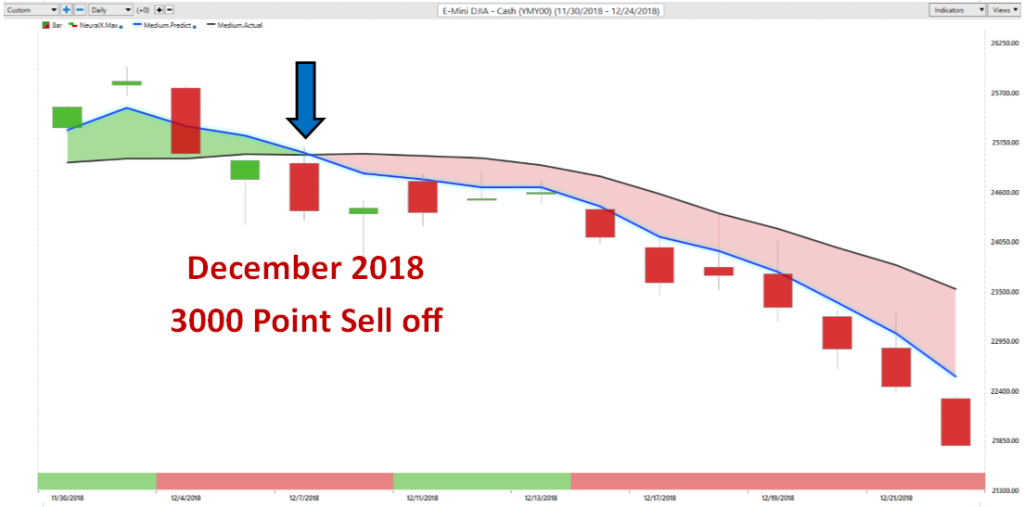
December 2018 Selloff
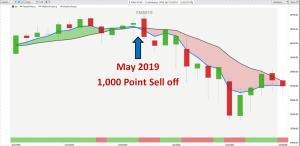
May 2019 Selloff
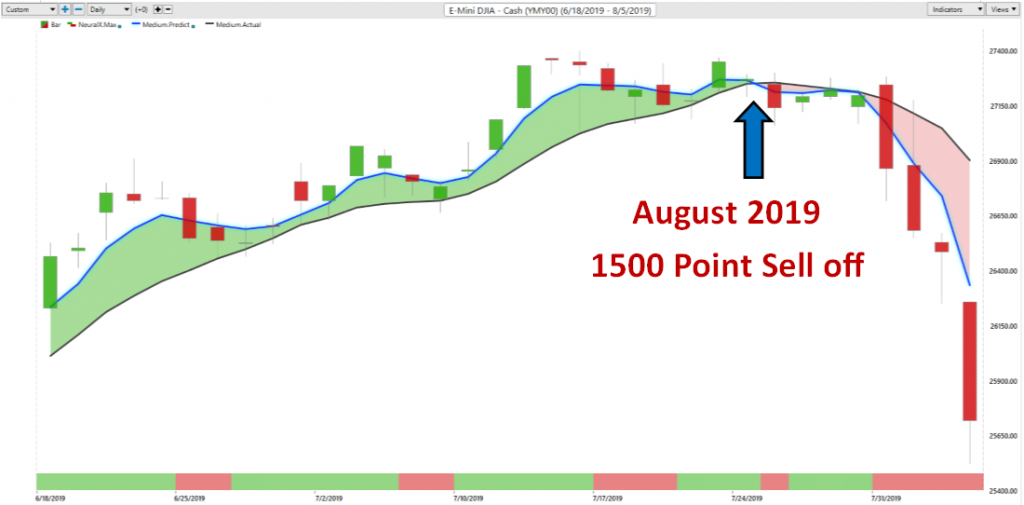
August 2019 Selloff
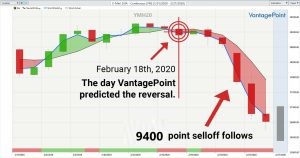
February 2020 – 9400 Point Selloff
The reality is that it is humanly impossible for any trader to understand how the key drivers of price for each asset will affect markets. The only way to do so is through Intermarket analysis, machine learning and neural networks. These technologies allow traders to know where the safe havens are and what the future trends are.
VantagePoint uses these neural networks to identify which global markets have the most influence on a target market, then produces a set of Intermarket data to generate predictive technical indicators that give you short-term price and trend forecasts.
Once you know what the key drivers of an asset are, the artificial intelligence will very accurately forecast the price 1 to 3 days in advance with up to 87.4% accuracy.
The beauty of artificial intelligence is that it looks at these global correlations for each asset statistically to uncover the best opportunities and trends.
COVID-19 has put the U.S. economy in a tailspin and there are many fractures in the markets. Many businesses will not be able to survive a lengthy shutdown which poses major liquidity issues in the markets as well.
Isaac Newton stated that “a trend in motion, tends to remain in motion until it is stopped.” The risk is too high for opinions or guesswork. We will keep an eye on the government printing presses, but the a.i will guide our trading every step of the way.
Over the coming weeks, you can rest assured that Vantagepoint Power Traders will continue to build wealth one trend at a time, even in these volatile conditions.
I invite you to check it out at our Next Live Training.
It’s not magic. It’s machine learning.


