


“Follow The Leader” Works In Financial Markets Too!
Do you remember playing the children’s game “Follow The Leader?” A leader or “head of the line” is chosen, then the children all line up behind the leader. The purpose of the game is for the children to mimic the leader’s actions and behaviors as they move about. Those players in line who fail to do what the leader does are out of the game.
While this game is for children, it’s also good training for stock traders looking for success in the financial markets.
If I were to summarize as concisely as possible what understanding is needed for great success in the trading world it would be two words – “STRONG/WEAK.”
As a trader you need to know what is strong and what is weak. Ideally, you look to position yourself to buy what is strong and sell what is weak in anticipation the current existing trend will continue moving forward.
The major problem many traders have with this idea is that we are conditioned to “buy low and sell high.” While that idea certainly has merit, its first cousin is the perspective of “Buying High and Selling Higher.”
Every stock within every sector of the financial markets can be measured and compared to determine how strong something is relative to its leader. If for example, Microsoft (MFST) is the leader in the software niche and it is up 15% on the quarter, everything is compared relative to Microsoft’s performance. This very simple action separates the leaders from the laggards. One easy way of tracking “leadership” across all sectors is by monitoring stocks that are making a new 52 week high.
Let’s draw a comparison to a story from the world of Track and Field. On May 6, 1954, Roger Bannister busted through the four-minute mile barrier with a time of three minutes, fifty-nine and four-tenths of a second. This achievement had long been considered impossible. However, Bannister’s accomplishment signaled to the world that it could be done. Over the last half century, more than a thousand four hundred runners have conquered a barrier that had once been considered hopelessly out of reach. Only six weeks after Bannister’s historic feat, Australian John Landy broke the record by a full second at 3:58 at a track meet in Finland, throwing down the gauntlet. Today the world record for the mile is 3 minutes, 43 seconds and 13 hundredths. Almost 17 seconds faster than Bannisters accomplishment. The point that I am making is that everybody in the world was ranked according to Bannister’s time. Bannister was the world leader, and leadership from all other countries was challenged to do their best based upon his accomplishment.
This same phenomenon occurs in the financial markets. A massive success by one company forces all other companies to re-organize their infrastructures and pursues new possibilities based upon what the leader had done.
The 52 week high represents the highest closing price that the stock has traded at over the last 52 week period. Movement around the 52 week high is a bellwether indicator that signals the stock is doing the best that it has done over the last year’s time frame. Generally speaking, it’s believed that a stock that has broken through this barrier will continue moving higher.
Can it be this easy?
Yes and No.
You can quickly put these 52 week high stocks on your analytical radar by finding these movers on any online financial portal. Monitoring the number of stocks hitting new 52 week highs also very much correlates to the health of the overall market.
The 52 week high is a marker which communicates to the world that the stock is performing at the “best performance of the last year.” This price level can and often does act as very solid resistance towards further advancement. However, a strong close above the 52 week high indicates that “even more” improvement is underway. So, it empowers a trader to be very aware of this price level on the assets they are trading in their portfolio.
What is very fair to say is that as a stock trades at its 52 week high, a greater amount of information is continuously being re-evaluated in the stock, leading to more short term volatility in the assets price. The “52 week high effect” perceives that stocks with prices close to the 52 week highs have better subsequent returns than stocks with prices far from the 52 week highs. Traders use the 52–week high as an “anchor” and a very important “marker” which they value stocks against. This sometimes is also referred to as the leadership effect.
A stock that reaches a 52 week high, but closes negative on the same day, week or month may have topped out. This means that its price may not go much higher in the near term. This is because stocks making new 52 week highs are often the most susceptible to profit taking, resulting in pullbacks and trend reversals. For the newbie, a stock that hits a new 52 week high seems to be announcing an imminent fall in price. For the seasoned trader they know the new high is a powerful buy signal that attracts investors. It goes against the grain of traditional wisdom to buy something that continues to increase in price as we are continually told to buy low and sell high but understanding why this belief can be a fallacy requires a bit of experience to appreciate. There is great opportunity to buy high and sell even higher.
To appreciate the simplicity of this strategy all you have to do is access your daily charts in VantagePoint Software and simply draw a horizontal line whenever you encounter a 52 week high or automatically see the 52 week high with the VantagePoint 52 week high Indicator. You will quickly come to appreciate that this boundary is very similar to Roger Bannister’s 4 minute mile record! It literally communicates to the world that something very vital and important is occurring in the underlying asset.
Markets will usually test a high before ultimately breaching it. Traders that use this strategy look for a stock that has significant momentum, indicating that it wants to breakout above the boundary. Once the stock pulls back the first time, it may take a few days to a few weeks for a stock to try to reclaim that position. But once a successful breach occurs it’s not uncommon for the stock to continue posting new highs well into the future.
Some very simple math is in order that can prove to be helpful in defining normal ranges and stop loss placement. To determine the normal weekly range for a stock, subtract the stocks 52 week low price from its 52 week high price and that will give you an annual price range. Divide that annual price range by 52 and that will give you a weekly price range.
For example, let’s say that a stock has a 52 week high price of $100. It has a 52 week low price of $48. When we subtract $48 from $100 we come up with an annual range of $52. We divide that annual range by 52 and we come up with an average weekly price range of $1.
Below are charts of some of the FAANG stocks so you can firsthand witness this phenomenon. The horizontal lines represent 52 weeks highs. As you observe them notice how they are powerful barriers and boundaries of future price action.
Become aware of these ANCHORS on the stocks you trade, and you will see your results dramatically improve!
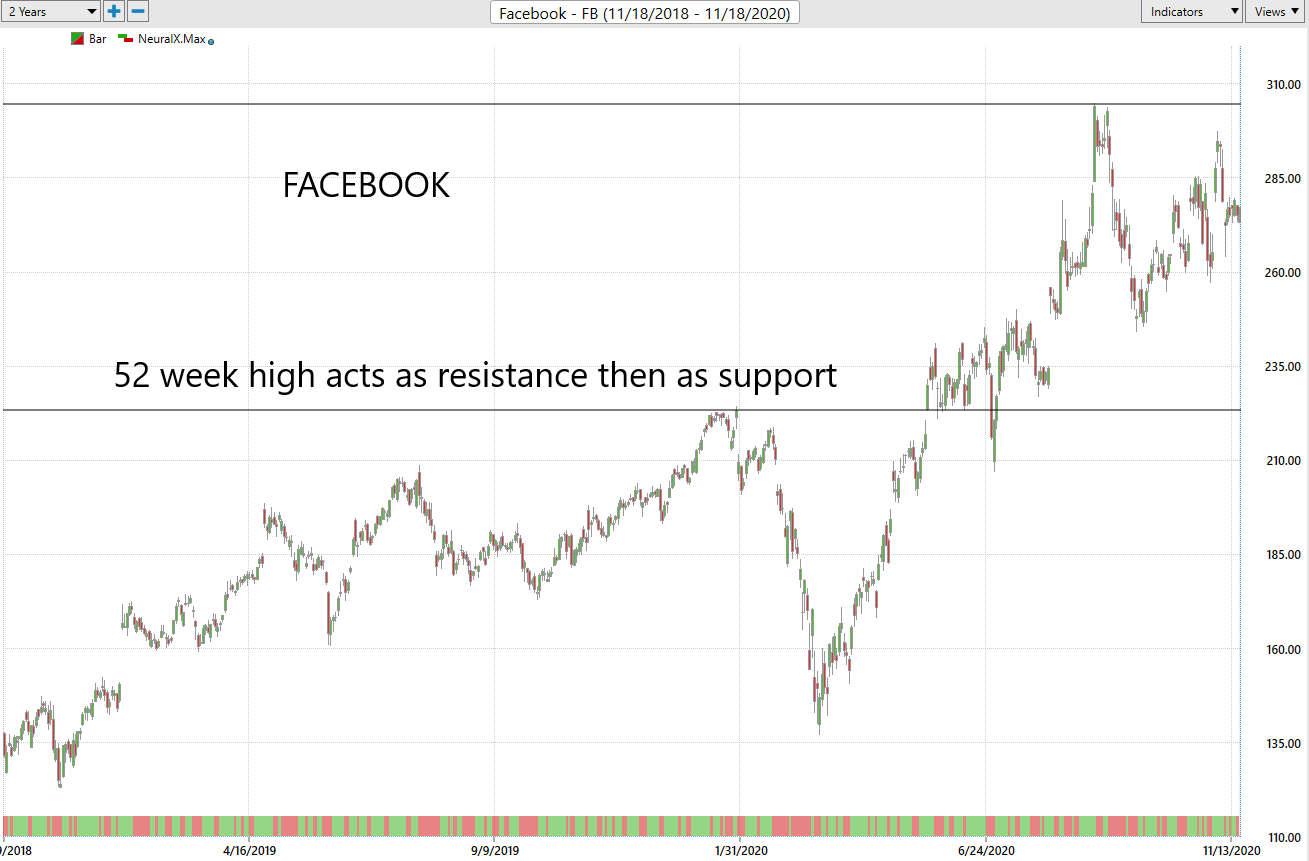
Facebook with 52 Week Horizontal Lines
APPLE (AAPL)
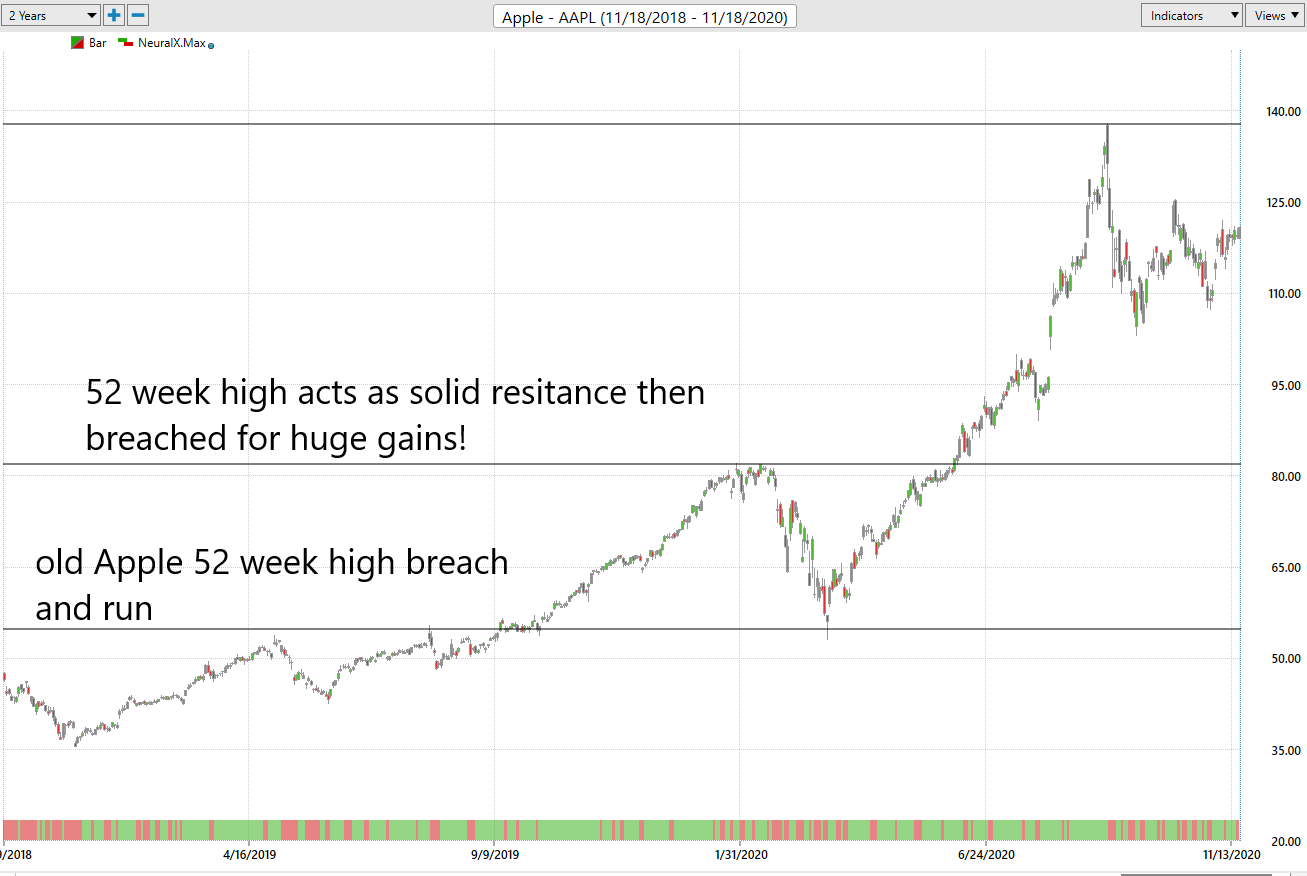
Apple (AAPL) With 52 Week Horizontal Lines
Amazon (AMZN)
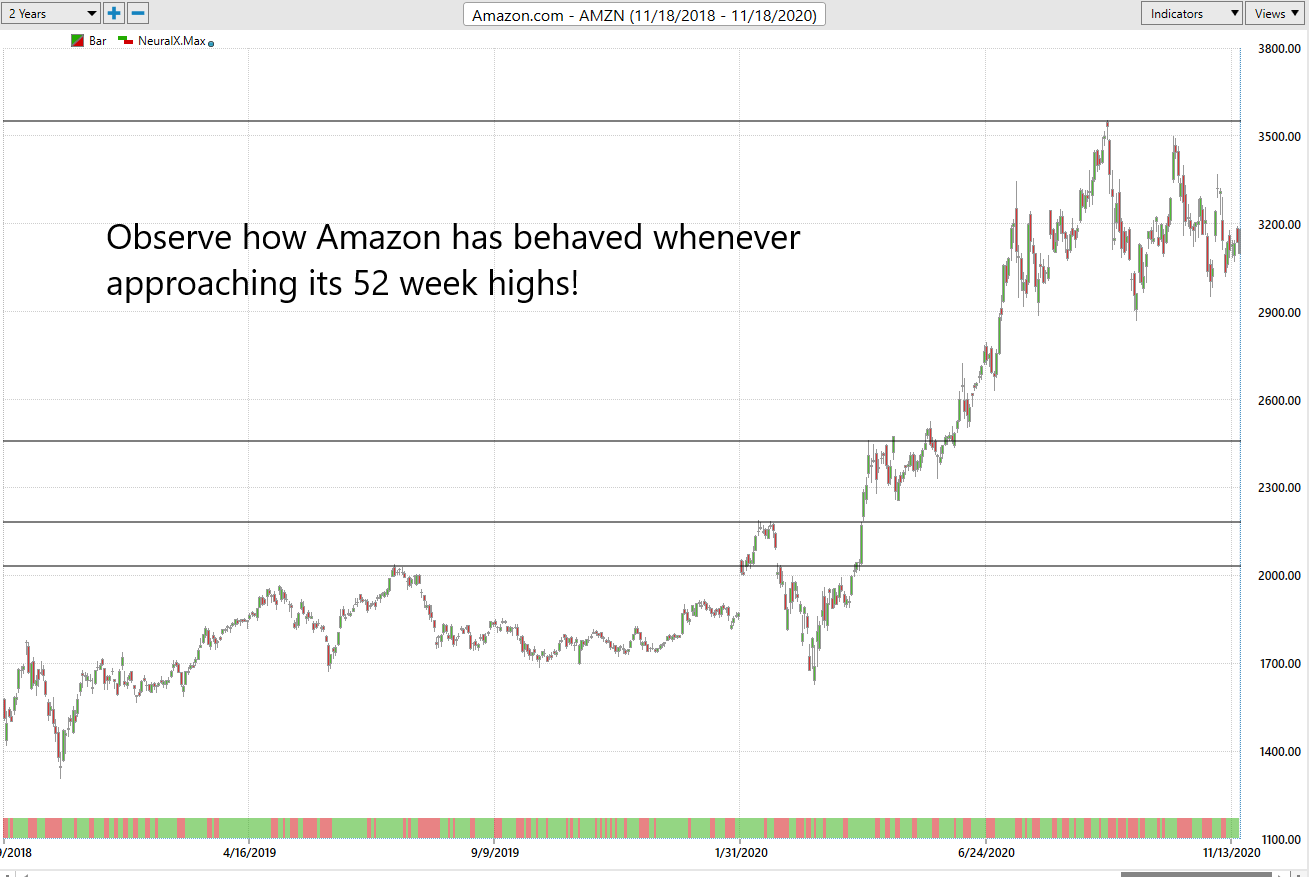
Amazon (AMZN) With 52 Week Horizontal Lines
NETFLIX (NFLX)
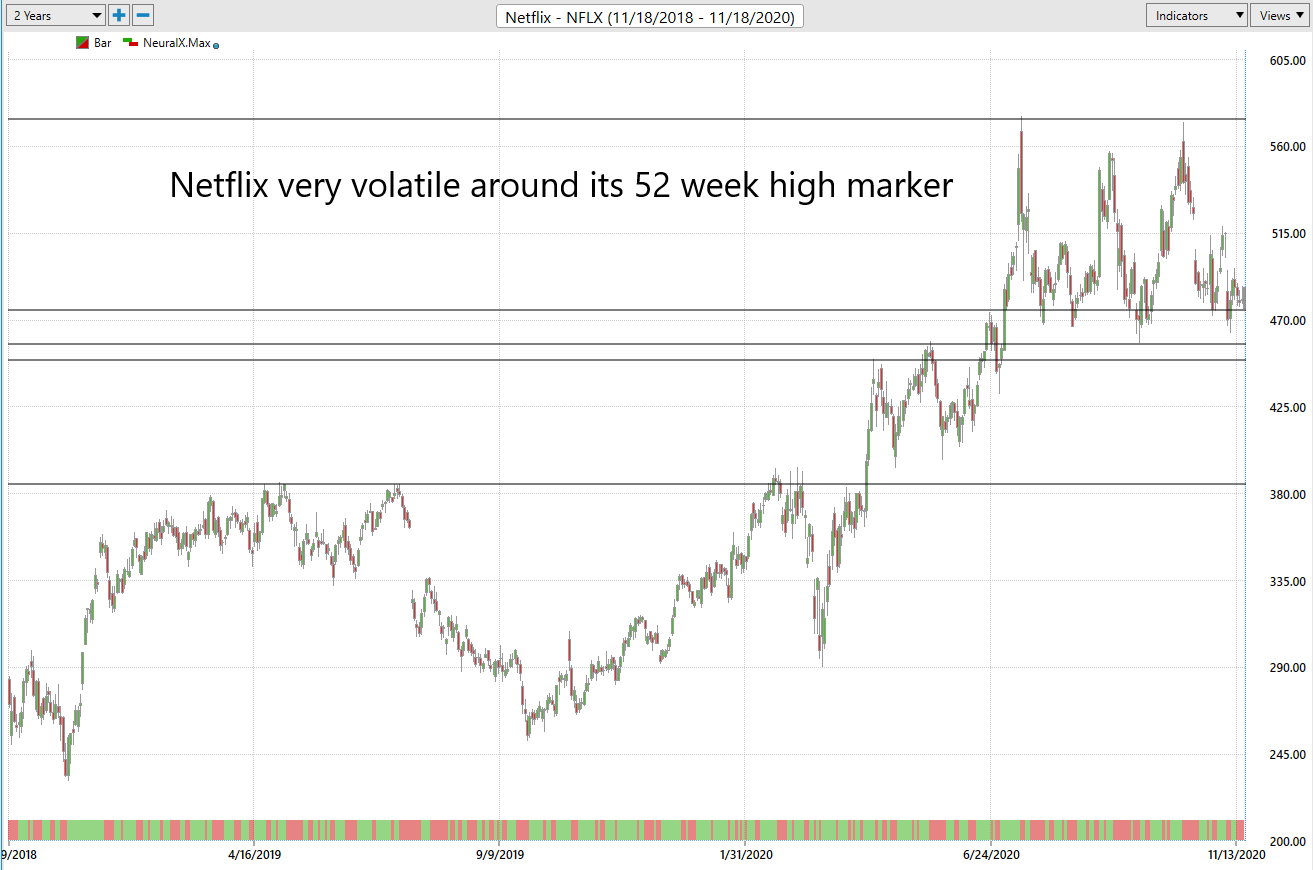
Netflix (NFLX) With 52 Week Horizontal Lines
When you cross reference the 52 week high with VantagePoint artificial intelligence forecasts you can really create some powerful profit opportunities as well.
Artificial intelligence scans thousands of data points to make the calculation of the best move forward. This is invaluable for traders.
Here is the Vantagepoint A.I. Amazon forecast from this past summer. The horizontal line is the previous 52 week high. Notice how the artificial intelligence forecasted a higher market before the breach and how the market ran 35% higher in a matter of weeks.
Amazon with Vantagepoint A.I. Forecast 5/28 through 7/21/2020
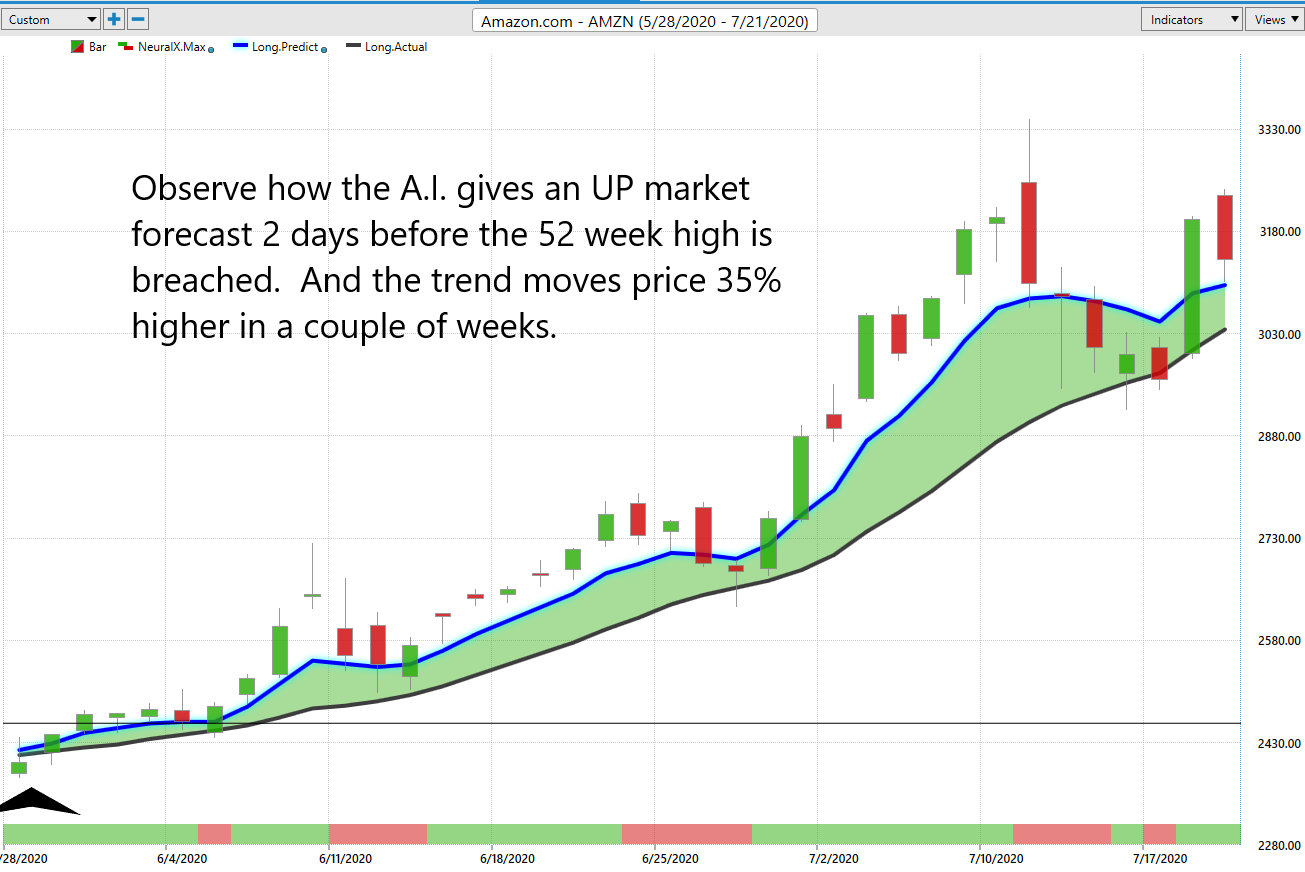
Amazon (AMZN) With Vantagepoint A.I. Short Term Forecast
The 52 week high can easily and quickly be applied across all sectors and asset classes. The basic idea is the same. Where is the asset trading in relation to the 52 week range? How is the price behaving when it tests its 52 week high?
Trading assets that are testing their 52 week highs is one of my all time favorite tactics when I cross reference it with the power of artificial intelligence. It presents the knowledgeable trader a way to seize volatility for great gains.
Here is a very recent chart of BITCOIN (BTC) with the Vantagepoint Artificial Intelligence Forecast.
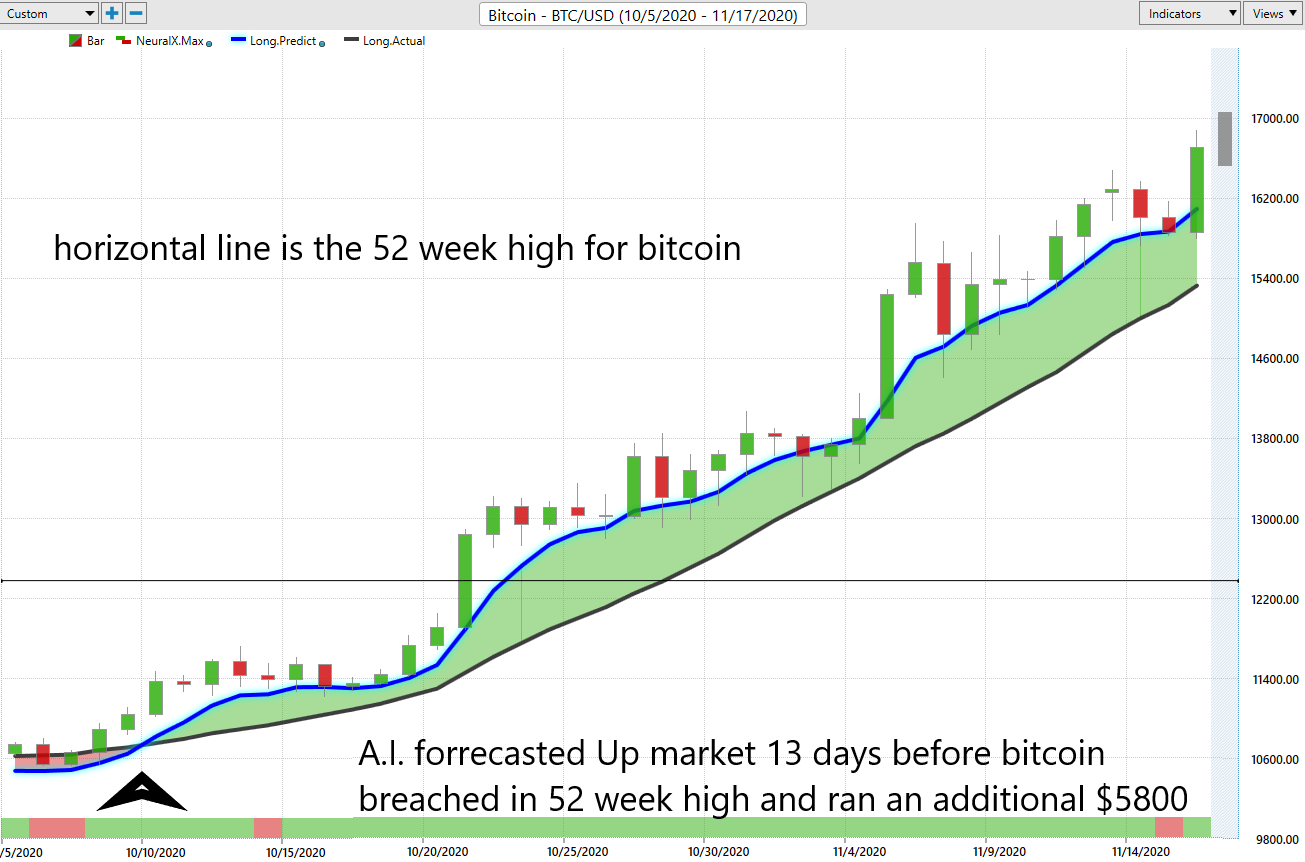
Bitcoin With Vantagepoint A.I. Short Term Forecast
This is where artificial intelligence comes in and why it is so powerful.
A.I., through advanced pattern recognition, analyzing tens of thousands of data points, and crunching millions of computations, finds the highest probability trades and is indispensable in separating fact from fiction.
The power of artificial intelligence is designed to keep you focused on the right side of the market at the right time. Never trading on hope or toxic emotions.
Isaac Newton stated that “a trend in motion, tends to remain in motion until it is stopped.” The risk is too high for opinions or guesswork.
Remember that ai has defeated humans at Chess, Poker, Go and Jeopardy. Why should trading be any different?
I invite you to check out artificial intelligence at our Next Live Training.
It’s not magic. It’s machine learning.
Make it count.
IMPORTANT NOTICE!
THERE IS SUBSTANTIAL RISK OF LOSS ASSOCIATED WITH TRADING. ONLY RISK CAPITAL SHOULD BE USED TO TRADE. TRADING STOCKS, FUTURES, OPTIONS, FOREX, AND ETFs IS NOT SUITABLE FOR EVERYONE.
DISCLAIMER: STOCKS, FUTURES, OPTIONS, ETFs AND CURRENCY TRADING ALL HAVE LARGE POTENTIAL REWARDS, BUT THEY ALSO HAVE LARGE POTENTIAL RISK. YOU MUST BE AWARE OF THE RISKS AND BE WILLING TO ACCEPT THEM IN ORDER TO INVEST IN THESE MARKETS. DON’T TRADE WITH MONEY YOU CAN’T AFFORD TO LOSE. THIS ARTICLE AND WEBSITE IS NEITHER A SOLICITATION NOR AN OFFER TO BUY/SELL FUTURES, OPTIONS, STOCKS, OR CURRENCIES. NO REPRESENTATION IS BEING MADE THAT ANY ACCOUNT WILL OR IS LIKELY TO ACHIEVE PROFITS OR LOSSES SIMILAR TO THOSE DISCUSSED ON THIS ARTICLE OR WEBSITE. THE PAST PERFORMANCE OF ANY TRADING SYSTEM OR METHODOLOGY IS NOT NECESSARILY INDICATIVE OF FUTURE RESULTS. CFTC RULE 4.41 – HYPOTHETICAL OR SIMULATED PERFORMANCE RESULTS HAVE CERTAIN LIMITATIONS. UNLIKE AN ACTUAL PERFORMANCE RECORD, SIMULATED RESULTS DO NOT REPRESENT ACTUAL TRADING. ALSO, SINCE THE TRADES HAVE NOT BEEN EXECUTED, THE RESULTS MAY HAVE UNDER-OR-OVER COMPENSATED FOR THE IMPACT, IF ANY, OF CERTAIN MARKET FACTORS, SUCH AS LACK OF LIQUIDITY. SIMULATED TRADING PROGRAMS IN GENERAL ARE ALSO SUBJECT TO THE FACT THAT THEY ARE DESIGNED WITH THE BENEFIT OF HINDSIGHT. NO REPRESENTATION IS BEING MADE THAT ANY ACCOUNT WILL OR IS LIKELY TO ACHIEVE PROFIT OR LOSSES SIMILAR TO THOSE SHOWN.

