


Understanding Risk: Infinite Elvises and the Exponential Function
On August 16, 1977 when Elvis Presley died, there were 2,500 Elvis impersonators operating in the US.
Three years later, in 1980, that number had grown to 4,000.
By 1990, it had blossomed to 12,000.
In the year 2000, it was 32,000.
In 2010, it was 84,000.
These statistics clearly highlight a trend and it would be very easy to conclude that by the year 2100, one out of every three Americans will be a full time Elvis impersonator!
Huh? What?
Be prepared people, major shortage of Jelly Doughnuts next century! While it is not widely known, the King of Rock and Roll was a strong aficionado of the Krispy Kreme Raspberry Jelly Doughnut.
I share this anecdote to discuss the inherent problem with statistics. It is very easy to draw conclusions from some metrics. Often times these conclusions are neither useful nor accurate. Sometimes lazy logic is to blame, but more often than not there are huge faults in the assumptions built into statistical modeling.

This is important during today’s financial environment, particularly during the pandemic as we are peppered with numbers that imply very dangerous conclusions.
One of the most challenging issues for people is understanding what mathematicians refer to as the exponential function.
When something is projected to grow exponentially at first it appears rather harmless. But there comes a point of reckoning in its exponential growth curve where its speed and quantity wreak havoc upon everything in its path. This has recently occurred with the projected growth of the COVID-19 virus as well as the United States Sovereign debt.
The simplest way of understanding the “exponential” is to use the parable of the chessboard as a guide.
There was a king in India who was a big chess enthusiast and enjoyed challenging wise visitors to a game of chess. One day a young traveling sage was challenged by the king. This young sage having played this game all his life all the time with people all over the world gladly accepted the King’s challenge.
To motivate his opponent, and to make the challenge as interesting as possible, the king offered any reward that the sage could name. The sage modestly asked just for a few grains of rice in the following manner: the king was to put a single grain of rice on the first chess square and double it on every consequent one. The king confidently accepted the sage’s request.
The King lost the game of chess and immediately ordered a bag of rice to be brought to the chessboard. Then he started placing rice grains according to the arrangement: 1 grain on the first square, 2 on the second, 4 on the third, 8 on the fourth and so on.
Following the exponential growth of the rice payment, the king quickly realized that he was unable to fulfill his promise because on the twentieth square the king would have had to put 1,000,000 grains of rice. On the fortieth square, the king would have had to put 1,000,000,000 grains of rice. And, finally, on the sixty-fourth square, the king would have had to put more than 18,000,000,000,000,000,000 grains of rice which is equal to about 210 billion tons and is allegedly sufficient to cover the whole territory of India with a meter thick layer of rice.
It was at that point that the sage told the king that he doesn’t have to pay the debt immediately but can do so over time. The King convinced that he had been swindled immediately ordered the young sage to be executed. This parable demonstrates how ignorance of mathematics is not an excuse for not knowing the consequences created by the exponential growth of a liability.

This graphic communicates exponential growth covering only half of the chess board.
From the one grain of rice on the first square of the chessboard, the amount increases to the point that by the time you get to square 64, there are over 18 quintillion grains of rice on the board. Investors all look for that type of growth from an asset. But when what we are dealing with is a liability the path is fraught with utter destruction.
The lesson is this: exponential growth cannot be sustained because well before you get to the end of the chessboard, you’ve hit the physical limitations of mathematics, and the growth either leads to a dramatic downturn or a complete elimination of the problem.
Two very interesting parallels to this story, which demonstrate the perils of exponential growth are the Sovereign debt of the United States as well as the progression of the COVID-19 virus. Both of which are occurring simultaneously.
Consider the following, for the first 232 years of the United States existence, the US had built a National Debt of $10.025 trillion dollars. However, in the last 12 years alone we have spent over 160% as much, or $16 trillion.
Stop and think about that!
What does that portend for the next twelve years?
The numbers are worthy of every trader’s consideration as history clearly demonstrates that currencies are eventually devalued when this amount of new debt is added to an economy. Simply servicing the interest load on that debt is quickly rising to become one of the largest items on the nation’s budget.
In this same regard, we can learn quite a bit when we examine the statistics provided by the Centers for Disease Control and the World Health Organization regarding the spread of the COVID-19 virus. The contagion factor is statistically expressed as R naught , or R0. This number mathematically expresses how fast the virus spreads.
If R0 is less than 1, it means that the virus does not spread well and dies out quickly. If R naught is greater than 1, the virus spreads.
If R naught is two, this means that one person infects two more people, those two people infect four more people. This is similar to the classic doubling that we saw in the chessboard example.
With an R0 of three, here is what exponential growth in the spread of COVID-19 looks like.
-
Day 5: 81 new people would be infected.
-
Day 10: Nearly 20,000 more people would be infected.
-
Day 15: Almost five million new cases.
-
Day 18: An additional 129 million would be infected.
-
Day 20: Over 1.1 billion new cases.
These numbers clearly explain why the American Economy is in lockdown! I share them with you simply so you can ponder what the implications and how different the forecasts are in the models for an R1, R2, R3, R4 or above to anticipate the future trajectory of the virus. But it is also worth pondering how wrong a forecast can be based upon an improper estimate of R naught.
History alone will prove how accurate those models actually are. But if you understand the mathematics of the chessboard example you can easily surmise how important it is to get the model as close to correct, at the beginning.
Over the past few months, as the COVID-19 virus has spread throughout the world we have all witnessed the sheer power of exponential contagiousness. All of societies great problems whether in health and public safety, or with regards to the economy, stem from being unable to keep destructive exponential forces in check.
We live in an exponential age and among the greatest shortcomings of the human race is our inability to confront and understand the exponential function.
Exponential growth is a wonderful thing if it is occurring to an asset. However, when it occurs to a liability it is among the most destructive things that a civilization will ever witness. That applies to the health of individuals as well as to the vitality of the economy and the markets that compose it.
Why is this important?
As a trader one of the most important realizations you will have is recognizing you need to be tuned in to the REAL NEWS that is affecting the market. That is rarely portrayed in the form of reporters’ stories about what they think is happening in the economy and the world. Since we live in a global marketplace the critical factors that affect a trader’s portfolio lie in recognizing and understanding the key drivers of an assets price. All markets are statistically correlated in some manner. Artificial intelligence, machine learning and neural networks focuses exclusively on these relationships to create very accurate forecasts.
Most traders constantly bewilder themselves by trying to relate the top news stories to their trading decisions.
Do you ever read the headlines in the media and wonder how it’s going to affect your trading?
- COVID-19
- Trade War with China
- Oil Market Collapse
- Brexit
- Debt Growth
- Recession Concerns
- Currency Devaluations
- Negative Interest Rates
How do you make sense of it all? How does it affect your portfolio? I think you would agree that even the news is growing exponentially today!
The challenge facing every trader is trying to make sense of the tsunami of financial information to make better trading decisions.
Quite a challenge!
There is literally an exponential increase in information that traders are confronted with every day. You simply can’t keep up with it all – no matter how hard you try!
That’s why successful traders use artificial intelligence to find the best markets and the best time to trade. In today’s ever-changing financial environment, it’s almost impossible to find safe, reliable ways to invest your savings and plan for retirement. That makes your search for investment wisdom — vitally important.
Consider the following graphic of TESLA which shows the TOP KEY DRIVERS of Teslas Stock price:

TESLA Key Drivers
This shows the top 31 markets that the that are the top direct drivers of TESLA’s stock price.
This is the REAL FACTS that affect the future price of TESLA.
Then the artificial intelligence evaluates all of these relationships to create the following trend forecast.
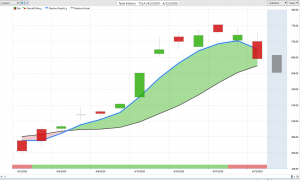
TESLA Trend Forecast
Instead of wrestling with the news and rolling the dice, the artificial intelligence digests all of the market information to deliver price forecasts that have proven to be 87.4% accurate.
Who do you think can make better financial decisions, you or artificial intelligence?
The beauty of artificial intelligence is the ability to analyze global market influences and find hidden patterns and relationships for each stock, safely uncovering the best opportunities and trends.
Your assets… your savings… your retirement… everything you’ve worked so truly hard for… they don’t have to be at risk any longer.
Artificial Intelligence is no longer just for the large Wall Street Mutual Funds and ultra-wealthy. Today small traders are getting big results because of a.i.
Intrigued? Join us for a Free Live Online Training Lesson.
Discover why artificial intelligence is the solution professional traders go-to for less risk, more rewards, and guaranteed peace of mind.
Visit with us and check out the a.i. at our Next Live Training.
It’s not magic. It’s machine learning.
Make it count.

