


VantagePoint AI Market Outlook for the Week of August 24, 2020
VIDEO TRANSCRIPT
U.S. Dollar Index
Hello, everyone, and welcome back. My name is Greg Firman, and this is the VantagePoint AI Market Outlook for the week of August the 24th, 2020. Now to get started this week again, we begin where we always do, with the very important U.S. dollar index, a driving factor in the financial markets. Now, what we can assess here, looking at the VantagePoint software is we’ve come up to a major resistance area again, as identified by the T cross long. That area now this week is at 9338. In my respectful opinion, if the market can clear, the dollar can clear this major hurdle, we could extend higher, but we still have significant resistance coming in at the 9389 high. So to take the pressure off of the downside on the U.S. dollar, it has to break about the 94 area.
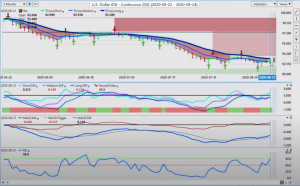
U.S. Dollar Index
Because, again, this resistance has been very, very strong for several weeks now. The dollar appears to be channeling and by first glance, we could be looking at another leg down. So again, if we can break through that level right now, our predicted RSI is rising, but it’s not above the 60 level, very close. Our predicted MACD is in recovery mode, but the neural index has been very firm for the last three or four trading sessions that the dollar is going higher. Our medium-term crossing, our longterm predicted difference has not crossed yet. Now, when we click on our F8, we can see that the market is cleared. The first major hurdle that’s at 9299. So again, we’ll monitor these levels, but in my respectful opinion, again, we must break free and clear of the 94 level if the dollar has any chance of moving higher.
Gold
Now, one of the things that’s helping the dollar move higher is of course gold moving lower. My concern here, of course, is that we do have a trend line forming off of here now. So if we draw our trend line, we can see that that resistance area is going to come in around the 2000 mark. However, our short and medium-term is starting to cross over our longer-term pivot area. That level now is coming in again at 1962, very similar level to where we were last week. So what gold must do is get back up above that level and stay above that level. Now, we had a recovery this week, but it was very short-lived. And again, we’ve failed. We have got to swing high, two bars to the left, and two bars to the right that are lower than this highest point.
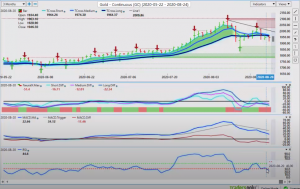
Gold
So for now, gold is taking on somewhat of a bearish tone. We look at our predicted MACD crossing down. We’ve got our RSI that is breaking below 40, but again, we’re in summer trade here, guys. September is just around the corner. We’re going to have real money flows coming back in. So again, I would be very cautious with gold unless we can break back up above that 19.62 mark. Now again, when we look at our F8, we can see where our resistance is coming in, where the gold is struggling. When we closed below that predicted moving average, we have come back up two days in a row to test this level at this 1963 mark and failing both times. So again, all of our resistance is sitting right there. And if we know what, what indicators to use, we can get a good feel for this.
Now, the neural index is down, but our medium-term crossing, our longterm predicted difference suggest that gold may not be down and out yet here, so watch that key level.
S&P 500 Index
Equities, of course, are definitely benefiting from gold moving lower here. The S&P 500 relentless in its extension higher.
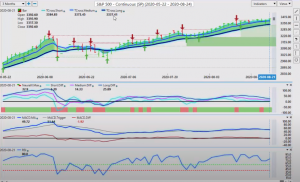
S&P 500 Index
Now for this coming week, we’re looking at 3337. Only sustained break below this particular level will take the pressure off the top side. Shorts have been very, very difficult on the S&P 500. Longs consistently works, particularly well using these key VantagePoint pivot areas. We can see this past week that we’ve come down and tested this low down around 3331, only to go screaming higher off of that key VantagePoint pivot area. Now, when we click on our F8 here, we can see that the picture’s not quite as clear. We’re holding above this level 3378, so to start the week we’re looking to hold about those two affirmation levels. Oil will continue next week to follow equity markets, whether it be up or down.
Crude Oil
But as you can see, oil is really struggling in these verified resistance zones. We’ve made a slight new high this past week, but we’ve done absolutely nothing since.
Crude Oil
In my respectful opinion only, again, if the S&P 500 inevitably breaks higher, it will likely pull oil up with it. So for now, we watch the 42 level. We’ve got additional verified support down to 4117. Longs still favorable while the equities are strong.
Bitcoin
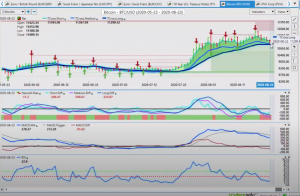
Bitcoin
Now, once again, this week, working it into the weekly outlook, I think that Bitcoin is something we all should be looking at. When you have an asset class that doubles or triples every year, that’s a pretty decent investment here, guys. So right now to start the week, if the dollar does extend its gains, then Bitcoin is likely going to come under a little bit of pressure. 11,290 is the key level we want to watch. Our neural index is saying we’re going lower. Our RSI is starting to flatten out here though, so we want to keep an eye on this. But again, if you’re trading Bitcoin, keep Bitcoin, keep an eye on the dollar index, because that can be a leading indicator, as can gold. If gold can recover, again, I think you will see Bitcoin follow gold. So we look to see what the next move is on the dollar to determine a number of different trades here.
Euro versus U.S. Dollar
That brings us to our first currency pair, Euro/U.S. The Euro really struggling up anywhere near the 119 area. Again, a classic false break here, up around just over the 119, the bulls get very comfortable up around 119, only to have the rug pulled out from underneath them. And we see the Euro taking a substantial drop. The Euro really has done nothing for the last several weeks. It’s hovering up around here, but we are having these retracements down to the key VantagePoint level. 11,780, guys, that’s the level to start the week. If you’re a Euro buyer, you want to see this currency hold above this particular level. If we start slipping below that, we close below this, expect to see the Euro make a deeper corrective move. But it is above its yearly opening price at 112. The Euro is still technically and fundamentally bullish, but again, we need to hold these level. If we click on our F8, we can see that we’ve lost that key VantagePoint pivot area.
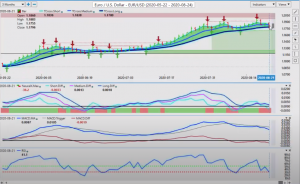
Euro versus U.S. Dollar
That level, 11,837 will be your resistance to start the week. If we get back up above one 11837, the Euro will likely make a move back towards the 119, 120 area. But again, we must get over that particular level.
U.S. Dollar versus Swiss Franc
The U.S./Swiss franc, the alternate to the Euro/U.S., you can see that it falls the dollar index almost to the letter. We’re stalling up here at 91.23. If, and that’s a very big if, we can break above this level, the Swiss franc has been one of the strongest currencies into the Forex Market along with the Japanese yen. So right now we’re looking for it to break above this, but it will take its lead for Euro/U.S. If Euro/U.S. recovers and starts moving higher, U.S./Swiss franc will absolutely move lower. But if we get up above 91.23, we could extend up to the next verified resistance zone. That area coming in just under the 92 level. The RSI, pretty neutral, slightly bullish here. MACD has crossed. Neural index is saying we’re going higher. So we may have a long trade here right now. Watch this former week support, which is now a verified supports zone, by the way, 90.10. As long as we’re holding above 90.10, the U.S./Swiss franc does have a chance of moving higher.
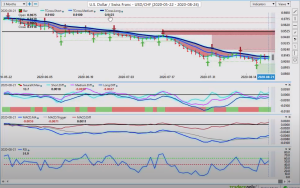
U.S. Dollar versus Swiss Franc
British Pound versus U.S. Dollar
Now, this is not a coincidence, the pound/dollar sterling at this verified resistance zone. This is coming in at the high of 13,266. For the many viewers watching this, that is also the yearly opening price for the pound/U.S. dollar. Again, the pound is potentially being misinterpreted, that this is a very bullish pair. But if you bought the pound/dollar on January 1, you have consistently lost money. Again, it opened the year at the 132 for approximately the 13,240 area.
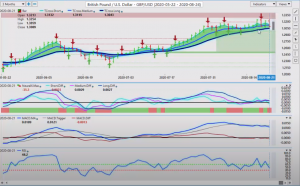
British Pound versus U.S. Dollar
That now becomes our resistance. If the pound/dollar can get above that, guys, this will be a very, very easy, long trade, anywhere above 130, 133. Right now, we can see, however, we’ve got also very strong buying down here off this key VantagePoint level, 13,043. We’ve got additional verified support. That low is going down again into this 130 level. Additional supports staggered down to 12,981. In my respectful opinion, only that longs we’re still viable while above that key level.
U.S. Dollar versus Japanese Yen
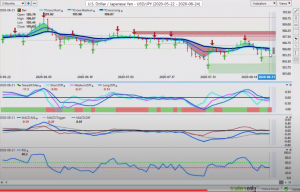
U.S. Dollar versus Japanese Yen
Now, when we look at the dollar/yen for this coming week, again, the dollar/yen is likely going to remain neutral until September here. I think you’ve got some Japan holidays. Be careful with this particular pair, guys. Right now, our resistance, 10,607. If and only if gold continues to sell off, that’s when you will see a reversal on dollar/yen higher. The yen very highly correlated to gold here, guys. So again, if gold cannot recover and start moving higher than the dollar/yen, the downside on dollar/yen is going to be limited likely to last week’s low, coming in around the 10,510 area. So watch this one right now. The VantagePoint indicators are more or less neutral, but with still a bearish tone.
U.S. Dollar versus Canadian Dollar
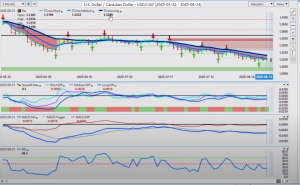
U.S. Dollar versus Canadian Dollar
Now with the U.S./Canadian dollar for next week, once again, here, the Canadian dollar struggling to get back up about these key VantagePoint resistance points. T cross long, 132.88. That’s your main pivot area to start the week. When we click on our F8, we can see that the market is hugging this VantagePoint predicted moving average with the correlation to 31 other markets. We want to watch this pivot area very, very closely. 132.12. If we get above 132.12, we are likely going to make a very quick run up towards that 132.88. If we break 132.88, then and only then does the pressure come off the downside and we extend higher. The VantagePoint indicators are suggesting that we are going higher. To start the week, we’ve got our predicted differences rising, but they’re very neutral.
Australian Dollar versus U.S. Dollar
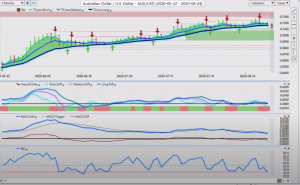
Australian Dollar versus U.S. Dollar
The neural index is up. Again, summer trade here, guys. I wouldn’t get too excited but watch for the opportunity for a potential long. But the other additional information I can give you is that if the S&P 500 does break higher, it’s likely going to take the U.S. CAD lower because oil will follow. Same thing applies to the Aussie and the New Zealand. These are no longer commodity currencies, guys. These are more equity currencies. The Aussie, the New Zealand, the CAD, they’re following the S&P 500. So they will recover if the S&P 500 [inaudible 00:11:30] We really are coming up to a make or break point on the equities and a number of these different currency pairs. Right now, our key pivot for next week, 71.59. We need to hold above that. But the VantagePoint indicators are suggesting that we are going to go lower first. So keep an eye on that key VantagePoint pivot area, along with the verified support zone sitting at 71.09.
New Zealand Dollar versus U.S. Dollar
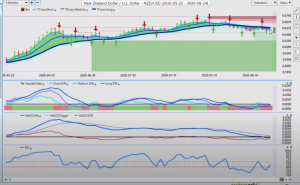
New Zealand Dollar versus U.S. Dollar
The New Zealand dollar will for the most part, follow the Aussie, but it is the weaker of the two. It could be a leading indicator to tell us that the Aussie is getting ready to go lower, and maybe the S&P 500 also. Right now, New Zealand resistance, 65.83. This is the level we want to watch. You can see here that our RSI is starting to recover. It’s moving up, but it’s at 47.9. It hasn’t recovered yet. So when we’re looking at this right now, we’ve got some pretty heavy congested support using the verified zones at the 65.19 area. So we’re going to see if we can bounce off of this area, but it will take a rise in the equity markets to do that. So with that said, this is the VantagePoint AI Market Outlook for the week of August, the 24th-
Are you using A.I. yet?


