


VantagePoint AI Market Outlook for the Week of August 26th, 2019
The Vantagepoint AI Market Outlook is designed to help traders. It’s important to remain aware of correlations in the global markets. Traders can become more profitable if they know how to get ahead of the trends. Utilizing the predictive indicators in VantagePoint Software can help traders find the right trades and the right times. Above all, traders know when to enter and exit those trades for maximum profit. Let’s look at the charts for the U.S. Dollar, Gold, Crude Oil, The Stock Market, Bitcoin, and Major Pairs.
VIDEO TRANSCRIPT
Hello everyone. Welcome back. My name is Greg Firman, and this is the VantagePoint AI Market Outlook for the week of August the 26th, 2019.
The U.S. Dollar
Now, to get started this week, we’re going to begin where we always do with that very important US dollar index, but again, just a reminder that this weekly outlook does look at all of the major markets including some of the major Forex pairs in our trading. So, when we look at the dollar, absolutely the dollar has a very strong correlation right now to the S&P 500, both stocks and the dollar very much under pressure with the trade war. But when we look at our VantagePoint software, the main thing we want to understand here is that we’ve put a top in place on the dollar basically at the beginning of the week. We talked about this in the VantagePoint live trading room each week, but the dollar putting that top in at or about this 98 33 area now coming under significant selling pressure leading into Friday.
But again, if we look at that medium-term crossing the long-term predicted difference with these verified zones up here, warning us that the dollar has significant resistance anywhere above the 98 level, this failure basically has come to fruition as the trade war… Basically, hostilities are increasing, that’s probably an understatement at this particular time, but what we also need to understand is the dollar also has support down here. Using these verified zones to identify that, tells us that we’re still, at least for now, within the range. Now, that lower end of that range is coming in at or about the 96 98 area. More serious support is coming in down at our at or about the 96 32 area, but if we lose this level next week or in the coming weeks at 95 36, we could see a breakout of this range and a new trend formed, obviously, to the downside on the dollar.
Now, very few buyers up here this entire week off that high of 99 35, finally we’ve succumbed, we’re waiting for that signal from VantagePoint, that’s come to fruition, and down we go.
The Gold Market
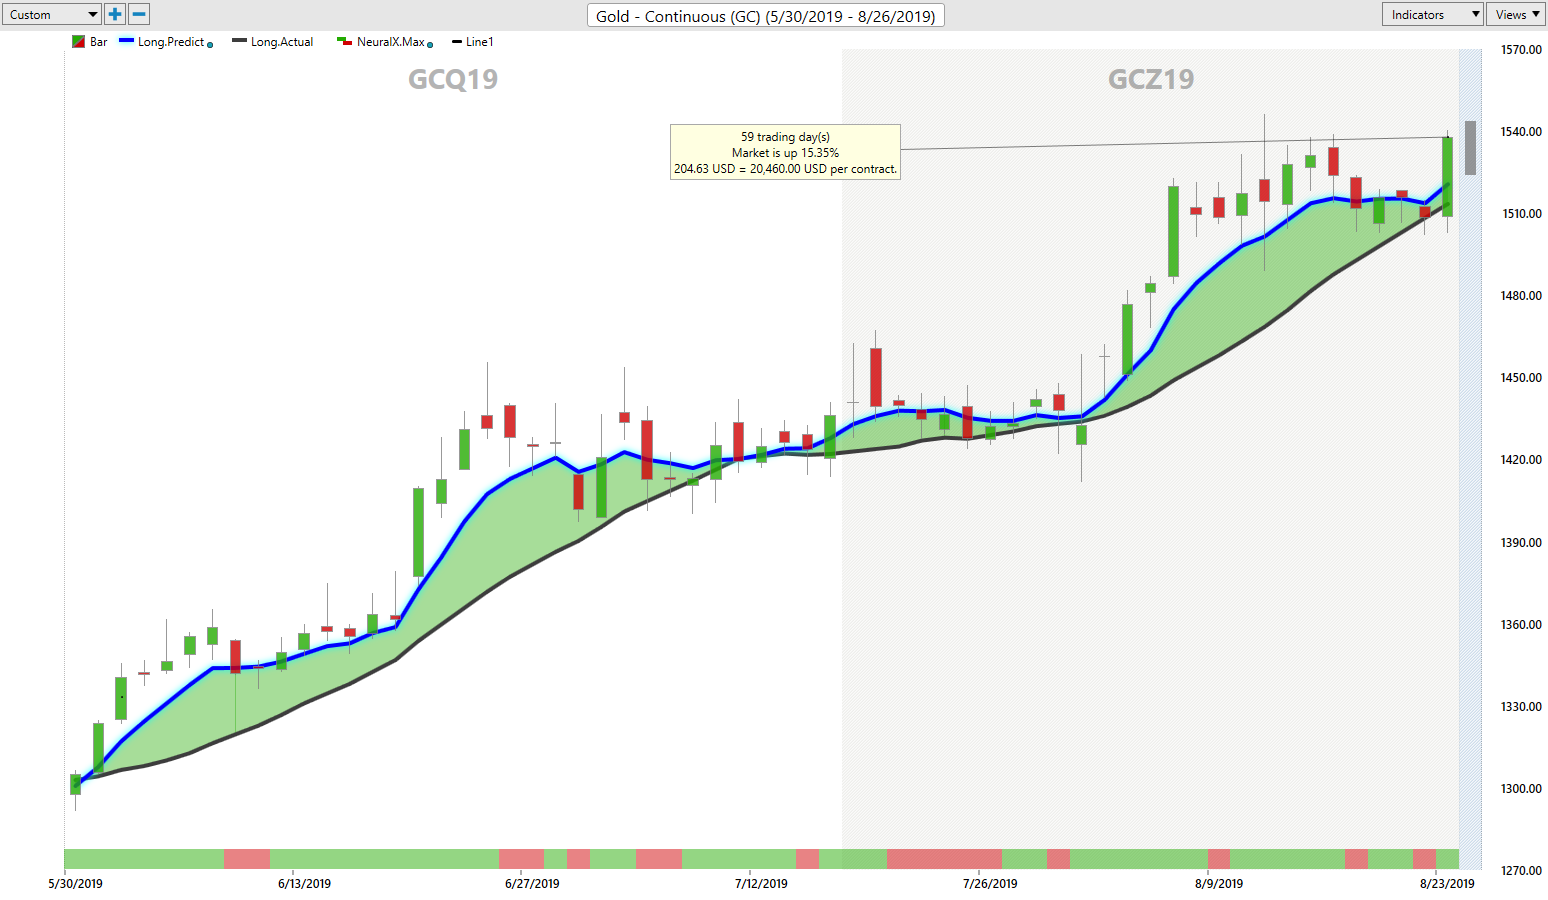
Now, that is clearly helping out gold here, but gold again coming down, testing that critical VantagePoint level at the 1,500 mark. Now, this level at 1,500 or just below, we can see support this week has built up. I’ll just draw this line in here so everybody can see it. That support at, basically, 1,492 intersecting with the VantagePoint, critical T cross long. We’re getting another buy signal yet again forming on gold as the RSI is rising, but the main thing we want to look at is a completion of the medium-term crossing the long-term predicted difference. The neural index already clearly onboard here, and we’re starting to move higher.
S&P 500
Now, when we look at that, again as we compare this to the S&P 500, I have been a very strong advocate of selling thing into any kind of rally. Very little supports buying stocks at the current time. When we look at this, I’ve drawn a line across here that’s still in there from our live training room this week where we were selling in anywhere near this 29 40 area. Again, our triple EMA cross would not complete our medium-term crossing our long predicted differences confirming this, but we still need to be cautious guys. We still have buyers down. That’s why we have these verified zones on here. It’s not about being right or wrong in trading, it’s about… Basically, it’s about knowing your levels. So, right now, we do have support at 28 16 I would say it’s inevitable that that’s going to be challenged, but much bigger levels that we should be concerned about are 27 76 and this one over here at 27 33. Now, you’ll notice when I back to VantagePoint charts out to a six month period, we can see a very heavy double bottom down here at 27 30, so in my respectful opinion, we are likely going to challenge this area sooner rather than later.
The path of least resistance is to this level. If this level breaks, the longer-term range will likely break, and we would probably be looking more towards the 2,400 mark. But again, we still need to watch this upside. In most cases, when we have a big selloff like this on Friday, we should look for retracement points. In my respectful opinion, 29 10 is a reasonable area. If we click on our F8 in our VantagePoint software, another critical level, which is 28 93, I would anticipate we will come back up and test this level. Now, if we fail at that level again, then basically, we can fire at will on shorts. But what this price action chart here, where you can see I’ve put this black line across just below, our verified resistance level clearly tells us, based on price action, there are no buyers up here.
That’s what it’s telling me. So, each one of these days off of this verified resistance represents a very, very powerful short like shooting fish in a barrel. If you know your levels, guys, that’s the main thing.
Crude Oil
Now, as we look at next week going into oil, not much love for oil here either as equities plummet and global growth slows, oil obviously moves lower, but right now, we’re still within that range going down to this $50 a barrel mark. Only a break of $50 would really see oil accelerate to the downside. Right now, as we look at these charts and these verified zones, very, very few buyers of oil anywhere above 58, $60 a barrel. So again, we’ve discussed this one in the live room too, that I’m not really… As long as stocks are under pressure, I’m not a big advocate for buying oil.
Bitcoin
Now, when we look at some of the other markets here going into next week, and again some weeks I forget to mention it, but if we look at some of the additional markets that are benefiting from this particular trade war, the first one that comes to mind here, guys, is Bitcoin. Now, heated debates, whether Bitcoin’s a scam, whether it’s this, whether it’s that, I don’t think it’s a scam here, guys. We’ve rallied on this thing off of the… down in the lower 3000 3700 market back in March of this year, rallying all the way up to 14, 15, 17,000 on this thing. We clearly do have buyers, and now just very briefly, I noticed that after the Jackson hole, that that Governor Carney of the Bank of England was interviewed. And he’s talking about forming a global digital currency. So, again, that brings Bitcoin potentially into the forefront here.
But there is definitely, in my respectful and investment… Here. So, when I look at the medium-term crossing, the long-term predicted difference, we’ve got very, very strong verified support down at 91 73. We could see a spike in Bitcoin next week or in the coming months. So, definitely something we want to look at. We do have a very soft buy signal on here right now, but we just need to clear this critical VantagePoint level, which is coming in at 10,560. If that gets on the move, then we should see Bitcoin start to move higher next week. Now again, volatility is going to increase where we are absolutely in a summer trade, the end of summer trade.
Forex Weekly Outlook for Major Pairs
Euro/U.S. Dollar (EUR/USD)
Now, when we look at our main Forex pairs, guys, I want to try and cover all the major markets, and in my respectful opinion, Bitcoin should be included. Whether you love it or hate it, we don’t want to be like Warren Buffet and just ignore it. He said the same thing about the Forex market back in the 1990s, and he ended up going into the Forex market, which helped save Berkshire Hathaway when his stocks were under heavy pressure. So, Bitcoin, again, it’s something to keep our eye on. That’s all I’ll say. And I get inundated every week with, “Should I buy or sell currency?” or “Bitcoin is a scam.” I don’t think it’s a scam guys, but we’ll see. So, when we go into our major Forex pairs, the Euro US, again, in this week in the live VantagePoint training room where you can really see the power of VantagePoint in live conditions. We talked about buying the Euro US on Monday and Wednesday of this previous week, and I had warned the room that a buy signal was forming. And to be perfectly blunt, there is almost no fundamental reason to be buying the Euro, other than US dollar weakness, right?
So, when we’re taking the correlation of 31 other markets, and we look closely at this, it very clearly was warning us that the Euro was getting ready to move higher. As stocks plummeted and the US dollar plummeted, money branches out. Big money like locust, they move from one field the next. So, we’ve cleared this major hurdle, which is 1 1134. We’ve closed 1 1137. We haven’t cleared it by much, and I would expect a retracement. But you can see that when you’re using price action trading and combining with VantagePoint, we simplify our trading. We don’t need to add 50 indicators to this that are all lagging, right? We just need to look at the price and look at the core indicators in our VantagePoint software that clearly warned us that if nothing else, the Euro was getting ready to pop higher. That is exactly what happened.
So, we’re going to see if we can hold above this critical level this week. This is the level I want you guys watching. Basically, two levels. 1 1134 and this lower end down around 1 1050, which we talked about in last week’s Forex weekly outlook. 1 1066, we’re going to keep an eye on this, but the predicted differences are rising. They’re saying that the trend is starting to slightly shift on the Euro, so we want to keep a very close eye on that. But with that rising RSI, which very easily tells us momentum in the market, it’s a leading indicator. We’ve got momentum building to the upside, so we’ll see if that can continue on Monday but expect a retracement on Monday. But again, we’re looking for that potential to buy this.
U.S. Dollar/Swiss Franc (USD/CHF)
Now, with US-Swiss Franc going into next week, two trades that you guys want to understand, US-Swiss Franc and Dollar Yen, it’s the exact same trade. They are risk-off currencies, the Swiss Franc and the Yen, money pouring into these currencies. But if we look at the US-Swiss Franc, in my career, I’ve traded this thing up in the 1 20, 1 15, 1 17, this thing can’t even hold above parody over a series of rate hikes from the FOMC, all of these different things. There is no money going into the US dollar against the Swiss Franc, despite the fundamentals that if you park your money in Swiss Francs, you’re paying to do that negative 0.75, so when we look at this, we would assess that we are likely going to come into the lower end of this range. But remember guys, we are still in a range, so the low end of that range is 96 50 we’re going to see if we can push through that. Once again, our medium-term crossing, our long-term predicted difference of falling RSI and inverse trade to Euro US, Euro US goes up, US-Swiss Franc goes down.
That’s how this game works with these two pairs. So, right now, it’s warning us that we are likely going to test this level, but in this area, we’ve got our T cross long 98 07. This is, basically, the cell zone that we’ve looked at in the live room and with my own direct clients, we’ve all looked at this area and said, “As long as that S&P 500 is pinned below 29 40, then US-Swiss Franc is going to be pinned also. It’s not going to be able to move up to any extent.”
U.S. Dollar/Japanese Yen (USD/JPY)
We’re falling lower, and again, if we look at the Dollar Yen, we see the exact same bar off of the exact same level. But the Dollar-Yen is far more pronounced off of these zones. That long T cross long 106 49, combining that with our verified resistance zone at 106 97 paints a very clear picture that there are no buyers up here.
There are only sellers despite how low this is. So, right now, when we look at our VantagePoint software, we should probably be looking for a move back down towards this low area of 104 80. The indicators in the software are mildly oversold, but when the Dollar Yen gets moving, guys, it’s like a freight train. Don’t try and get in the way of it. It’s going to keep moving. Right now, on a technical inner market correlation or the fundamentals, none of its support longs on this particular pair, unless this trade war is completely gone, the fed changes his tune, and I don’t see any of that happening in the near future. So, the likelihood is, if we can break down below this particular level, down around 105 29 and then breach that 104 70 area, that could open the door back towards the 100 level.
British Pound/U.S. Dollar (GBP/USD)
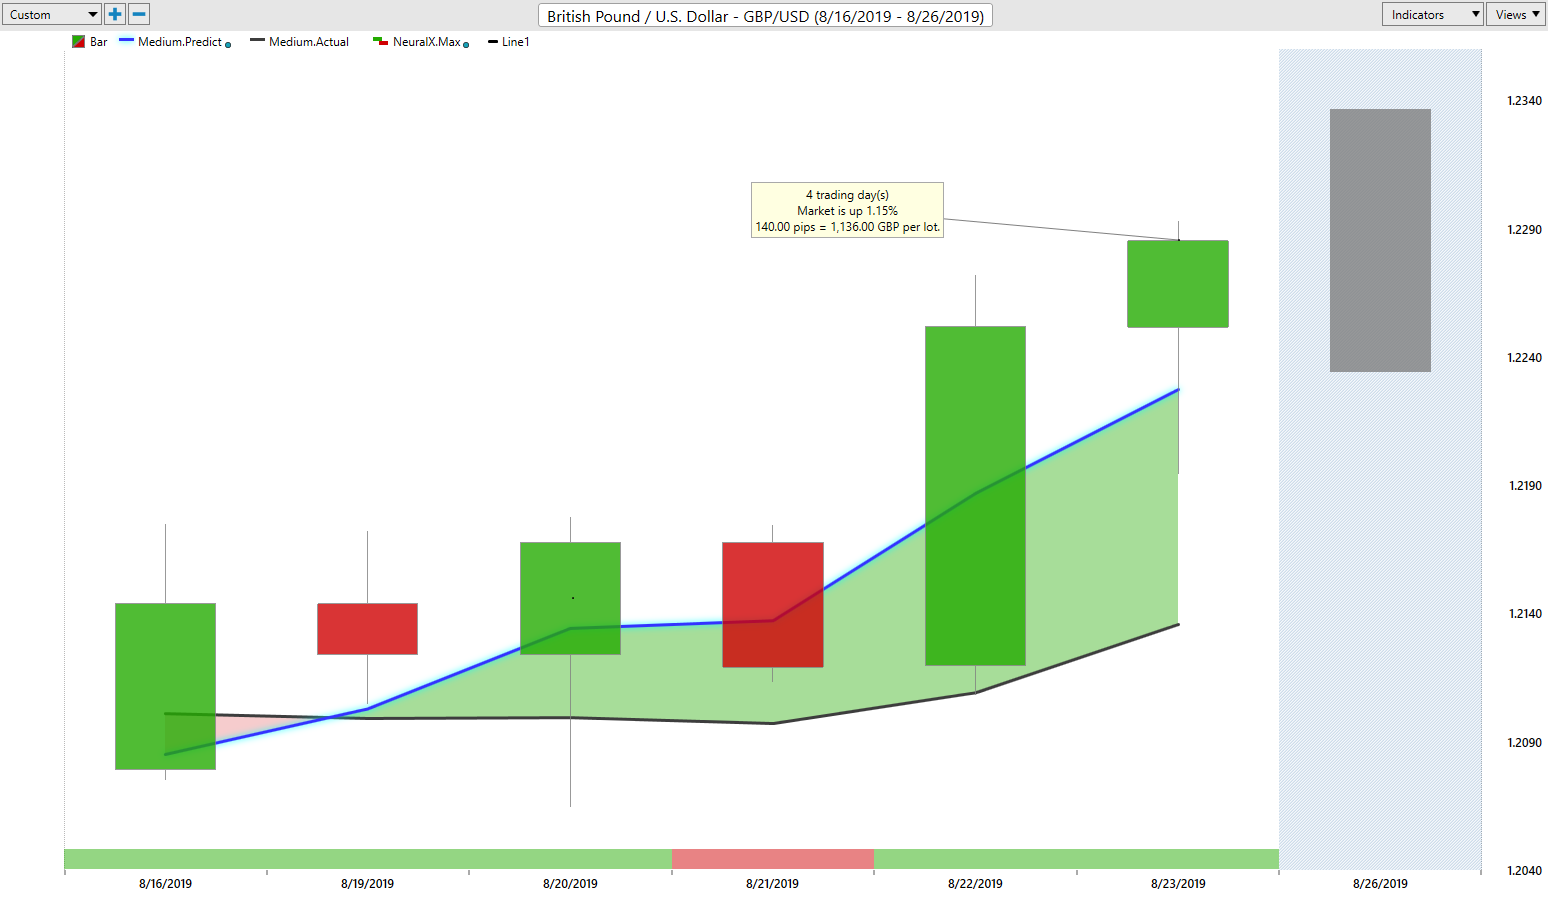
Now, with the Pound Dollar last week, we talked extensively about this over the last few weeks, that we need to break two levels this previous week, which we’ve managed to do on Thursday. Some of the Brexit highlight… Some of the news about Brexit and a possible solution. I’m not convinced that that’s going to happen yet, but we’ve taken out the key VantagePoint level of 1 2178 we’ve also cleared this critical resistance on this verified zone, which is coming in at 1 2209, so 1 2209, 1 2170 area for next week, we’re going to see if this area can hold. If it can hold, that will allow us to target back up towards the high point that’s going to come in at or about the 1 2521 area. Looks good right now guys, but one word about Brexit or further risk-off environment could really hurt the British Pound.
This is more about US dollar weakness than it is about the British Pound strength, just to clarify. So we’re going to watch this zone down here for potential longs, but we also want to watch in our software that pink line crossing over that blue line. As I’ve shown you with Euro US, just about every pundit on this planet was saying that the Euro US this previous week was going to break through 110, except probably for me, and I had stated: “No, I have not seen that.” In the medium-term crossing, the long-term predicted difference gave us that signal, or if nothing else, it warned us not to go short below 111, right? So, the same thing with the British Pound, watch for a turn on here. If it starts to turn down, and we’re slipping back below 1 2209, then you want to fire at will on those shorts.
The Commodities Currencies
U.S. Dollar/Canadian Dollar (USD/CAD)
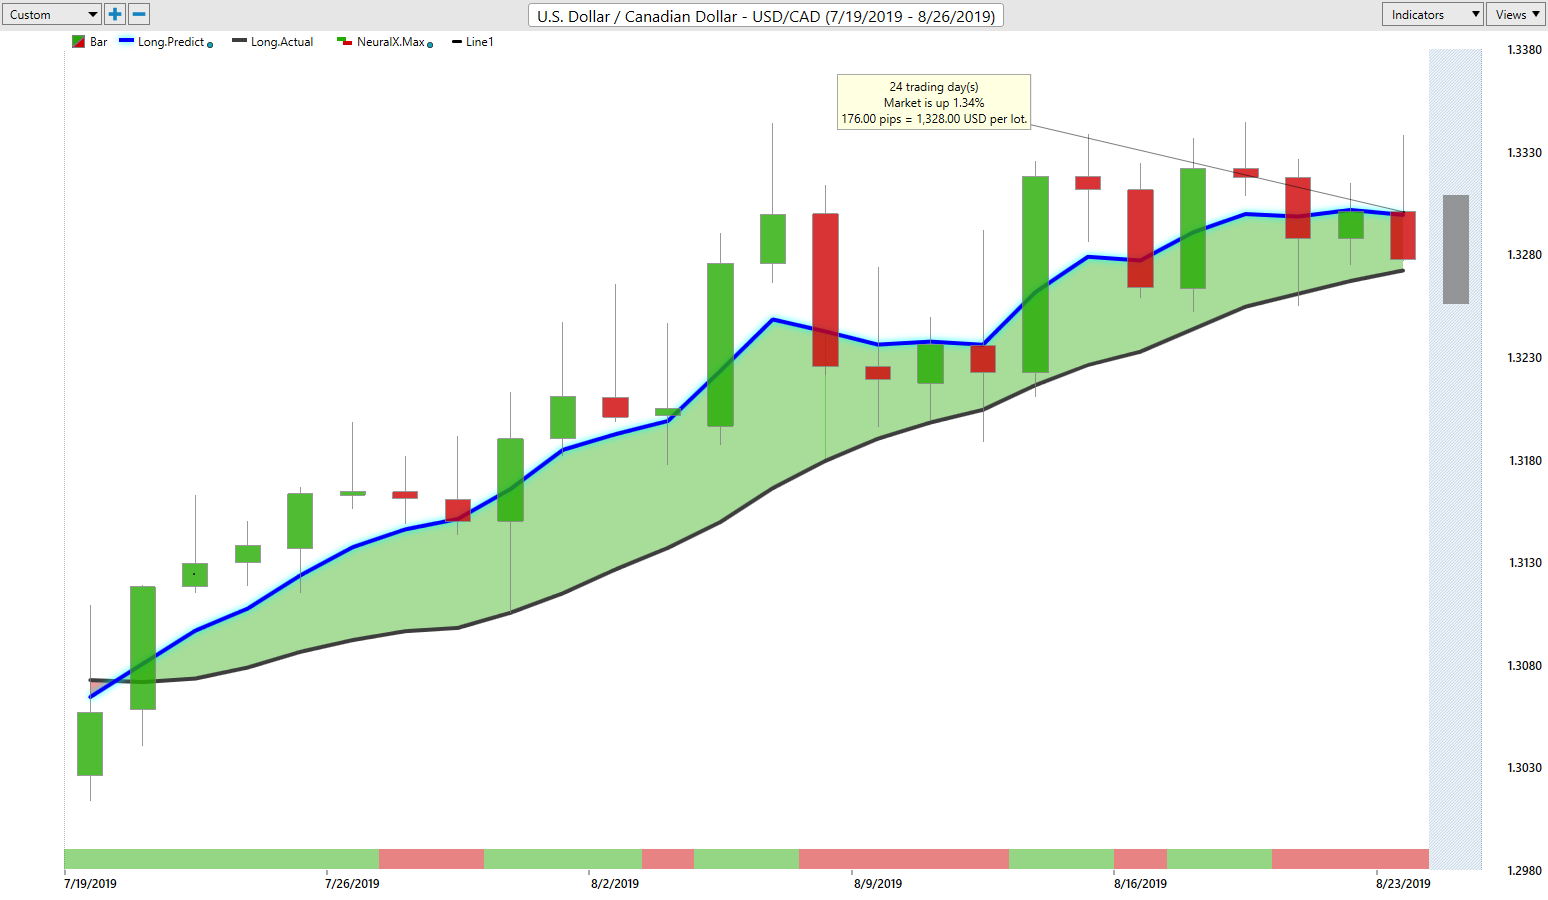
Now, with the US, there are three main commodity currencies. I’m going to start calling them equity currencies guys, because the Aussie-New Zealand and CAD are more responding to the equities than they are to commodities. That’s the very odd thing here. Now, part of that is some trade, but when we look at this right now, once again here guys, that key VantagePoint level, 1 3264, we’ve got a verified zone in there. And we’ve got additional verified support down to this low area of 1 3189. At this particular time, I am not anticipating a breach of this level. I would be more concerned with a break above 1 30… If we break above 1 3338, then the pressure will be off the downside, and this pair is going to reverse. I would assess that, based around what’s going on globally, that the Bank of Canada is going to come under pressure to cut rates with the FOMC. That will not help the Canadian Dollar. That will hurt it.
So, for next week, we want to watch these zones down here guys, and there’s another big one sitting right here at 1 3250. If we can’t break below the T cross long, then we want to start looking at getting long off this particular area.
Australian Dollar/U.S. Dollar (AUD/USD)
Now, with Aussie-US and New Zealand-US, there are just no buyers here, guys. Rate cuts, risk-off scenario really hurting it. So, we’ve got some support here, but what it’s going to take for Aussie and New Zealand to turn around, is for the trade war to be resolved for the Bank of Australia and New Zealand to back off these rate cuts. I don’t really see that happening either. Maybe New Zealand will take a step back here, but once again, we’ve got to watch these major support levels. If we lose this level here at 67 36, then that opens the door, probably very quickly, for 66 77.
New Zealand Dollar/U.S. Dollar (NZD/USD)
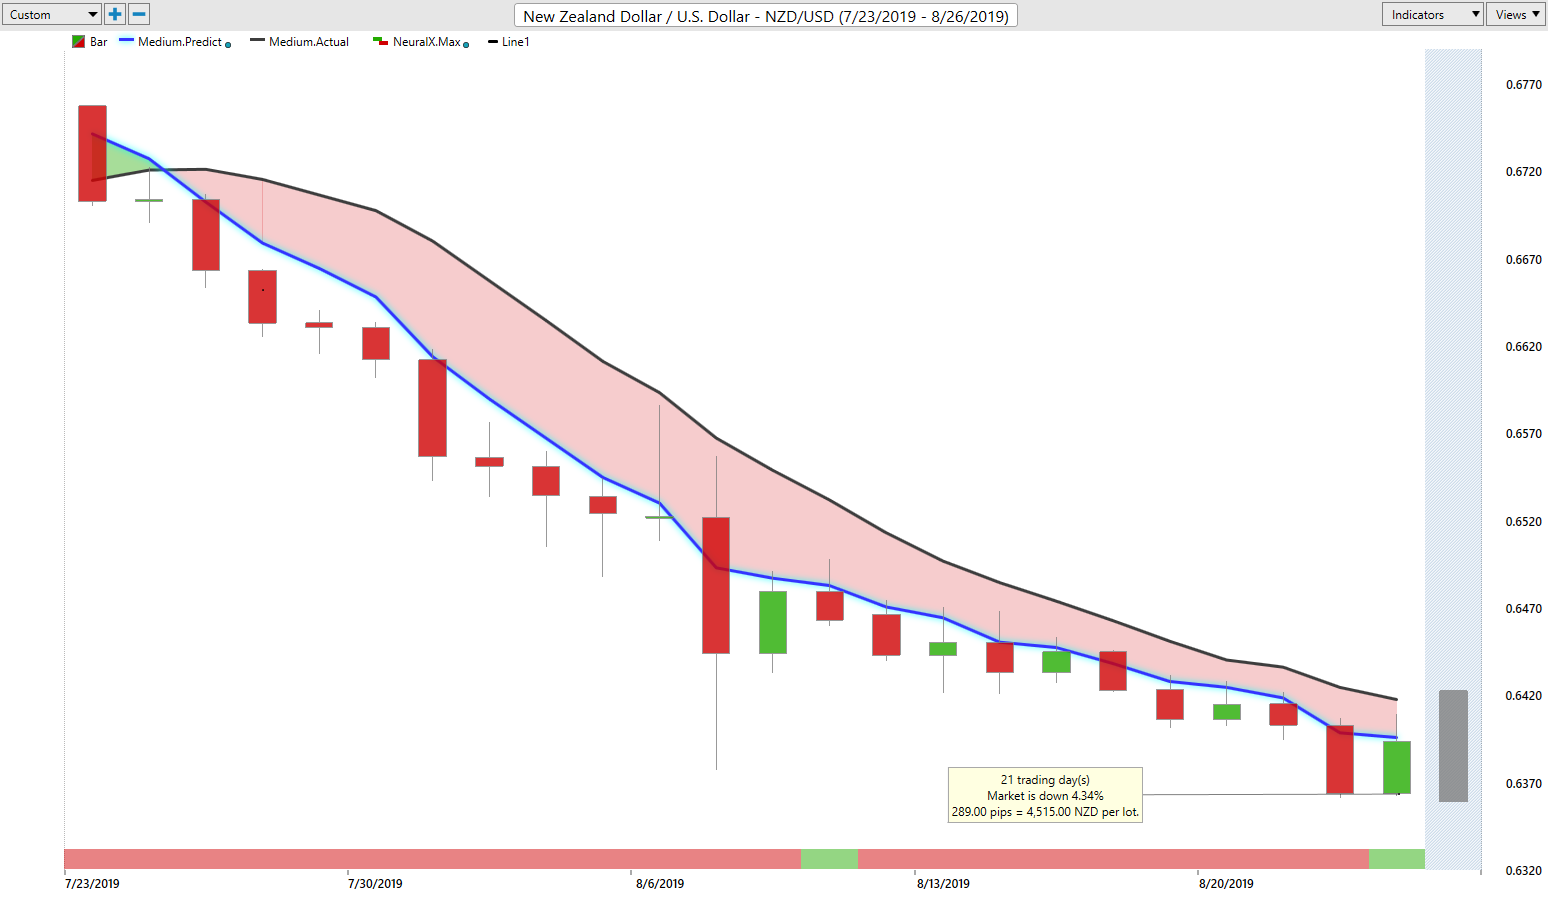
Now, once again, just no buyers up here. Any kind of recovery is met with selling off of this verified zone coming in at 68 21. Now again, using these verified zones really simplifies our trading because it’s, first of all, it’s not lagging because it’s not a moving target, right? It’s a sitting target. The market comes up to that area, usually creates another zone, or it breaks through. So, we want to continue to monitor these zones and know these levels, not to get aggressively short or long at any of those levels. The same thing with New Zealand, guys, for next week. It’s not, again, it’s pausing two days in a row here. We’ve got this big move down. A lot of this has come from that 50 basis cut from the Bank of New Zealand, but this low area at 63 77, we’re going to see if this area… if we can recover above this. But again, there’s not a lot of reasons right now to be buying the Aussie, New Zealand or the CAD, that’s all I’ll say unless the global outlook starts to change somewhat.
So, with that said, guys, this is the VantagePoint AI market outlook for the week of August the 26, 2019.


