


VantagePoint AI Market Outlook for the Week of August 3, 2020
VIDEO TRANSCRIPT
U.S. Dollar Index
Hello everyone, and welcome back. My name is Greg Firman, and this is the VantagePoint AI Market Outlook for the week of August the 3rd, 2020. Now, to get started this week, we’re going to begin where we always do, with that very important U.S. Dollar index, a driving factor in a number of different markets.
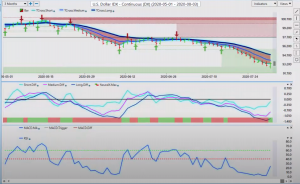
U.S. Dollar Index
Now, the dollar has come under excessive selling pressure, in my respectful opinion. You’ve got the COVID things going on in the different states, you’ve got the political uncertainty, a lot of problems between China and the U.S. There’s a lot of things going on here, guys, but just remember that nothing goes straight up and nothing goes straight down. We have small trends, larger trends, but ultimately it goes back and forth. One could argue, this is how Fibonacci came about.
So when we look at this current situation with the dollar, we can see that we’ve had a very, very good sell off here. Going back to basically July the 6th, pretty much the entire month of July, VantagePoint has forecasted the dollar going lower. Now, the neural index has been a little conflicted at times around the verified support levels, but now we’ve gone from a solid red to a green. We’ve got an RSI that is starting to rise. This tells us that if nothing else, the dollar is going to likely move towards a corrective move if nothing else. That level would be 94.79. Now, once again, when we click on our F8 and we use our blue line by itself, that predicted moving average, that level is 93.60. There is this considerable gap between those two levels. And we have a clear signal from VantagePoint that we could be getting ready to go higher.
GOLD
Now, when we cross reference this to gold, we can see that we have a very similar signal here. We have a verified resistance zone that is now formed at 19.63. When we look at this particular level, we can see that we now have our medium term trend weakening against our longer term trend. This particular signal from VantagePoint is very seldomly wrong. It’s the only downside to it. It’s usually three or four days early before the market, that particular sector makes its move. Now, the RSI again, heavily overbought, but we don’t really like to trade solely off overbought, oversold signals like that because, again, it’s very similar to somebody screaming at the TV to go lower, go higher. We can’t tell the market what to do here, guys. We’ve got to let it figure things out on its own.
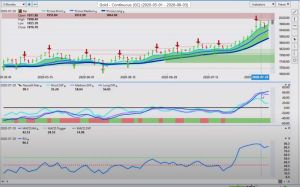
GOLD
So we measure that the pink line measures the medium term crossover, the dark colored blue line measures the longterm crossover. So we can see that the medium term is breaking away, suggesting that this strong upward move in gold is starting to break down a little bit here. So a little bit of caution unless we can clear this particular level. I would like to see us, again, clear the 2000 mark, break free and clear of it. My optimism, at least for this coming week remains heavily guarded with again, the nonfarm payroll coming out on Friday.
S&P 500 Index
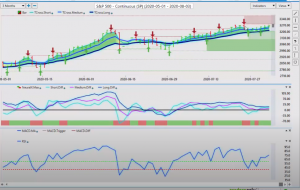
S&P 500 Index
Now, we can see that we’ve got a very similar situation with the S&P 500, and now that level is coming in at 32.84. The market is made high, we’ve got a verified resistance, it’s gone across the screen here, but we’ve had a couple of very strong retracements down to that key T cross long as early as this past Wednesday. And we’ve rebounded off of that. Now, once again, if we click on our F8 in our software, we can see that it’s really struggling to hold above this blue line, that key level 32.43. And as I’ve always stated, we want to watch that yearly opening price at 32.37. Again, a very big level to determine whether the S&P 500 is positive or negative on the year. Now, just at the end of the week, it’s turned positive on the year again. Now the question remains, can we stay positive?
Bitcoin
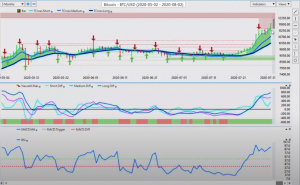
Bitcoin
When we look at additional markets that can be traded off these, I’ve been a relatively strong advocate, as some of you know, for Bitcoin. And once again, Bitcoin continues to outperform a number of different markets here, but Bitcoin has now taken out a big level here, this high at 11,382, but again, we’re going into the nonfarm payroll this week. So I’m anticipating a retracement lower on Bitcoin. I would look at that still for longs, but I would be a little bit more comfortable around the 10,100 mark, or even at the very least, I don’t think I would do much with this until we get a retracement back to the 10,943 level.
Crude Oil
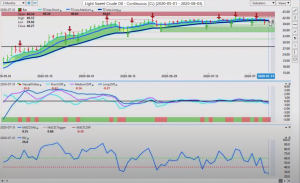
Crude Oil
Now with oil, again, going into next week, oil is following equities here, guys, and the chart, well basically where it is from where we left off in last week’s weekly outlook. Because again, guys, this is an outlook for the coming week. It’s not a recap of something that’s already happened. So when we look at this, this trade appears to be in progress. Oil is starting to break down below that T cross long at 40.61. Our predicted differences are moving lower. Our neural index is in agreement. Our RSI is sinking lower. So if oil does break down that it could be another leading indicator to suggest that the S&P 500 is not necessarily as strong as one might think.
EURO versus U.S. Dollar
Now, when we get into some of our major Forex pairs here, the main currency that everybody is watching, including me is Euro/US. The Euro also having a strong correlation to gold contracts, so watch gold very closely if you’re a Forex trader. If gold starts pulling back, then the Euro is absolutely going to follow. Now, the Euro is positive on the year. We’re above the 112 mark. We’ve had a big rally up, but again, not necessarily for demand for Euros, but just lack of demand for US dollars. Very similar in the Forex market to the fangs. The Euro is very, very heavily trade-weighted to the dollar index. So any move in the dollar index will show up in the Euro first. So I would anticipate a retracement down to the 115.73 area.
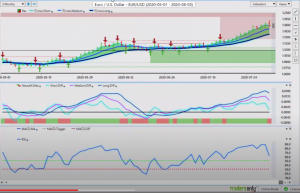
Euro versus U.S. Dollar
But once again, if we use our blue line by itself, it really helps to simplify our trading. We’ve got a key pivot area here, the long predicted 117.38. I do anticipate we are going to test that level at the very least on Monday and potentially Tuesday. If we lose this particular level, then we will be going lower. And that’s what we’re watching for. In most cases, the Euro does not fare well in the week of the nonfarm payroll, but there is so much noise and we’re officially in summer trading in August now, we’ve got thin liquid markets, so I’m not expecting any real big moves here, but definitely a corrective move is imminent in my respectful opinion.
U.S. Dollar versus Swiss Franc
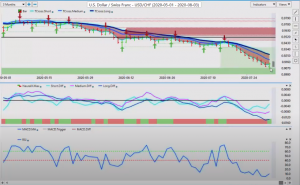
U.S. Dollar versus Swiss Franc
Same as US/Swiss Franc here. When we look at this, we’ve had a big move down on this particular pair only to pause here down near some of these verified zones. Once again, we’ve got a long red neural index, which has just recently changed to green. Now I’ve had some in the VantagePoint live training room, I’ve made some jokes about this, I’ve been calling it the instead of the neural index, the COVID index, because ever since the COVID stuff started, the neural index has absolutely been on fire, it has been deadly accurate when it’s calling a turn. Remember, it’s usually a day or two before that happens so watch out for a potential turn on this particular pair. When we look at our RSI, we’re starting to rise. Our predicted differences are medium and in short are breaking away from the longer term trend, so it does suggest if nothing else, a corrective move is coming.
British Pound versus U.S. Dollar
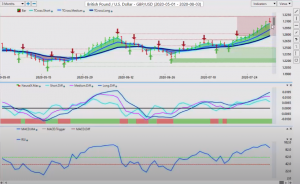
British Pound versus U.S. Dollar
Now, when we get into the pound/dollar, the pound/dollar this week, we are coming up against a very significant verified resistance area. So if we come back and look at this from about nine months ago, we’re going to come back here to the March high and that March high coming in at about the 1.32 area. Now we also have the yearly opening price up around this particular level. We’ve got the bank of England next week. Be cautious with this. In my respectful opinion, this is getting exhausted up here. I think it’s overshot the mark. I think that the bulls here for the British pound are going to likely struggle at this level. Watch out for a false break on Monday, but maybe even on Tuesday, and then a violent reversal. The further we move away from these key VantagePoint levels, the T cross long at one 27 69, and more specifically the VantagePoint long predicted moving average by itself, that pivot area’s 129.54, the probability is extremely high. We are going to come back to this level. So watch for that retracement. The indicator’s in VantagePoint, the RSI, the medium term predicted difference, but the neural index again is saying “Not yet.” So watch for that neural index turning red and that would be the green light to look at shorts.
U.S. Dollar versus Japanese Yen
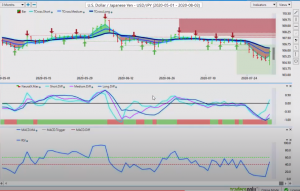
U.S. Dollar versus Japanese Yen
Now with the dollar/yen, the dollar/yen again has really taken a… The dollar has really taken a hit against the yen and the Swiss Franc this past week, but we do have a buy signal that is starting to form here. Very mysterious one here, but the medium-term crossing the longterm predicted difference with the neural index in agreement in a rising RSI, it suggests that we’re going to correct higher. It doesn’t necessarily mean that the trend is going to shift, but rather a corrective move higher. Now, when we click on our F8, again, this is a big deal for me guys, we’ve been below this blue line the entire time and on Friday, we closed above it. That long predicted pivot area now is one 105.50. If you’re looking for longs, that would be a potential area to do that, if this is a true price. This could be a warning also that the US dollar is getting ready to correct across the board, the dollar/yen usually a leading indicator. So keep a close eye on that. If the dollar/yen continues to rise going into the nonfarm payroll number, the other currencies are likely going to fall into check also, and further weaken against the U S dollar.
U.S. Dollar versus Canadian Dollar
Now with our three main… Everybody still calls these ones commodity currencies, I no longer do, guys. I call these equity currencies. That’s the CAD, the New Zealand, the Swiss Franc that we’ve discussed on here many times. These currencies, the three currencies, aforementioned currencies, they are going to follow the S&P 500 up and down. If the S&P 500 sells off, the Aussie, the New Zealand, and the CAD will go with it. So right now, we’ve got a good solid base here, sitting down at the low of the 1.3315 area, predicted differences rising. We can see the neural index is positive, but we must clear this level guys, because again, this is not a recap of something that’s already happened. This is an outlook, we’re forward-thinking here. So if we can penetrate and break above one 1.3467, the US/CAD is probably going to run back to 1.36.
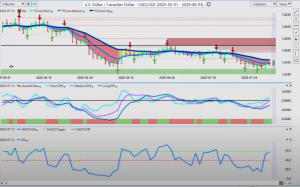
U.S. Dollar versus Canadian Dollar
Now, a quicker way to get that is using the blue line. So this key pivot area is one 1.3413. I would like to see it hold above this level. Then we can start advancing higher. These verified support zones are reconnected back here to this particular low, the June 10th low. We are failing all in this level. This is very easy pickings down here, guys, for longs, just be careful. Give yourself 60, 70 PIP stop loss, but we’re looking for that 1.33 level to hold. Would be somewhat of a sucker’s bet, putting a stop somewhere between the current price and 1.33. Make sure stops are below there if you have to lower your position size.
Australian Dollar versus U.S. Dollar
Same thing with Aussie/US here, guys, we’re losing momentum. We’ve had a top in place here since July the 22nd that we talked about in last week’s weekly outlook, and we are unable to close above this particular level. This tells me that Aussie is likely getting ready to correct lower back down to .7075. But again, if we click on our F8, we can see a more ominous signal forming here. And that key level is .7147. Shorts here, clearly favored. Our neural index is on board, our predicted differences are moving lower. Predicted Mac D and RSI are starting to warm up to the idea, but that RSI, I would like to see it below 40 so we start getting some momentum building to the downside and the exact same thing would, would apply to New Zealand.
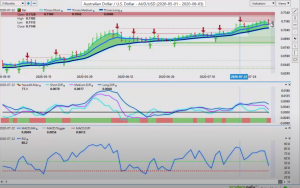
Australian Dollar versus U.S Dollar
New Zealand Dollar versus U.S. Dollar
Now, New Zealand coming under a little bit more pressure here. That key level, .6612. When we look at the indicators, our predicted differences are falling, neural index is down, and we are below the 50 level on the predicted RSI. So again, when we come back and click on our F8 itself, we have closed below this level, .6659. As long as we’re holding below that level, guys, we should see further downside pressure. But again, we have the nonfarm payroll number on Friday. It’s going to be a very, very choppy week.
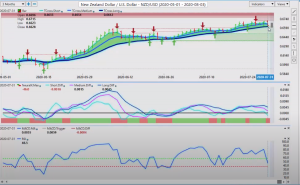
New Zealand versus U.S. Dollar
So with that said, this is the VantagePoint AI market outlook for the week of August the third, 2020.
Are you using A.I. yet?


