


VantagePoint AI Market Outlook for the Week of February 10th, 2020
The VantagePoint AI Market Outlook is designed to help traders. It’s important to remain aware of correlations in the global markets. Traders can become more profitable if they know how to get ahead of the trends. Utilizing the predictive indicators in VantagePoint Software can help traders find the right trades and the right times. Above all, traders know when to enter and exit those trades for maximum profit. Let’s look at the charts for Equities, Commodities, and Forex Pairs.
VIDEO TRANSCRIPT
Hello everyone and welcome back. My name is Greg Firman and this is the VantagePoint AI Market Outlook for the week of February the 10th, 2020.
U.S Dollar Index
Now to get started this week, we’re going to begin with that very important US dollar index, the main driver of the Forex market. Again, in the Forex market, we’re either buying or selling US dollars. That’s the primary basis of this particular market and we use inner market correlations to assist us in that. Now coming off the nonfarm payroll number, in my respectful opinion, it was a very good number again. However, the U6 number did spike a little bit higher, not a big deal. I think it went from 6.7 to 6.9, but still kind of going in the wrong direction. But in my respectful opinion, again only, what I have seen in the dollar is that it usually sells off after the nonfarm payroll number. Regardless of whether it’s a fantastic number, a horrible number, it doesn’t matter. Dollar demand has usually dried up at the end of the first week of the new month. That’s just what I’ve seen.
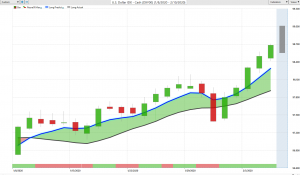
So if I’m looking at that, taking that into consideration, we are getting moving towards an overbought condition on the dollar. We’ve had a corrective move, then a strong rally up. But again, a big rally on Friday and thinly liquid markets. This usually spills over into Monday trade. Then it’s usually on Tuesday that the dollar starts to get a little softer, so we would look to play that. Now what I’m also looking at here is for gold to sell-off. If it’s a true rally in the dollar, then gold would be going lower, not higher. As you can see, gold has been rising for the last three days. The likely outcome here would be gold now would extend higher as the dollar starts to weaken by the middle of next week, maybe as early as a late-day Monday or midday Tuesday is what I suspect.
Gold
But again, as we can see here, gold is recovering. It’s holding above that critical vantage point level, the T cross long, at 1566.
S&P 500
Now when I look at the equity markets, we can see that the equity markets have largely, the S&P 500 and the dollar have been enjoying these gains together for the most part. The dollar had a very good 2019, as did the S&P 500 and they’re both out of the gate very strong in 2020. But as we can also assess, we do have some pretty significant resistance up with that previous high. We’ve gone a little bit higher. And in most cases guys, this is a bull trap. Now it doesn’t mean that the rally in the S$P 500 is over, and that’s what a lot of analysts suggested here last week, that under no circumstances should we be buying the S&P 500 on this particular dip where I was probably one of the few analysts that didn’t agree with that statement.
In actual fact, the medium term crossing the longterm predicted difference. We broke back up above the vantage point T cross long and I actually in the Vantage Point live training room suggested that under no circumstances do we short this, we only buy. Now again, people are maybe overreacting a little bit. Or in the alternative, maybe that actually was a correct statement to sell the S&P 500 but the timing was wrong.
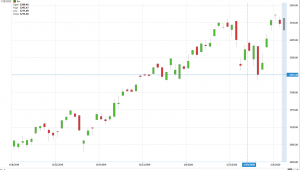
Now if I look at it from here, if the dollar does come under a little bit of pressure, we would look for the S&P to follow that. So again, I’m looking for the S&P 500 to correct lower but not necessarily sell off. We’ve got the Coronavirus, we’ve got all these different things happening in the market that could send this thing lower. But again, when we break this down and look at our long predicted, another critical vantage point pivot area, that’s coming in at 3310. So the two levels of support we want to watch on equities next week are going to be 3310, the long predicted. And then back down around that 3286 area, the T cross long.
Light Sweet Crude Oil
Now we would also want to take a quick peak at oil and say, okay, is there any signs of oil turning around? That could be another dollar killer, right? So when we look at this, we’ve got a rising RSI. Our predicted differences, which basically is how Vantage Point gauges the trend here in the short, medium, and long term. We can see that our short term predicted differences breaking back up above the zero line suggesting that oil could be getting ready to move higher here. We’ve got a base support level. Now, demand is still low and supply is still very high. So if we do go higher again, and we will go higher as we get closer to May, but at this time of year it’s not overly strong. Oil is not overly strong. So once again, if I click on my F8, I can see that we’re challenging this level.
Now the actual selloff in oil was way back here, okay? At the beginning of the year. Now we’ve come back, we’ve retraced, banged up against this vantage point, predicted moving average multiple times only to fail every single time. But as you can see, the dips are getting shallow now. So this tells me we’re probably going to break above 5131, I would suspect maybe even as early as Tuesday, right? Look for another down day on Monday on oil, potentially, and then a recovery. But watch your support levels here too. 4948, as long as we’re holding above there, we’ve got a real shot that oil is going to turn around here.
EUR)/US Dollar (EUR/USD)
Now as we start to move into our main Forex payers, all eyes it appears are on the Euro US pair. Now remember that if the dollar index does turn lower and the equities turn lower, the inner market correlation here would be positive for the Euro, not negative. So we’ve got a lot of very strong support but this is the area down here I would keep my eye on. 10879, the bottom end of this particular range. Just remember here guys, we’ve got a high up here and we’ve got a low down here in the last nine months. This is a nine month low.
Now I’m already seeing the headlines that have already started on some of the main websites. Euro hits its lowest point since October, November, 2019. So you see how the media, the fake media gets things spinning out of control here. Maybe. Probably I would say we do go a little bit lower in the Euro but watch for a long here guys because again the media is never our friend. They’re telling us things half the time that are leaked from somewhere else because somebody wants it leaked. So I would keep an eye on the potential for reversal on the Euro.
As heavy retail traders get short, we don’t want to follow retail traders. We want to follow the banks, right? That’s the key thing. Now the Euro again is getting hit with a lot of strange data to say the least, but when we go back and look at the Euro here again, it’s a mixed signal but it’s getting dragged around by the equity markets.
U.S. Dollar/Swiss Franc (USD/CHF)
So my view is the equity markets come under pressure next week. That is going to benefit the Euro. Now, that is not going to benefit the Euro or the US dollar against the Swiss Franc. As we’re coming back up where we’ve been so many times before, the US Swiss Franc has a mind of its own these days. Normally it follows stocks, which you can see it’s doing here, but it really does follow gold in an inverse correlation to gold. So if gold starts breaking higher, than we’re going to see US Swiss u-turn here any second.
And this particular move here does look like a bull trap to me. I’ve tried to buy this thing up here before. And as you can see by these verified resistance zones, it just simply hasn’t worked. But shorts, no matter how you look at it, guys, when we talk about a trend and you look at this thing over the last year. Or better yet, even over the last two or three years, that’s a pretty substantial trend, a very substantial trend, but the market also respects these verified zones. Going back to September, 2018, we’re trying to break into the bottom end of that range right now. So again, we’ll continue to monitor this, but be careful with this particular pair. It truly defies logic here because the Swiss Frank is negative interest rates. The US dollar is the highest interest rate of all the currency.
There’s almost no reason that I can come up with to actually sell this thing, but shorts clearly have been the better trade even though we have to pay interest on this. So keep an eye on this one, but be very, very cautious around this particular area here, 9766, and be even more cautious around 9831. I would actually go as far as to argue we’re entering a potential very strong sells zone.
There’s almost no reason that I can come up with to actually sell this thing, but shorts clearly have been the better trade even though we have to pay interest on this.
British Pound/U.S. Dollar (GBP/USD)
Now the same thing would apply with Great Britain US. We have very significant verified support down to 12827. I would look for a potential turnaround here too as we start moving into a grossly oversold condition.
Now just to clarify, I under no circumstances trade often overbought or oversold condition because that’s what retail traders do. Overbought oversold conditions, accumulation distribution. These are signals that have a very low accuracy rating, as little as 50% accurate trading off overbought and oversold or accumulation distribution. The same concept. It’s a very dangerous way to trade. Now I’ll look at it, but I’m not going to necessarily trade off of it. If I look at the dollar cycles, however, that I discussed, where dollar demand usually dries up mid month, then that would suggest that if we’re looking for places to sell US dollars, buying Great Britain US would be a very reasonable play, wouldn’t it?
So it’s taken a push down after that very strong nonfarm payroll number. Now we wait and see, watch our main verified support levels down here and watch our signal off of our RSI. If the RSI starts turning back up, that would tell me that at the very least we’re going to retrace back to the 12976 area at some point early in the week. So if that’s the case, then even if we can get 70, 80, 90, 100 pips and play it back to the blue line, that’s a very reasonable play, right?
U.S. Dollar/Japanese Yen (USD/JPY)
So we’ll continue to monitor this one and see where it goes. Now with the dollar-yen, the dollar-yen again, after this bought of dollar strength. It’s interesting that the vantage point indicators are not supportive of dollar-yen longs for the most part. Our medium-term trend is starting to turn down, as is the short term trend. Looking at the blue line and the pink line, we’ve got a verified resistance zone that quite frankly surprises me. We didn’t even get up to test that level. So if we see a big rally up here on Monday towards 1/10/20 as the stock markets move up, chances are on Tuesday this thing’s going the exact opposite way. And the indicators in vantage point are already pointing towards a situation like that happening. So once again, if we click on our F8, you can see that we came down and kissed this long-predicted at 10949, and had a very shallow bounce off that.
U.S. Dollar/Canadian Dollar (USD/CAD)
So if we start breaking down below 10950, then that would tell me shorts are in play here. So keep an eye out for that trade. But if you’re trading dollar-yen, you’re trading the S&P 500. The S&P 500 goes higher, dollar yen’s going higher and vice versa. So keep a close eye on that. Now the same thing, if we’re looking at opportunities or places to sell US dollars, US CAD certainly comes to mind. If oil rebounds next week, that could help the Canadian dollar. The Canadian unemployment report came out on Friday and it was considerably… It was the polar opposite of the US report. The US, the unemployment ticked up in Canada, the unemployment tick down. More jobs were created in Canada, so it was a decent report. I would watch this pair very, very closely on Monday. If we get a big rally up on Monday, chances are on Tuesday we’re coming much lower.
So if we look at our main levels here, again, 13205, I anticipate that level will be tested next week. If we look at our F8 here, once again, this is the vantage point long predicted without the black line, just the blue line, and I usually trade off this blue line almost every single day. And as you can see, that is a very profitable way to trade by using that predicted moving average as a daily pivot area. Right now, that daily pivot is 13275. So if we start breaking down below 13275 by say, Tuesday, Tuesday morning, then shorts are absolutely in play here. As you can see, nothing goes straight up and nothing goes straight down and we always watch the time of the month when we see that this market turns starts to change. And as you can see in December, that was at the beginning of the month and these are the things that we want to watch, right?
Very, very important. Even, here again, you can see on January the ninth, US Canada had a big push up into the night and then it went down for two, four, six, eight days, eight full trading days until it turned around and went higher. So we’re in that meaty part of the zone here where we could have a very lucrative short on US Canada. It would clearly be a countertrend. But we look again at our indicators, this is exactly what I was saying, guys. Why we don’t trade-off of things like overbought stochastic, accumulation distribution, this kind of thing. Because as you can see, the market went into an overbought condition and basically this would tell the retail traders in this particular area during this four day period, which was the perfect entry point, just slightly above the vantage point long predicted, it was saying that we’re overbought and we should start selling.
Australian Dollar/U.S. Dollar (AUD/USD) & New Zealand Dollar/U.S. Dollar (NZD/USD)
The market only went up from that. So we’re in an overbought position for basically 10 trading days. So this is where I was saying guys, really look back, and see the accuracy of these types of ways of trading based around overbought oversold accumulation distribution. Because again, it has a 50% at best accuracy rating and it usually gets the trader out of something when they should actually just be getting in. Right? So again, not that at times it doesn’t work, but what I usually find with that type of trading is it looks great after the fact. So we’re looking at this now saying, okay, we’ve got a verified resistance up here. We’ve got our main pivot area at 13275, and we’ve got our reversal point at 13205. And then we look at those inner market correlations.
This is science, guys. Hoping something is going to go higher or lower because it’s overbought or oversold? Well, I hate to be the bearer of bad news, but hope is not a strategy. Okay? Science is a strategy, right? So we look at these things and we identify where we suspect the bank traders are going to be looking for places to sell US dollars. This one absolutely comes to mind, as do the other two commodity currencies, Aussie US and New Zealand US. We’ve got a heavy support coming in down here. We’re looking to see if we can turn around here. Now again, this area, this black line that I threw in there connects to multiple areas. In this level, going back into October of 2018. So again, I’m not looking at something like this, like an overbought or oversold condition.
I’m looking to say, okay, I’m at the bottom end of this particular range. Is it possible that this is a bear trap down here? One of the things I look for in a bear trap is a final push in the market before it then turns around and I usually see that by a long bullish bar or a long bearish bar. This long bearish bar tells me that we could be getting close to the final push and we’re going to get ready to retrace back to 6773. I would argue the exact same for New Zealand US. We get this long red bar down, but that’s right up against a verified support level. That goes back again to that same period back in October and November of 2018. So is this the completion? One could argue that this is a full Fibonacci retracement. If you want to tag Fibonacci to this, knock yourself out. All the more power to you. That’s great.
But what we don’t want to do is say, okay, I’m only just going to keep selling this and there’s no problem area down here. Well, there is a problem area down here, and if the dollar cycle comes to fruition and the dollar starts to weaken across the board, then this would again be a place of value to sell US dollars by buying Australia US, buying New Zealand US. So we’ll monitor how the week goes. But again, trading is difficult and we have to make sure we’re looking at the entire picture, not just a short term picture. Very, very important. So with that said, this is the VantagePoint AI Market outlook for the week of February the 10th, 2020.


