


VantagePoint AI Market Outlook for the Week of February 15, 2021
VIDEO TRANSCRIPT
Hello, everyone and welcome back. My name is Greg Firman, and this is the VantagePoint AI Market Outlook for the week of February the 15th, 2021.
U.S. Dollar Index
Now, to get started this week, we’re going to begin where we always do with that very, very important dollar index. Now, what we want to do here is a quick recap of last week’s forecast, showcasing the VantagePoint software’s predictive indicators.
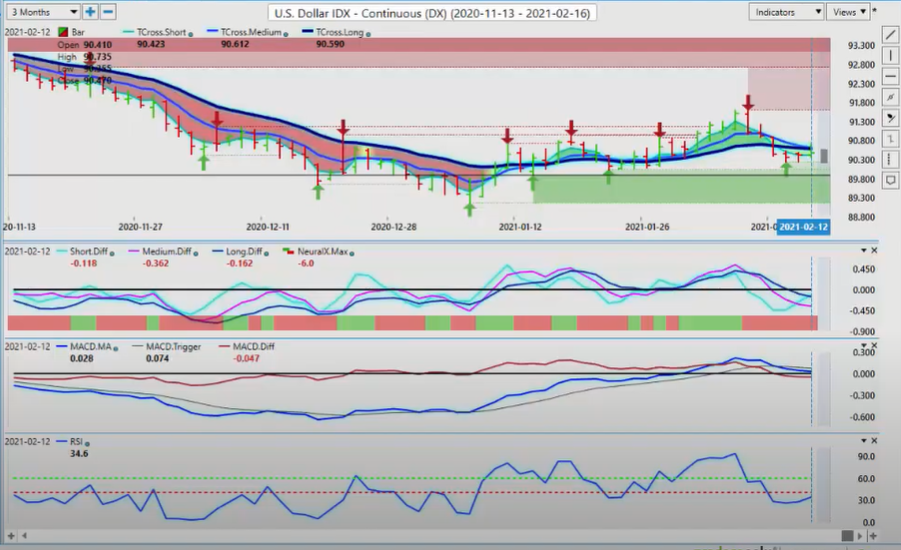
Now, in last week’s weekly outlook, what I had stated very clearly before, not after the market opened that we had a sell signal on the US dollar and that sell signal came from the medium-term crossing the long-term predicted difference. We can further assess there is absolutely zero lag in this particular indicator. What we’re doing here is measuring the medium-term crossover against the longer-term crossover. So we’re effectively looking at two different timeframe charts at the same time.
The conventional blue line crossing the black line is certainly a very effective strategy but in my respectful opinion this is a fantastic contrarian indicator, or a trending indicator depending on how you’re using it. Now, the neural index has been in complete agreement here this entire past week, as predicted in last week’s weekly outlook. However, we also have to make the determination now, is this an actual complete trend reversal on the dollar or is it corrective in nature? My argument has been that it is likely corrective in nature.
U.S. Dollar Index
We can see that our predicted RSI is flattening out and starting to actually turn back to the upside. What we would look here for a trigger is for the dollar to come down a little bit lower, but you can also visually see using the verified support zone here that we’ve got support building. These arrows that are forming on the verified zones are rising. That’s the key thing. Now, when we look at these down arrows, they’ve been basically consistently lower except this one made a big push up. And again, what we’ve formed here is now, we’ve got basically a higher high and a lower… A higher low, excuse me.
So now what we would be watching for is to see if we can slip back up inside the 9059. Now we have got a holiday short week. The major event risk is going to be the fed minutes, but I think we all know what the fed is. The song and dance from this fed is going to be the same as what we’ve heard over and over and over again. Zero interest rates, bad labor market, yada, yada, yada. It just gets monotonous listening to it.
And the fed has always been behind the curve on just about everything that they’ve done. Now, we also use the vantage point long predicted here. The blue line by itself, again, zero lag type trading. When we look at the market, we’re looking for the market to close above 9054. This was nothing more than a corrective move, and we’re getting ready to move back to the upside. Now, what we hear constantly are bombarded with different websites and so-called gurus and analysts that are saying all these different things, but we have to look a little bit past that, guys.
If we look at this black line I’ve drawn down here, that is the yearly opening price. That is a very powerful tool to use in the early part of any calendar year, and it’s very important to use that at the end of the calendar year. Right now, as long as we’re holding above the 8985 mark then the dollar still is indisputably bullish on the year. That’s how we would assess this. If it’s above its yearly opening price, then how could it be bearish? Because essentially if you bought the dollar index or sold the dollar index at the beginning of the year, if you sold it, you’ve consistently lost money the entire year.
If you bought it, however, then maybe you’re not making a lot of money, but you are making money on the years. So if we close below that level for two days in a row, then that would be of interest to me. That would tell me that we are going into a trend reversal. I believe it’s too early to tell and we just mainly need to identify these key levels. And when doing that, we can trade off that.
Gold
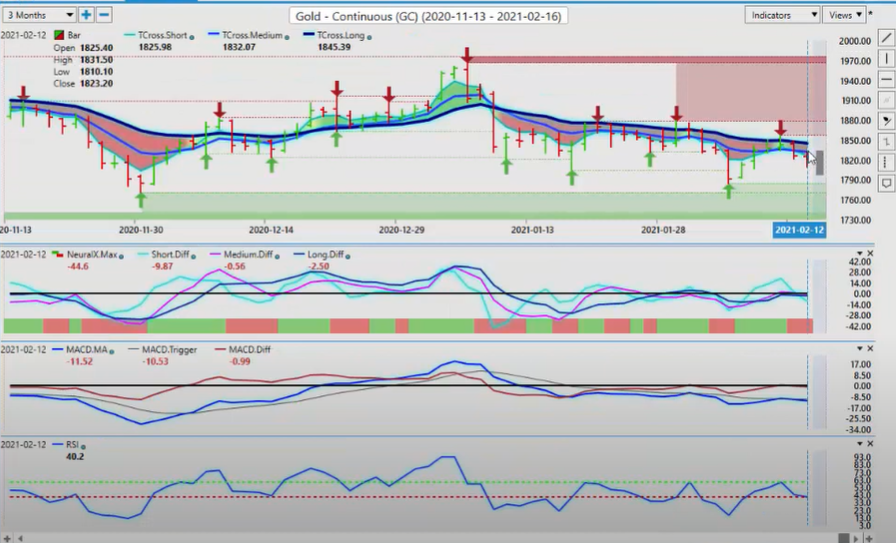
Now, one of the main factors that I use to gauge the strength of the dollar is of course gold contracts. So when we look at the VantagePoint software this past week, it’s the same thing. Gold moved up, but it moved… It’s basically at least as of now has confirmed that this is merely a corrective move. You can see that three days in a row, we were banging into this key VantagePoint T cross long, and then ultimately we broke away from the predicted moving average and down we go again.
Gold
The yearly opening price here on gold, I can attach it to my screen, put it up here. It’s at about 1904. Gold has never been bullish on the year here, guys. It basically sold off in the early part of January and it has not been able to get up above this. People often ask me, “Am I a gold buyer?” My answer is absolutely not. I sell on any rallies and I have buy limit orders sitting ready to go above 1904, the yearly opening price. Even if we get above the T cross long and vantage point, we still must get over multiple verified resistance zones. And we have to get over that yearly opening price.
So potentially very unlikely. But again, when we see this corrective move a week ago in last week’s weekly outlook, it shows the predictive nature of using market correlation. It told us that gold was going to go higher, but it didn’t say a trend reversal. It told us the dollar was going lower, but not a trend reversal there either. So it’s still a piece of… It’s a work in progress. Let’s just say that. So until gold can get above 1845 and stay above this level, then clearly there is a very bearish tone to this.
S&P 500 Index
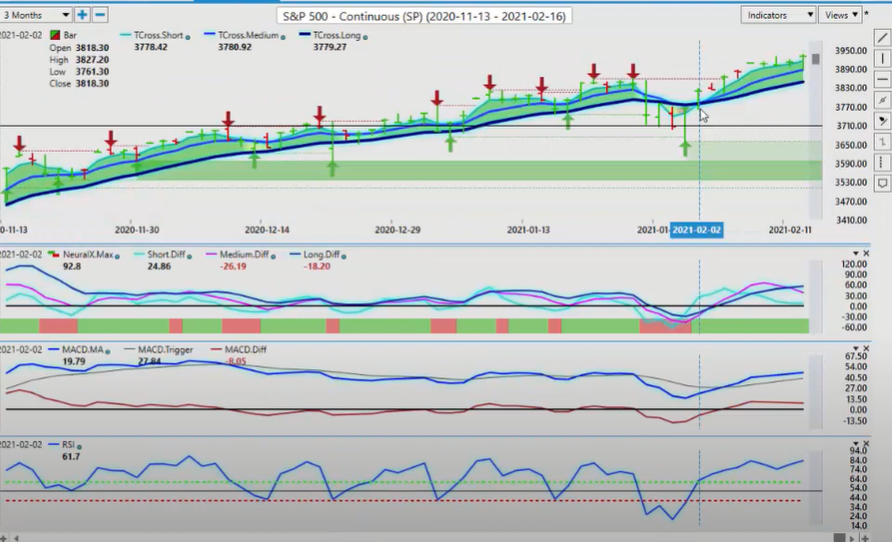
Now, when we look at the S&P 500, once again, it continues to climb higher. My concern is that we have a signal right there. Our medium-term crossing our long-term predicted difference. We witnessed firsthand how powerful that indicator is in last week’s presentation, and then looking at the outcome from this particular week. Again, this is an outlook, not a recap of something that’s already happened. We’re talking about what to do in the next trading week based around the VP indicators.
S&P 500 Index
So right now that’s a little concerning. If I see my neural index go from green to red, we may have a short here, guys. These equities are way overpriced in my opinion, but still, I will openly admit, I am very cautious whenever I short this thing, because mainly of the fed interfering and things. But for now, we’ll continue to monitor it, but that particular signal is very, very seldomly wrong.
Again, where it can struggle at times is with the S&P 500 only because of the fed and everybody else interfering in these equity markets. Now, our key vantage point level, 3848, I believe that we may very well come down and test that level at the beginning of the week. But remember, we’re in a holiday short week. We’ve got the fed minutes on Wednesday. So just be very cautious in Tuesday trade this week. Monday, we’ll be pretty much flat with the US and Canadian markets closed. I think there’s a holiday in Japan too. So just keep that in mind here. But again, if we click on our F8, the easy way to tell when this is reversing is we will see a breakdown below this level, 3897.
Crude Oil
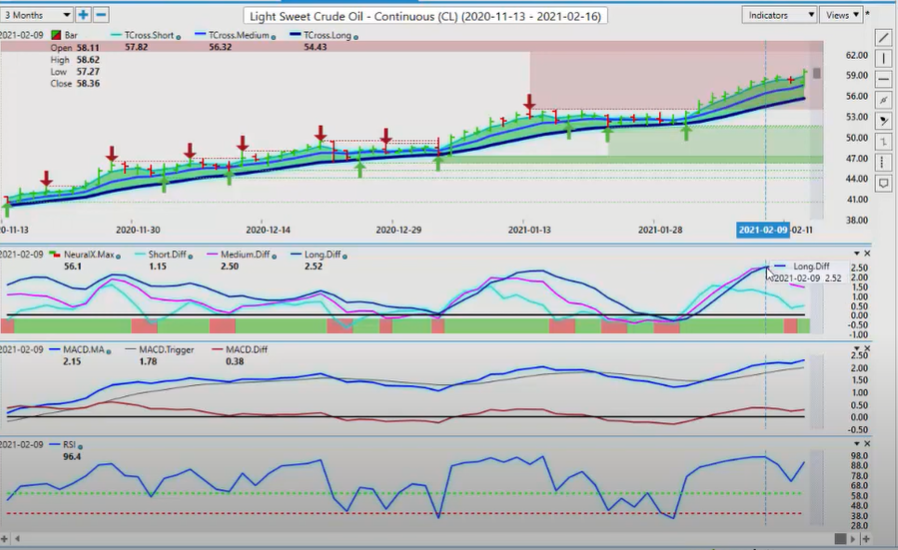
If we break down below that level and we close below that level, we are likely going to start a corrective move that could be much deeper. Now, if that does come to fruition, then I can all but guarantee you that oil is going to follow. We have the medium-term crossing the long-term predicted difference, but oil is just getting dragged up with the S&P.
Crude Oil
Now, it can only do that for so long, but just remember that if the cell signal comes to fruition on the S&P 500, it will be an easy sell. Not that trading is ever easy, but it will be an easier sell on oil up at these very, very lofty levels.
Bitcoin
Now, when we look at Bitcoin, once again, Bitcoin, the endorsement from Elon Musk, we’ve got another more chatter. I believe it’s JPMorgan Chase talking about investing 150 billion, something along that line. I haven’t read the whole article yet, but more and more people are piling into Bitcoin here. More and more central banks are calling it a bubble.
I’m not in that camp, because again, I’ve done my homework. The people that are calling it a bubble probably haven’t looked at Bitcoin or the digital currency sector over the last 10 years. Bitcoin doubling every year for the last 10 years, that alone tells me how bullish this thing actually is.
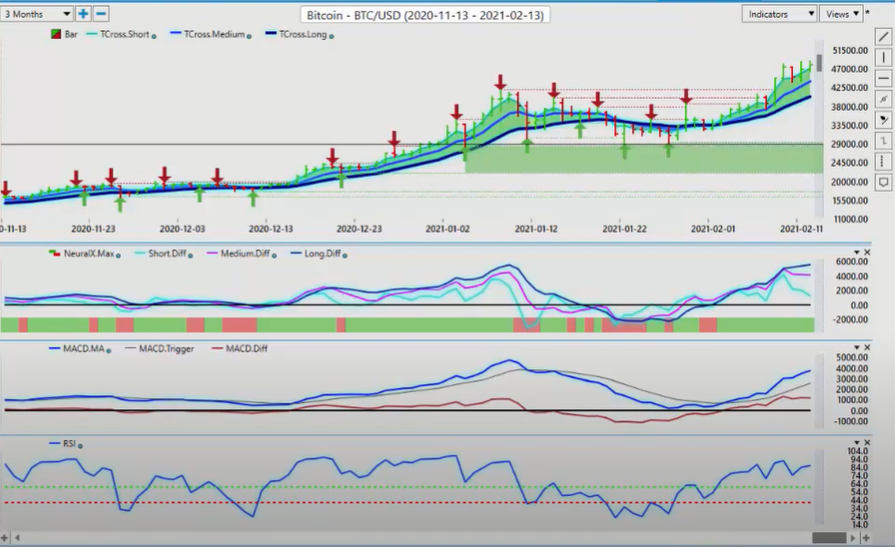
Bitcoin
Now, can it go to 140,000? Maybe. My forecast for the year is already complete. I forecasted when it was at 20,000 that we were going to go to 40,000 this year. I think we’ve come there way too fast personally. But again, people are not listening to Wall Street. They’re going in and buying this thing based around its performance over the last five, 10 years. So again, I think that Bitcoin is going to continue to move higher, but again, be careful on dollar strength.
We know that the dollar strengthens towards the end of the month, but if we look at the longer-term charts on the dollar, last year it was around the 17th or 18th of February with a dollar mysteriously turned back up again. So if that does come to fruition, it’s very difficult to call this one because you’ve got two big players here, Bitcoin now and the U.S. dollar. And the dollar index and Bitcoin are going up at the same time, seems like it’s an impossibility.
But in actual fact, it has happened multiple times in 2021. So I’ll continue to monitor both of them. But for now, Bitcoin appears to still be showing signs of further gains.
Euro versus U.S. Dollar
Now with the Euro, we’ve again had a corrective move. What appears to be a corrective move higher on the Euro. Once again, the medium-term crossing the long-term predicted difference where this was forecasted last Saturday, before the market even opened.
So again, nothing is 100%. That’s true. VantagePoint continues to promote a solid 80, 85% accuracy. Now, that depends on which indicators you’re using, which markets you’re using, but for the most part, that accuracy remains extremely high. Now we can assess here that it’s been a very slow week in the markets, the Euro stalling out here. You can see you’ve got a double top maybe here. I don’t like to use double tops just to be clear. So I used the term resistance. You have resistance here and we’re stalling.
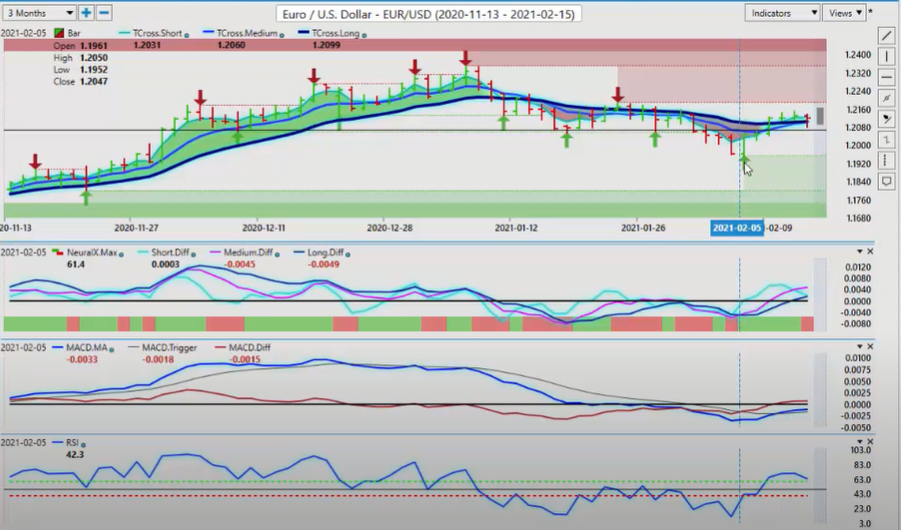
Euro versus U.S. Dollar
Now, the predicted RSI is starting to roll back down, but again, we’re getting above the triple EMA cross at 12106. The question is can we hold above it? When we click on our F8 in our software, once again, we can see that we’ve got above the predicted moving average, but it’s struggling to hold above it. There’s very few buyers up here. If we look at the verified zones, we’ve got a swing high up here. We’ve got, again, a lower high. We’ve got lower lows. Most of this points towards the Euro struggling to maintain longs up here.
And remember what I’ve always said, guys, or what I’ve tried to convey here is that the only reason that the Euro got up here to begin with was on the COVID stuff a year ago when gold shot up higher, it dragged the Euro up with it. The inner market correlation, you want to be very mindful of here is the strong positive correlation that the Euro has to gold. Some of the other websites I’ve read.
Once again, I reviewed some of the ones on FXStreet and some of the different websites. The Rockefeller report caught my eye again, where she’s actually saying not to use other currencies and other asset classes to forecast the market you’re trading. I don’t think I’ve heard anything more ridiculous than that personally. Of course, we want to use inner market correlations. That’s how we understand how the Euro moves, how the dollar moves, how Bitcoin, the S&P moves, gold. They’re all tied together in one way or another.
So in looking at how weak gold actually is, that would tell me that the Euro moving higher is probably going to stall here under this 12180. Now, if we get above 12180, we may extend higher to the most recent swing high at 12349. But that’s where the yearly opening price is too. So again, be very, very cautious buying in because remember, the same people that are telling you to buy the Euro now are the same people that got caught short on basically January the 5th, and they’ve been holding Euro longs this entire time underwater.
The Euro has been below its yearly opening price basically right out of the gate on January 1st. Now, we assess that by money flows coming back into the US. The fact that the dollar is normally strong at the beginning of the month. A lot of things were happening, and mainly those inner market correlations. So for now, the Euro still is a bearish tone. I will argue while under 12189, we will look for the medium term to turn back down, cross over the longterm predicted difference, and the RSI of course, moving down also.
British Pound versus U.S. Dollar
When we look at the British pound US dollar, this is again, it’s not using other currencies to gauge the currency that you’re trading or the commodity you’re trading is simply not a good plan here, guys. The British pound used to go up and down with the Euro, but the British pound is actually the other culprit that’s putting pressure on the Euro via the Euro British pound cross pair. This is, again, lost in translation in a lot of analysis. But as Euro, Great Britain is under selling pressure, that’s actually boosting the British pound and it’s weakening the Euro.
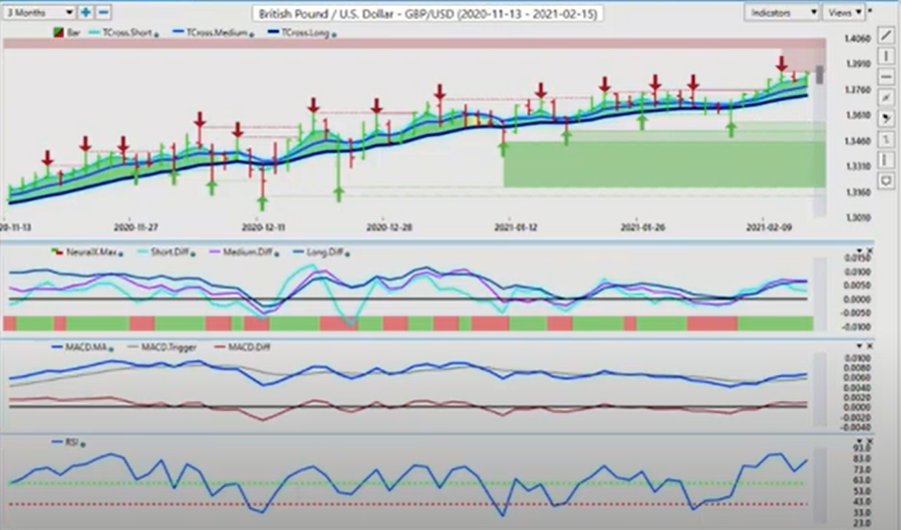
British Pound versus U.S. Dollar
So the Euro has a lot of strikes against it here, guys. The British pound is clearly bullish on this particular chart. Even during that period of dollar strength, the British pound basically still continued to move up, but the Euro did not. So this is a whole different new thing with Brexit for us. As I said, normally, the Euro, US, and British pound, US dollar, they both go up and down together. That is not happening. The pound is moving higher, the Euro is not.
So if you look at the gains just in this past week from the 136 area, all the way to 139, the Euro barely even moved up a penny. So there’s a big difference here, but the pound, maybe a little bit overextended up here. We can see that a signal is trying to form the medium term crossing the longterm predicted difference. Yet another warning sign that we could see further dollar strength coming.
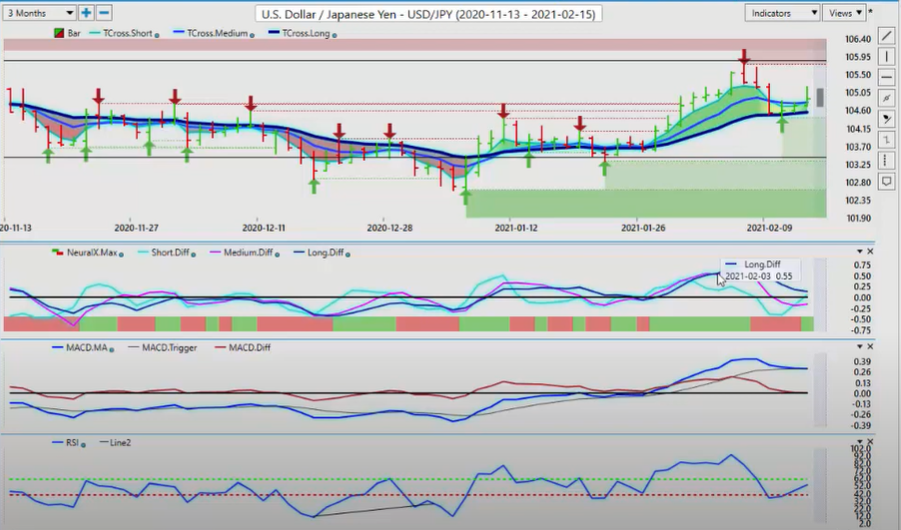
U.S. Dollar versus Japanese Yen
So be very, very cautious with this particular pair. Now, one of the places to buy dollars has been the dollar Japanese yen. Now, once again, we’ve had a corrective move lower based on that medium-term
U.S. Dollar versus Japanese Yen
crossing the longterm predicted difference, but we can also further assess that the dollar is unable to break down below this main vantage point pivot area, the T cross long, 10456. It’s held the line the entire week. Even with my own direct clients, I’ve had them buying off this particular level and saying, “Look, if we get through here, that’s fine.”
But right now, after a two day failure, now you can see the dollar yen starts to accelerate. So one 10456 remains a strong support level for us. Our neural index has turned from red to green or MACD is up. The RSI is coming out of that 40 area. We’ve closed the weekend at 53.6. That’s a bullish sign. Now, we just have to get above that 60 level on the RSI and continue to advance off of this T cross long.
U.S. Dollar versus Canadian Dollar
When we look at the US Canadian pair, one of the places where you actually can sell US dollars. Once again, a very, very good call where you’re continuing to push lower, but you can see that this verified zone here, this low around 12685 is a real tough spot for this particular pair. We don’t have a lot of sellers down here. Now, our medium-term crossing our long-term predicted difference has not occurred yet, but you can see that it’s trying to cross back to the upside.
That’s again, a warning sign of a potential long trade. Once again, with US Canada, we’ve got our yearly opening price that is pretty much intersecting around 12717 is I believe where that yearly opening price. But we can get above the T cross long. We can have a pretty decent long trade here. Here’s what you need, guys. And again, being an outlook and not going on about something that already happened, this is an outlook.
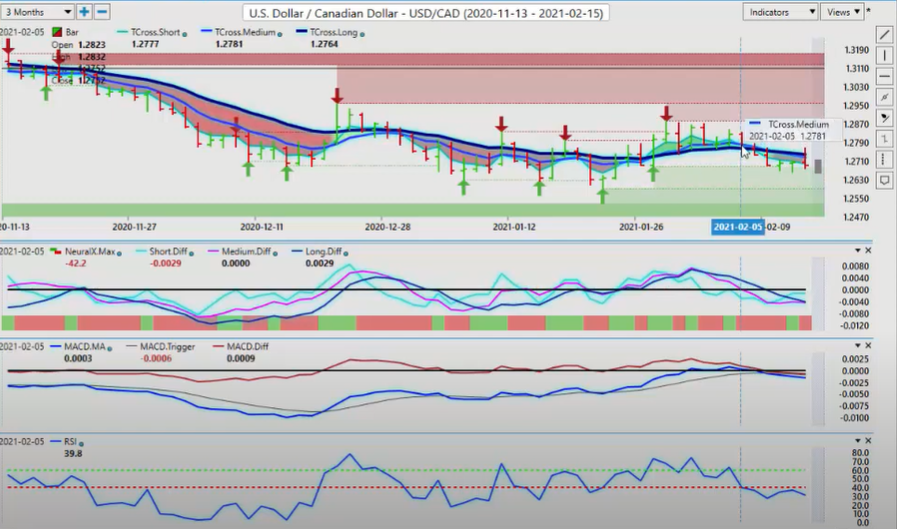
U.S. Dollar versus Canadian Dollar
So what you need to monitor in order to take a long trade is if the S&P 500 and oil move lower, US-Canada will move aggressively higher very, very quickly. And we did see this, this past week where we had some real short covering there on Friday as the S&P stumbled, but it recovered into the close, but I’m not sure how many more times the S&P can do that.
But again, if you’re trading this pair know your levels. That key pivot level there is 12737. When we click on our F8 on our software, we use the predicted moving average by itself. That long predicted however is 12715. That is approximately the yearly opening price. So if we clear this level, and one of ways that I often play this with the VantagePoint software, I will simply put limit orders above 12715 and above 12740. And many, many times what’s happened is they’ve both hit.
So the one came on and then the secondary order came on as the trend shifted. So if that medium-term crossing the long-term predicted difference crosses back to the upside, then we’re going to have a pretty good long trade probably back up into this 128129 levels.
So watch that one very closely, and don’t be afraid to straddle this blue line. It’s a very effective way to trade.
Australian Dollar versus U.S. Dollar
Now, Aussie, US and New Zealand, US both basically the same as US-Canada only inverse. US-Canada goes down. Aussie-US, New Zealand-US, they go up. Right now, the Aussie-US is coming into some very, very stiff resistance. And this is resistance from this calendar year. The Aussie-US is slightly above its yearly opening price here, guys, but not by much about 60 pips. I believe the yearly opening price on this one is around the 77 mark.
So once again, the Aussie will fall if the S&P 500 corrects lower. The Aussie will take the brunt of that, so will the Kiwi. But right now, you can see these verified zones are medium-term
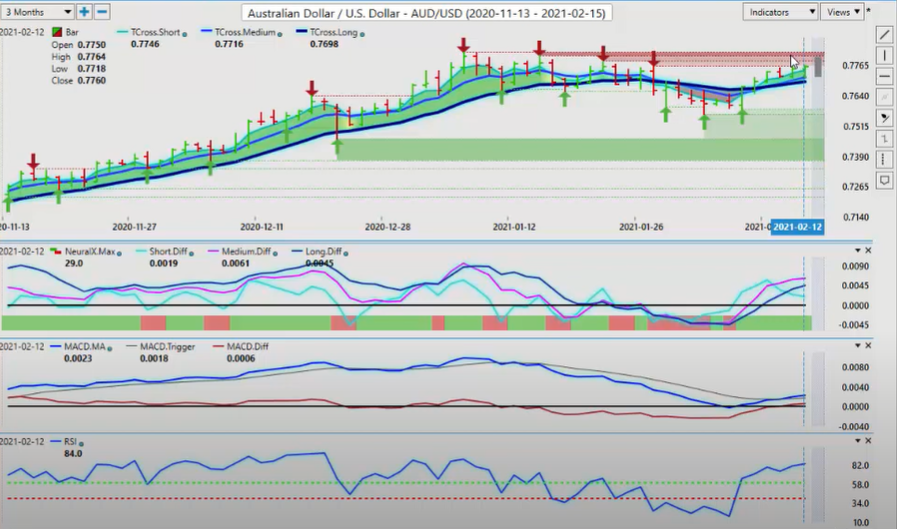
Australian Dollar versus U.S. Dollar
is nowhere near crossing our longterm predicted difference, but you can see it’s starting to flatten out.
Our predicted RSI is at 84. It’s overbought, but it could still extend a little bit higher, but the neural index is still green. Once we get a red signal from the neural index and we start getting this pink line turning down, that will be the trigger for us to go short. But if we hold above 77, longs will still be in play.
Once again, an easy trick you can do with your VantagePoint software is identify these pivot areas T cross long 7698. We click on our F8 and you can see every single day, once we’re going down, down, down, down, down, then we cross above the blue line. Then every day we’re in contact with this blue line for a long trade.
So once again, here, guys, I think you know what I’m going to say next, if you put a straddle just below the 77 mark, a limit order, a sell stop limit order, then the second it breaks underneath this level, you can actually take it. And that’s 7726. So you could put that right around. You can sell up into the VantagePoint predicted high, if you wish, or you could say, “Okay, I believe that the S&P is going to go lower and the dollar is going to strengthen. So I’m going to put a limit order below this area.” And then bang, it just hits it and away you go.
New Zealand Dollar versus U.S. Dollar
The same exact thing would apply to New Zealand here, guys. When we look at New Zealand, it’s really struggling along here, and that signal is already starting in progress. So late last week, we saw the same signal on a number of different Forex pairs to buy it. The Aussie-US, the New Zealand-US, US-CAD short, dollar-yen, Euro-US long, US-Swiss Franc. All these pairs that I went through, that all came to fruition.
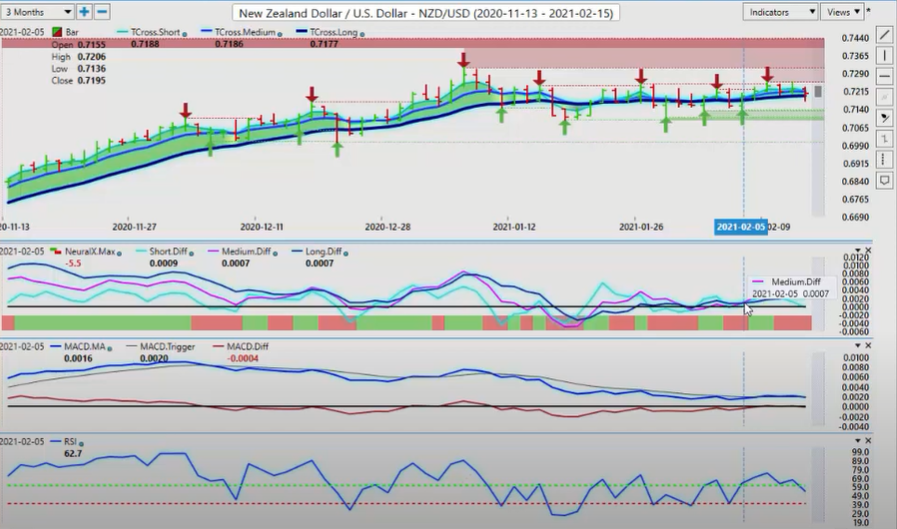
New Zealand Dollar versus U.S. Dollar
But right now I have two groups of trades that I’ll share with you, guys. I’ve got my dollar short trades and that’s buying Aussie, New Zealand, CAD and the British pound. Then I’ve got my dollar long trades where I would be buying the dollar against the Euro. I would be buying the dollar against the yen, the Swiss Franc. And maybe a little bit on the CAD side is Canadian dollar is tied to the US economy.
So that type of grouping and understanding these correlations, inner market correlations in which group to buy the dollar against and which group to sell the dollar and how they’re being driven by gold, the S&P 500, oil, and now even Bitcoin is a very successful way to gauge your trading. So with that said, this is the VantagePoint AI Market Outlook for the week of February the 15th, 2021.
Are you using A.I. yet?


