


VantagePoint AI Market Outlook for the Week of February 22, 2021
VIDEO TRANSCRIPT
Hello, everyone and welcome back. My name is Greg Firman, and this is the VantagePoint AI Market Outlook for the week of February the 22nd, 2021. Now, to get started this week, we’re going to begin where we always do with that very important US dollar index and our main inner market correlations, that being gold, the S&P 500, Bitcoin, and of course, oil.
U.S. Dollar Index
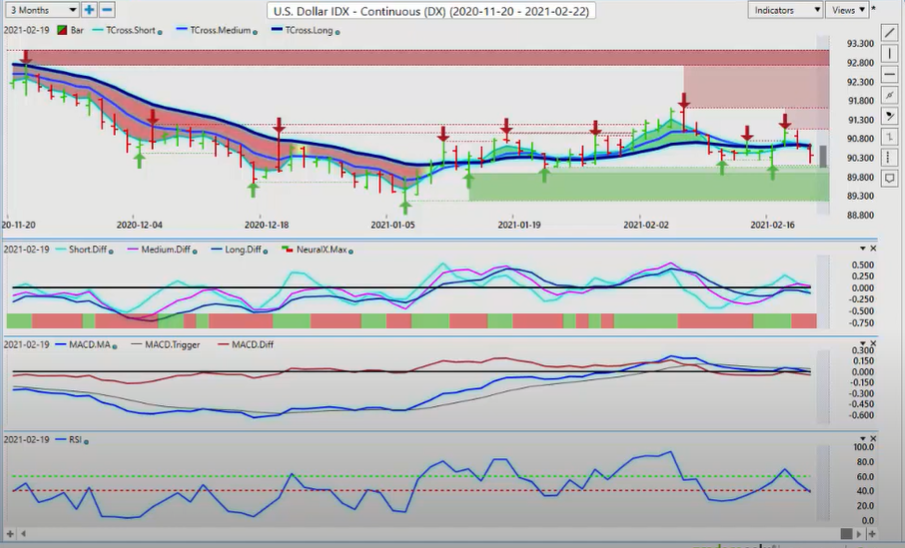
When we look at the dollar index in last week’s presentation, I had stated that it appears that we’ve got a short-term buy signal forming on the dollar as it’s pushing higher, but again, unable to hold these gains at the end of the week. Dollar longs, dollar bulls, if you will, backing away, taking profits, sending the dollar lower. However, we still remain locked in this very tight range above the yearly opening price. Now, the yearly opening price on the dollar index approximately around the 89.80 mark.
This is the level we really want to keep our eyes on here if we see this coming back here. There’s January the sixth. Reading around this area, I would strongly advise that you just simply put a line on here on your chart like this, and that’s our yearly opening price right here. Now, that’s providing very, very strong support for the dollar. Only if we break down below this level would I consider the dollar being in more of a downtrend.
Now, places of value is another thing we want to look at and identify, particularly in the Forex market, places where to buy dollars and where not to buy dollars. Right now, we would not be buying dollars against the Aussie-US, the New Zealand-US, pound-dollar, or maybe even US-Canada, but we would be buying dollars against the US-Swiss Franc, the dollar-yen, against the euro. This is what most miss in the Forex market using the other currencies to identify where the dollar is the strongest and the weakest.
But the dollar index is heavily trade-weighted to the euro currency, and the euro we know is very heavily correlated to gold. So that’s why the Euro is struggling here. When we look at the indicators from VantagePoint to start the week, the dollar is likely to come under pressure at the beginning of the week, but I’m not sure how long that’s going to last. If we look at where we were, this is an excellent way, by the way, guys, to just simply look at seasonalities for yourself. When we look at the seasonality from a year ago, the dollar was under pressure.
Now, remember, this was caused largely by COVID. COVID, we’ve got the vaccine, but essentially the dollar was at its strongest going into the end of March. The issue with COVID, I’m not sure it’s there like it was a year ago, because again, we’ve got the vaccine. We’re making progress. Some of the countries are pulling out of lockdown, some aren’t. But overall, things appear to be improving. I’m expecting that huge sell-off that we saw last year at this time, but I do expect the dollar would remain under pressure until at least the end of the month.
So when I look at the indicators from VantagePoint, the neural index is still down. Our RSI is saying that we don’t have any upward momentum. And at 38.8 on the predicted RSI, it’s also telling me momentum could be building for another run at this 89.80 levels. So we’ll watch this very, very closely. But remember here that again, we would have to get below 89.80 and close below that for at least two days in a row before the dollar comes under pressure against all of its counterparts.
Gold
Gold
Now, when we look at gold again, going back here to January the eighth where the dollar, or excuse me, the gold bulls were confident that they were going to back over the 2,000 mark, we’re looking at the VantagePoint software. I’ve been a strong advocate of selling gold from day one, expecting money flows coming back into the US. The US dollar is coming back in in the month of January. Usually the dollar pretty strong in the first quarter. Not a good time to be buying gold. Gold continues to move lower.
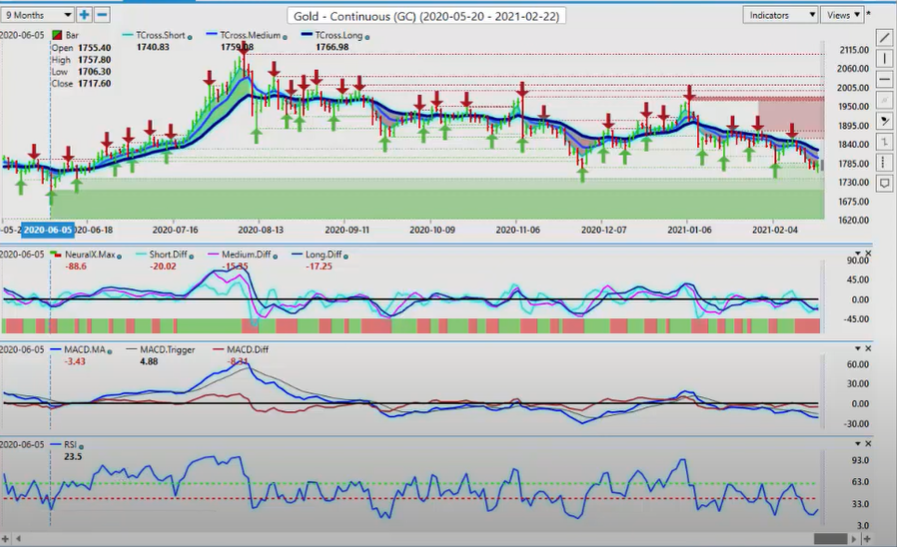
We’ve got a very mixed signal here, but the neural index has been firmly down this past week. Again, when we back this out, we’re looking for additional verified support. Right now we do have some sitting right here as identified in the software at 1771. If we lose 1771, which is extremely likely, when we look at that, that would target, again, the 1740 mark. And inevitably, I think we’re probably going to head down to the 1706 mark before we get any kind of real bounce. But again, I’ve also been a very strong advocate here for Bitcoin.
And in my respectful opinion only, Bitcoin appears to be the new gold. The reason I say that is corporations are not taking payments in gold, but they are accepting payments in Bitcoin. They’re putting their assets, their profits into Bitcoin. Elon Musk, there’s a number of companies that are doing this now that are setting up payment forms in Bitcoin. So whether the powers that be like it or not, Bitcoin is real and it appears to be here to stay. And this is really taking the luster out of gold, a flight to safety.
There’s been multiple occasions they could have gone into gold and they didn’t. Now Bitcoin over the 50,000 mark as predicted earlier this year. So again, we’ll continue to monitor this, but right now, there is a little bit of sign of life in gold, but here’s where we use our VantagePoint software more effectively. We identify that any move higher at this particular time would be corrective in nature. We would also apply a yearly opening price to gold.
So if we go back here and we look at this and the yearly opening price simply allows us to gauge without a whole bunch of additional indicators or a bunch of opinions or gurus telling us all these things, gold every year we do a reset on January 1. We start a new performance… For anybody managing money, we do a performance check starting January 1st. It’s a new year. Right now gold did not come out of the start of the new year very good at all.
We can see back in here, January the 5th, January the 4th, it certainly gave the bulls the impression that they were doing fine. But very quickly in the VantagePoint software, if we use our blue line by itself, you can see here that that was the warning sign trigger for me. I prefer to use the blue line by itself, because there’s absolutely zero lag in it. I can gauge whether the market is… If the market strong, it’s above the blue line. If it’s weak, it’s below it.
But when it comes back up and tests it like this after breaking it, then that is telling me that we’ve probably got a bigger move down. Out of all of these calendar days, you may have two or three days over the last two months where gold has been able to hold above this VP blue line. That line currently is that 1797. That’s where all of our resistance is to start the week. And again, not a lot of sign of life here other than corrective in nature.
S&P 500 Index
S&P 500 Index
Now, the S&P 500 going into next week, what another trick you can do with your VantagePoint software also is identifying real potential tops and bottoms. Whenever I see the MA dip cross like this, what I will do is I will often draw a line over top of where that actually took place. So I would put a line somewhere right around this particular area here and say, “Okay, this is my line in the sand.” So when that crossed over here, then what you can do is say, “Okay, well, once this has crossed over here, I’ll look at the most recent high bar.
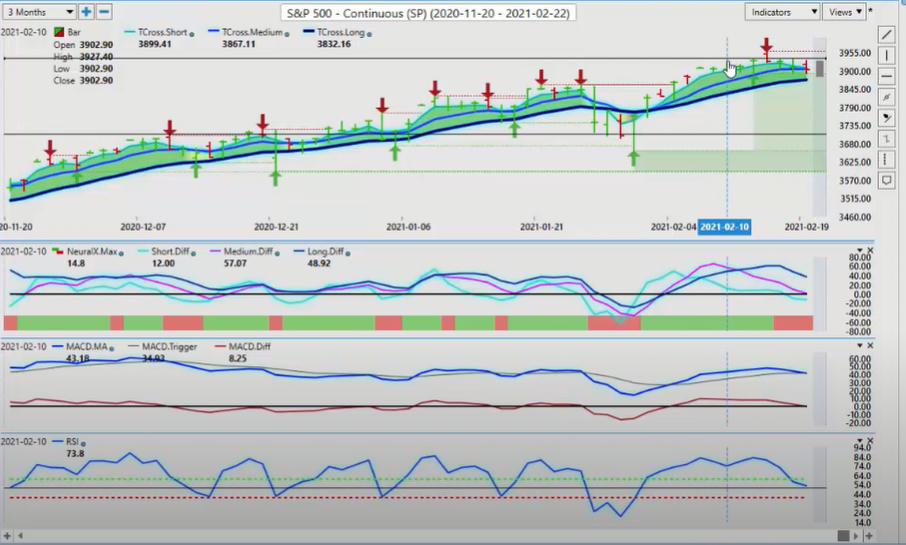
We’ll use this one right here, and I can draw an additional line on there like this.” Okay? And then what I can do is say, “Well, at this intersection mark here, I need the market to get above this particular area, or this MA diff cross here is more than likely there might be something there.” So we basically move sideways for three or four or five days, but ultimately the neural index comes onboard. The second the neural index comes onboard, the market starts to fall. Now, we’ve got heavy support that will come in at the low of 3891.
We’ve tested that multiple times. But if we click on our F8, this is where we want to get the lag out of our systems and say, “Okay, we’re looking for a close below this blue line.” So that current level is 3909, and we have actually closed the week below that level. Now, it could be just profit taking on the week, but I’m not convinced at this particular time. These equities are getting all bunched up here around this 3960 mark, 3950. So in short here, guys, this needs to get moving on the upside real soon, or there’s going to be a much deeper corrective move coming.
Crude Oil
Crude Oil
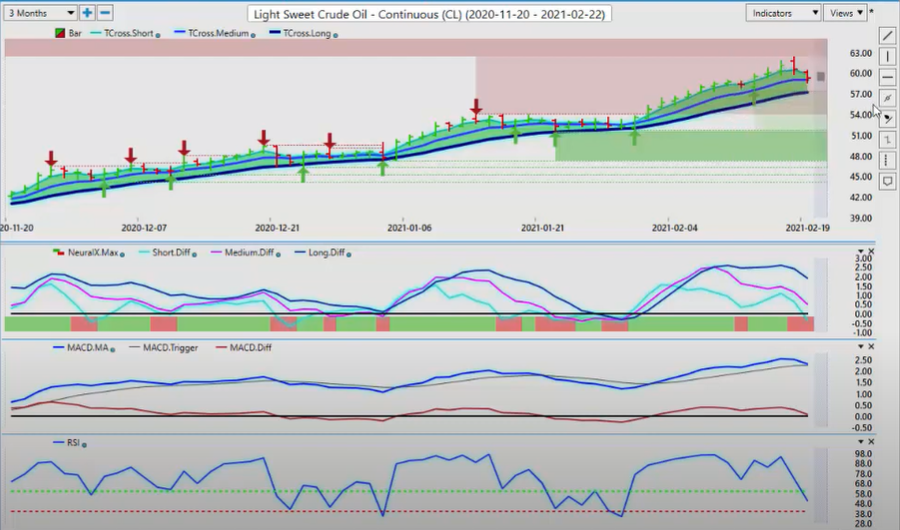
I think that there’s a very strong possibility of that if the fed can remain out of the market, which, of course, I’m certainly not convinced of. Now, the light sweet crude contracts, they will follow. The same thing will happen here. If we look at that MA diff cross, we put a line up on here and say, “Okay, well, at this particular time, the medium term trend is weakening against the longer term trends.” We would look at this and say, “Okay, wait a minute, maybe buying up here is not such a great idea.” But to be clear, we are still above 57.22.
As long as we stay about that, the primary trend is still up. However, to get closer to the flame, so to speak, we take the blue line, the long-term crossover without the black line, the blue line bar itself, and as you can see that we’re losing momentum. We’ve been hugging this blue line every day. But right at this particular level on Friday, we actually closed below it. You can see that the long predicted 59.46 and we’ve closed at 59.26. So that tells me the equities and oil could come under a little bit of a selling pressure at some point next week.
Bitcoin
Bitcoin
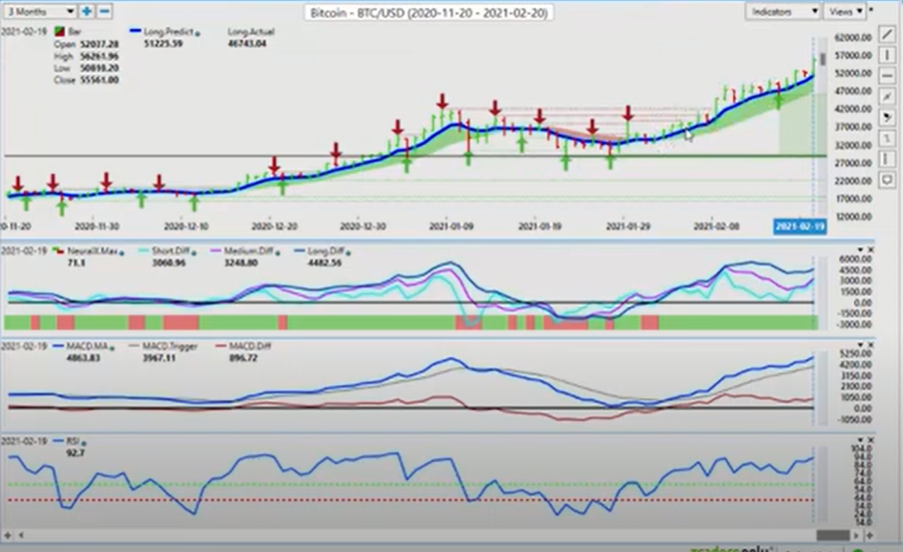
Now, again, what we’re going to do here, officially Bitcoin is part of the AI Weekly Outlook now. It’s been part of the weekly outlook for a considerable period of time actually, because again, I’ve been a strong advocate going back into the middle of 2018 where I was at that time buying into the Warren Buffett’s of the world telling me that Bitcoin is a scam. Bitcoin is that, all these different Wall Street types. And then I look closer at the charts, I did a little more history on this, noticing that Bitcoin had doubled every year for the last 10 years.
At that particular point in time, based on my knowledge of the markets, I said, “I’m failing to understand why they think that Bitcoin is a scam, and more specifically, why Bitcoin should be going down the way they’re saying when everything tells me it should be going up?” Bitcoin is certainly not making some of the powers that be happy as some of the banks are now scrambling for a digital currency, but we are getting a little toppy up here.
But again, when something is in a very strong bull market and a very young bull market, I might add, where it’s actually in a breakout phase from this 20,000 mark, we don’t know what the top is here on Bitcoin. You’ve got a lot of market participants trying to sell this thing up here, which I think could be very dangerous. Yes, we’ve been overbought on this thing for probably four months. That’s why indicators that show overbought or oversold.
For the most part, they have a very low win percentage because you’re trying to fight the market here by going the opposite way. So right now, Bitcoin remains long. If we want to get into a tighter area here, once again, showcasing how we use the predicted moving average as a daily pivot level to buy from, this is a very, very nice move, and it continues to move higher. To begin the week, if we’re going to buy up here, we would wait and let the market…
Even though the market is closed at 55,561, we wouldn’t even look at this guys until 51,225, and then we would use the T cross long as additional support or an additional buying area. So again, there’s a lot of stocks out there that are blockchain related. You’ll notice that all of those stocks are well up, doing very, very well. And again, anything related to Bitcoin or blockchain is certainly… It’s still a very, very young investment here. Even though it’s at these high levels, we have to understand that.
Euro versus U.S. Dollar
Euro versus U.S. Dollar
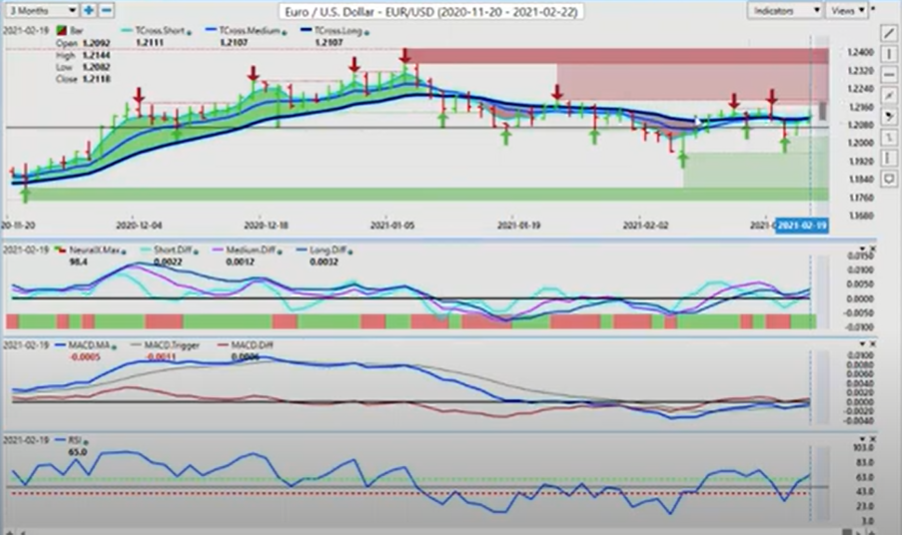
So as we go into some of our main Forex payers starting, again, where we always do, the currency that’s at the top is the Euro-US. This is what the main battle in the currency markets between these two. Now, the Euro, moving back and forth between these verified zones. In my respectful opinion, if the Euro has any chance of breaking higher, it must clear two main levels, 1.2189 must clear that, and it also must clear its yearly opening price as of January the 4th, which I believe is around 1.2230, 1.2240.
And that’s going to be a very, very tall order, with gold prices as low as they are and no sign of life for buyers. So for now, what we’re looking at is, again, when we see this market on a Friday, we always take Friday price with a grain of salt here, guys. You’ve got thin illiquid markets. The cat’s away, the mice will play, so to speak. So be cautious with longs up here. We are in a period of known dollar weakness until the end of the month and into the first week of the new month. So be just careful with this. Okay?
Because again, what appears to be bullish often isn’t. Whenever we get a big bull move here on a Friday, I often disregard that, because again, thin illiquid markets. The indicators are very mixed. The MA diff says we’re still going lower. The neural index is higher. The RSI is showing a little bit of momentum, but the bottom line here is we’re range trading for now between 1.2189 and the lower end of this range, which I would consider to be 1.1952. But we do have the support at 1.2024, where you can see the buyers started to step in at the beginning of the week.
U.S. Dollar versus Swiss Franc
U.S. Dollar versus Swiss Franc
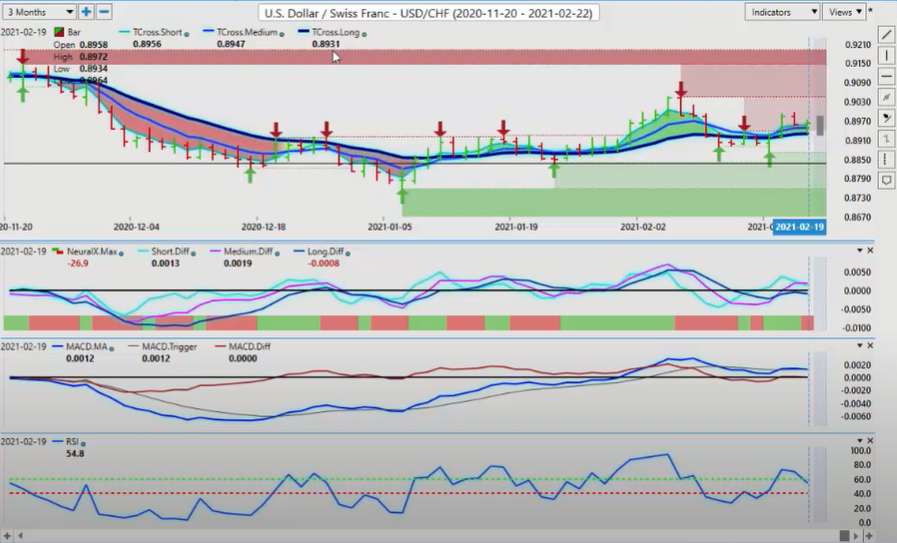
Now, one of the main currencies, again, that we do look to buy dollars is we have two places where I’ve had my clients buying dollars, and that’s with the US-Swiss Franc and US-Japan. This once again is highly correlated to gold. Gold contracts are well down. The Swiss Franc and the Japanese Yen don’t like that one bit. And that’s why these currencies are weakening. There’s a science behind this. So right now, US-Swiss Franc will continue to advance even with US dollar weakness as long as gold continues to move lower.
The areas that we want to watch to begin the week, .8931. We’re closing at .8964, I believe, but this is a major level rate here. And then again, you also want to put your yearly opening price onto your charts to give you a better idea. Now, that’s way down at this .8790 mark or approximately right in this area here. There’s our 30th, there’s the 31st, and there’s the first. Actually they already marked it for us. Good. So that opening price there is .8837. The way we would view this is that the dollar is still…
This is still a place of value to buy dollars while above that particular level. Our indicators on VantagePoint or AM diff looks good. Neural index obviously picking upon the soft day on Friday with the dollar. But again, not a lot of momentum on the upside or the downside with this particular pair. We’re basically range trading. So again, longs carry a slight advantage. Now, when we look at the pound-dollar continues to advance, I keep getting asked the same question, are shorts looking pretty good up here?
British Pound versus U.S. Dollar
British Pound versus U.S. Dollar
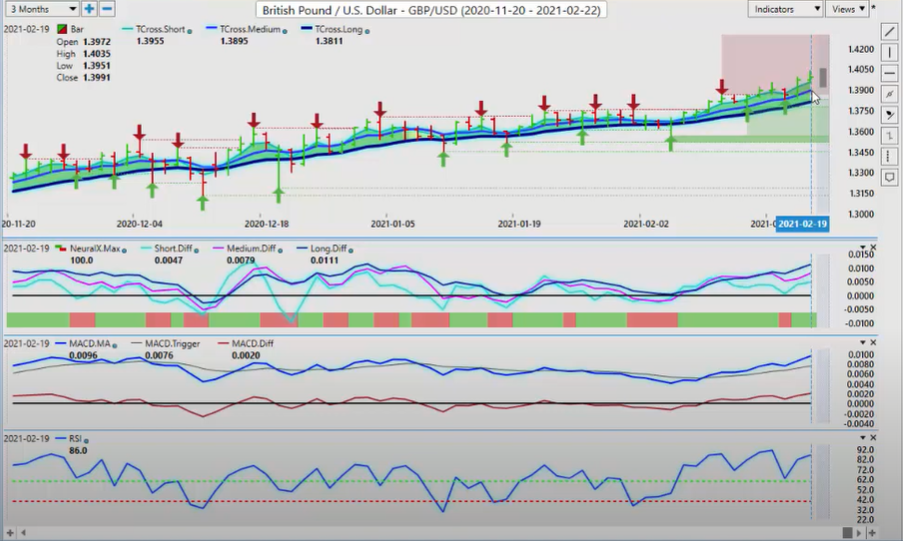
And my answer has repeatedly been no, it’s not looking good, because the Euro-US and the British Pound-US are no longer trading together on dollar weakness. The British Pound is actually the one that’s also putting additional downward pressure on the Euro via the Euro-Great Britain cross pair. Now, what I mean by that is that if they want to sell Euro-Great Britain, the cross pair, this is what they have to do. They have to sell Euro-US and buy Great Britain-US to take that short.
This is where a lot of that financial pressure is coming from, that inner market correlation, right? When we look at this right now, the pound continues to advance. So as long as Euro-Great Britain is going lower and the sellers have control of that particular pair, that will help keep the pound-dollar up. 1.3831, That’s our main level in the sand. When we click on our F8 in our VantagePoint software once again, that long predicted coming in at 1.3914, this is the key level to start the week that we want to watch.
You can see how the market is continually coming back like a moth to a flame to this blue line, only to violently bounce away from it when it gets to it. So a very effective strategy. To begin the week, we also have our VantagePoint predicted low coming in at 1.3924. So easy peasy, right? There is your buy zone right in that particular area.
U.S. Dollar versus Japanese Yen
U.S. Dollar versus Japanese Yen
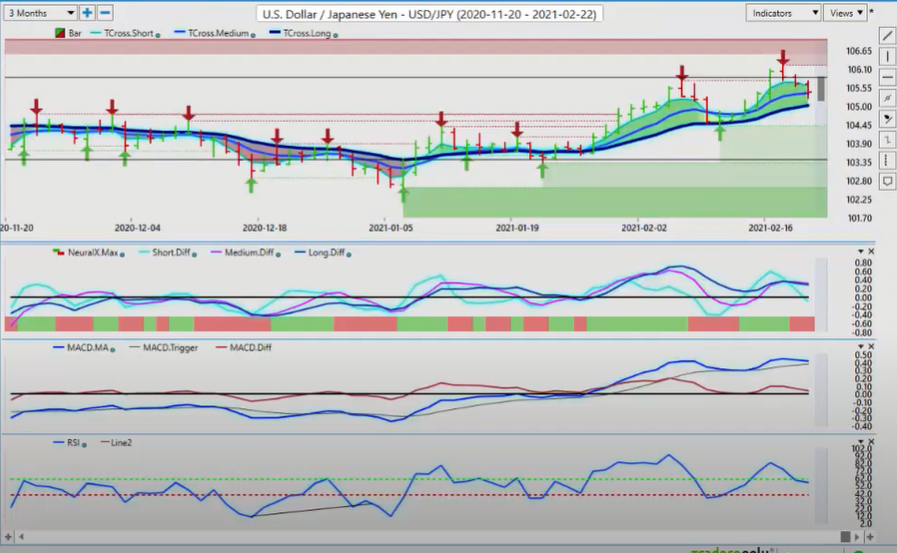
Now, the dollar-yen, once again, this is a place of value to buy dollars, because the yen is being affected, is being weakened by those soft gold contracts. The inner market analysis is strong and stable.
As long as gold prices are down, the yen is down, which indirectly means this is a place to buy dollars. Now, our key support to begin the week is going to be 105.03, where we would happily be buyers here. Not a lot of momentum. Nothing goes straight up and nothing goes straight down. But as you will notice, we are making higher highs and we are also making higher lows. When we click on our F8 in our software, once again, we’ve got some volatility on Friday. But even if we break down and close below here, like what we’ve done, I would not put a lot of weight on that.
I think that by Tuesday, the dollar-yen goes a little bit lower and then turns around by midweek and starts going back up again. Just keep a close eye on gold contracts. But right now, again, we’re long while above the aforementioned level.
U.S. Dollar versus Canadian Dollar
U.S. Dollar versus Canadian Dollar
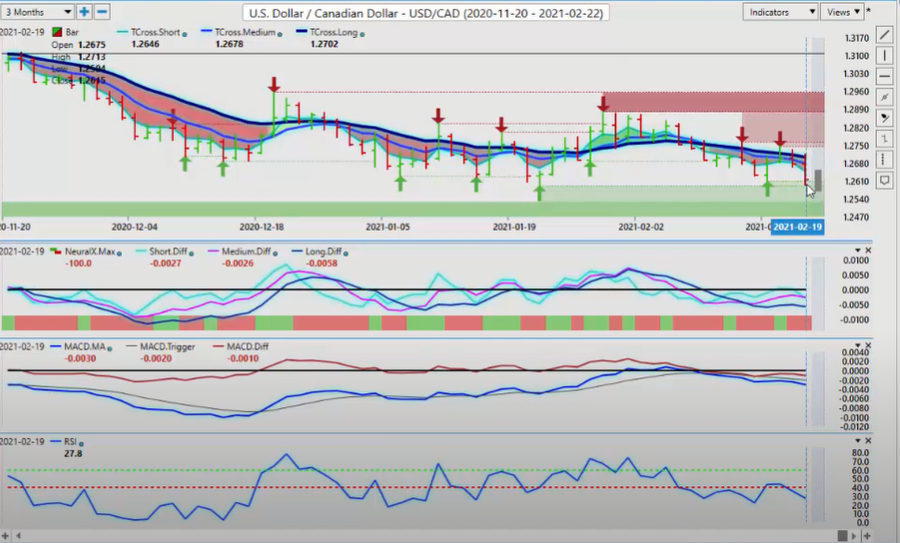
When we look at the US-Canadian pair, now once again, a pretty horrible numbers coming out of Canada on the retail sales. This is where it can get very confusing for most, because anybody who lives in Canada knows that the government in Canada is just the worst we’ve ever seen. There is no budget.
The debt is mounting. There’s a lot of stuff going on. Probably a spring election. What US-Canada, Aussie-US, and New Zealand-US are really running on is the correlation to the S&P 500. So if the S&P 500 turns around next week, this one could consider this a premium long trade down at this particular level. Now, when we back this out a little bit, we can see some other additional levels down here to way back here, going back, and that’s around 1.2530, 1.2540. So even if we lose this particular support, right here we’ve got additional very strong support below here.
Australian Dollar versus U.S. Dollar
Australian Dollar versus U.S. Dollar
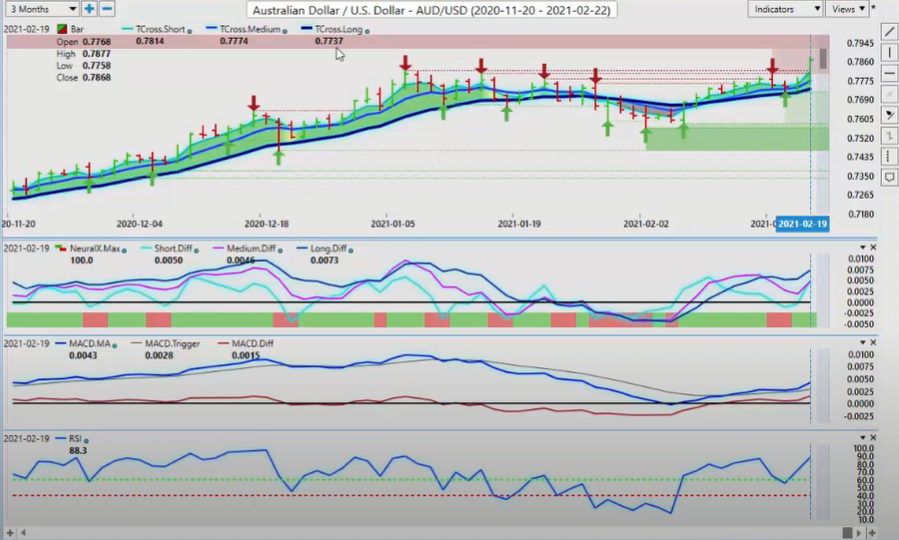
Now, once again, when I look at that particular level right here, that is an interesting one. Sorry about that, guys. We had a minor little glitch in the software there. But again, looking at this particular support level, we can see that very, very clearly on this low at 1.2590. Now, below that level, we’ve got additional verified support down to 1.2530, 1.2540, as I was just saying, that is very, very strong support here. Watch your oil contracts.
Watch your S&P 500. If they start to drop, the Canadian dollar, the Aussie dollar, and the New Zealand dollar will all weaken at that particular time. Because again, if we look at the fundamentals on the US-Canadian pair or the technicals and fundamentals surrounding the Canadian dollar, it doesn’t support a strong Canadian dollar based around economic facts, right? We’ll monitor the situation, but really the S&P 500 is what we need to monitor the most. The Aussie-US and New Zealand-US, the same thing. The Aussie has made a big push.
New Zealand Dollar versus U.S. Dollar
New Zealand Dollar versus U.S. Dollar
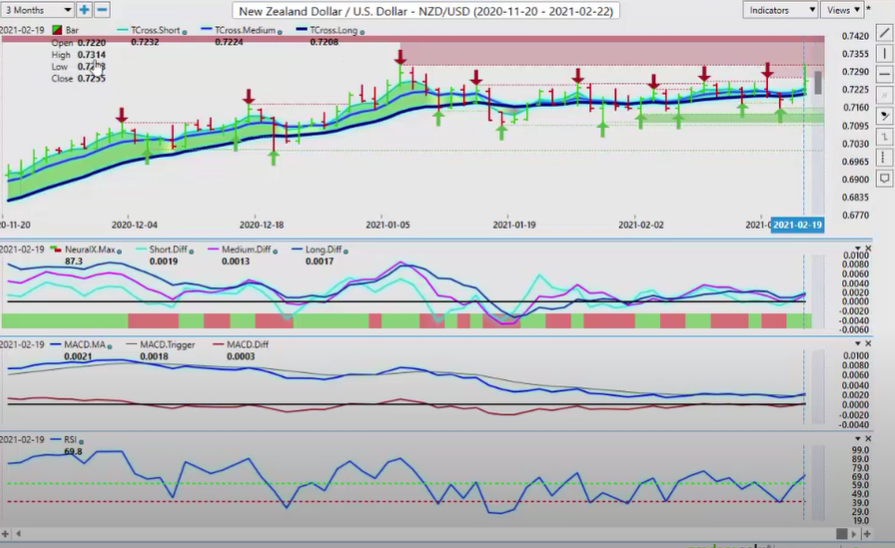
But here’s my concern, we made a big push through a resistance area on a Friday with thin illiquid markets. 90% of the time, 85% of the time, when you have a big move up like this on a Friday, there is zero follow-throughs on the Monday or a little bit of follow-through and then a violent reversal. Be very cautious of this. Now, the VantagePoint T cross long .7737. So the further we move away from this, the more likely it is we’re going to retrace to it.
So again, our indicators are still bullish, but my concern is this move up that we’ve seen on Friday, and an even bigger move on New Zealand. Now, to VantagePoint’s credit here, you can see that we’ve closed above. Thursday we’ve closed above the T cross long and the long-predicted, and then very much like a springboard, this thing shot up on Friday. But the problem is, we went all the way from .7208 to a high of .7314. That is an extremely large move for this particular pair on a single-day basis of over a hundred pips.
So be careful because, again, we’ve got very strong verified resistance at .7315. The way that I would play this with all due respect is I would still be leaning towards the short side, but I would have by limit orders ready to go around the 7355 mark. So with that said, this is the VantagePoint AI Market Outlook for the week of February the 22nd, 2021.
Are you using A.I. yet?


