


VantagePoint AI Market Outlook for the Week of January 11, 2021
VIDEO TRANSCRIPT
U.S. Dollar Index
Hello, everyone, and welcome back. My name is Greg Firman, and this is the VantagePoint AI Market Outlook for the week of January the 11th, 2021.
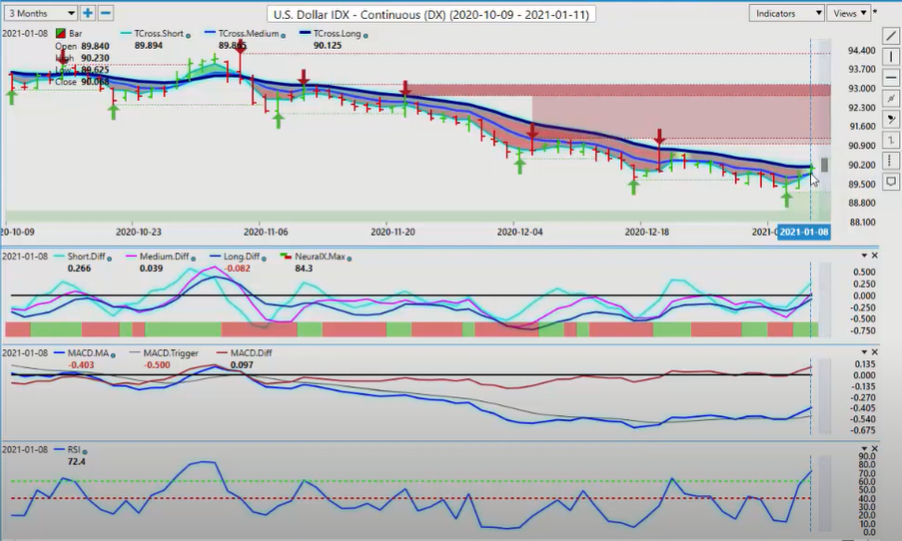
Now, to get started again this week, we’re going to begin where we always do with that very, very important US Dollar Index. And we can see that the dollar is on the move, as suggested. In most cases, the dollar shows signs of strength around the beginning of the month. Now, the million dollar question here now is can we break through this VP level?
U.S. Dollar Index
The best way to look at this is by using these VantagePoint key levels as pivots. Now, what I mean by a pivot, specifically, is something that’s not a crossover. It’s not a moving target. It’s stationary. It’s sitting there. We can see it, and we can identify it. That level is 90.12. If we can break above this level and close above this level, then we have a real shot at going after the most recent high which will come in at 90.95. If we can break through that level, then the pressure, the immediate pressure would be off the downside on the dollar.
When we look at the additional indicators here, our medium-term crossing, our long-term predicted difference with the Neural Index. This occurred on Thursday. We’ve got our predicted MACD has crossed our trigger, and it’s moving higher. We broke above 50, and we’ve broke above 60 on the predicted RSI.
Now all of this, despite the events of this past week on Wednesday, I cannot guarantee if there will be further problems if impeachment is even suggested. I’m not even going to touch on that in this particular webinar. I’m just simply saying that prior to the market open, not after, that this is where we currently sit. We must break through this particular level at the 90.12 area.
Now, when we click on our predicted moving average by itself, we have a two-day break of this predicted moving average. That key pivot area now is 89.86, and we are closing above that key level. Everything on here is pointing towards dollar strength. Now the unemployment number on Friday, once again, the media’s spinning this a little bit, that the U6 number is moving again. The U6 number is moving in the right direction which is down.
So this is, in my respectful opinion, why the unemployment rate did not go up. It stayed flat because the U6 number’s showing underlying strength. So again, the headline number, the U3 number is not really how we’re going to gauge the employment situation in the US. So at the current time, we have a rather bullish setup.
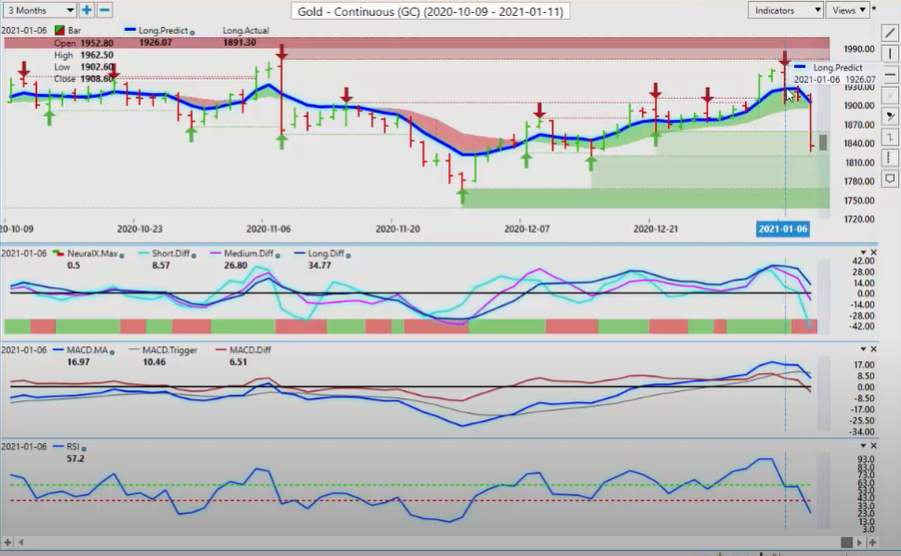
Now, at the same time, we can see on this dollar strength, the gold bulls are basically running for the hills here. We’ve had a considerable sell-off. Now again, with the events of this past week, and if things are not settled yet, why would gold be going lower and not higher is the million-dollar question. So again, looking at those signals on the Dollar Index and identifying the inter-market correlation, and it explains that basically, the gold bulls are getting very, very nervous up here and by the looks of it, what I would say is that they’re bailing out.
Now, once again, we started to get pressure here all the way back on January the 5th. This didn’t happen overnight, guys, the medium-term crossing the long-term predicted difference. But when the Neural Index went from green to red, this move accelerated before, not after this happened. Now again, when we look at this signal coming here, it was a pretty significant move. When we broke down below the 50 level on the predicted RSI, we saw a bigger move. When we lost the 60 level on the RSI, then we had a very significant downward move.
So we do have verified support coming in at two levels, 1820, and an additional level at the low of 1767. In my respectful opinion, if we break through 1767, we would see, more or less, a complete trend reversal on gold for the year, and gold would decouple itself from the S&P 500. I will point out that since the COVID virus came into play here almost a year ago, that is when gold started to correlate itself to the S&P 500.
S&P 500 Index
S&P 500 Index
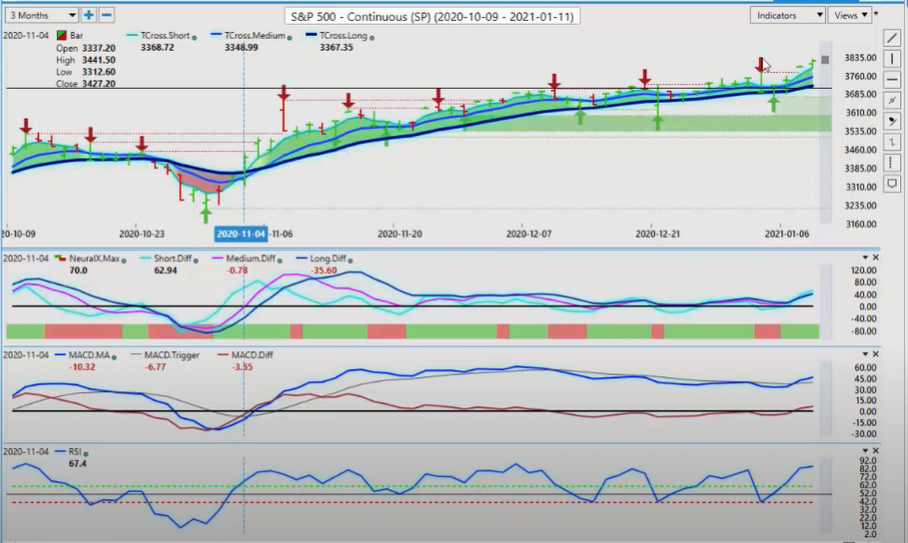
So with the vaccine and everything else, maybe things will change here. I’m not sure. But what I’m seeing at least for now is that the stock market, the S&P 500, as we can see, a fantastic call here, I might add, by VantagePoint on this particular move, shockingly, I will admit. This move started back on November the 4th, but it continues to advance.
Gold
GOLD
And what I like about this particular move is that the dollar is starting to advance with it, and gold is not. So there’s a slight bias for further upside on the S&P, and a slight bias for further downside on gold based around this, once we get confirmation of this decoupling of that particular correlation. So when we look at it right now, most of the signals are pointing that we’re going higher, predicted MACD, the predicted differences are actually a little mixed, but the Neural Index looks good.
The predicted RSI obviously is overbought, but once again, most oscillator signals based on overbought, oversold not the most reliable. We want to look at the inter-market correlations and the underlying factors that are actually driving these markets, not indicators from 30 years ago. That’s a little tough to… in these types of market conditions, momentum-based, algorithmic, quant programs, they don’t care about indicators like that, guys. They really do follow momentum and inter-market correlations and breakouts for that matter also. So for now, equities are still looking fairly strong.
Now equities have pulled oil back up with it also, but again, if there’s any kind of risk-off scenario next week, then we could have problems with both oil and the S&P. That is a clear wild card that is out of my control here, guys. If things heat up again in the US next week, then the environment could turn to risk-off very, very quickly. So exercise caution with longs on either oil or the S&P, but always remember, it’s virtually the same trade.
Bitcoin
Bitcoin
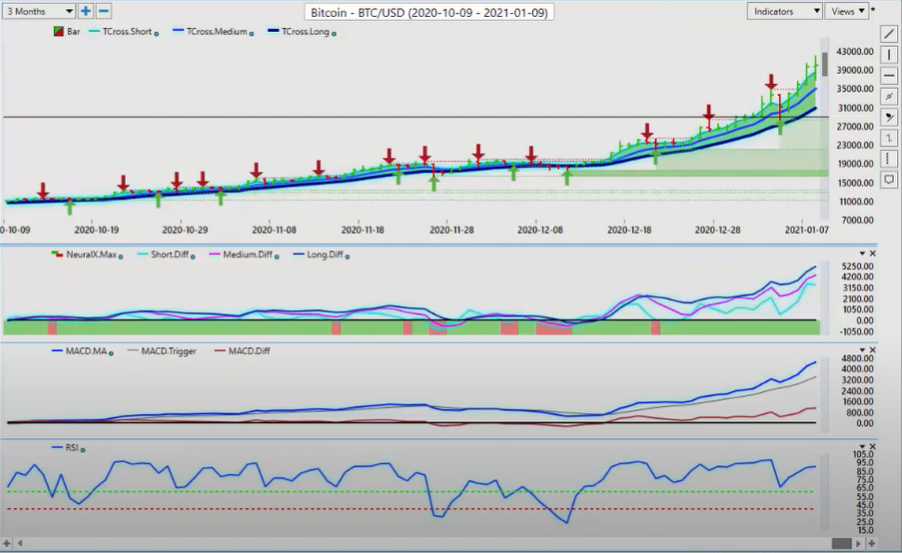
Now my year-end forecast, my forecast that I’ve made in the VantagePoint Live Trading Room and here on the VantagePoint AI YouTube channel for Bitcoin was 40,000. I made that call back in, you know what, I think it was November and early parts of December. So this is a little concerning here, to me, that we’ve made this kind of move. I’ve already hit my target for the year in less than six days.
In my respectful opinion only, I feel that this has gone too far, too fast. We’ve seen JPMorgan come out, and they’re calling for 146,000 on Bitcoin. Well, the only thing I will say in regards to that, and I’ve received a lot of emails about that, the particular point from JPMorgan, I will remind everybody that these are the same people that told us not to buy Bitcoin. These were the same people back in 2007, 2008 that were telling us oil is going to go to $200 a barrel. Shortly thereafter, it went to $32 a barrel.
So again, be very, very cautious listening to some of these talking heads. We’ve made a very big move on Bitcoin. And the real bulls have been bullish on this for a considerable period of time, looking at the historical values and where this thing is traded. As I’ve mentioned many times before that Bitcoin has doubled every year for the last 10 years. Well, we’ve already doubled this year, guys.
So I think a pullback is in order here. There’s panic-frenzy buying that’s a combination of shorts being closed and new longs coming into the market, but it’s going to basically settle out. So the key pivot area… I can’t believe I’m saying this. 30,825, the key VP level. When we click on our F8, our main pivot area, watch this area very, very closely this week, guys. That’s my advice. 36,080. If we start breaking down and closing below that level, you’re likely going to see a round of profit-taking sending it lower.
So again, watch for that break. We are grossly over. We’ve been on… this is the easiest point I can make when we’re talking about oscillator-based trading, accumulation distribution. This has gone into an overbought condition at the very start of this rally. And a lot of the market pundits had said, “We’re overbought. Bitcoin’s going to have a corrective move.”
But when you look at the charts closer, you can see that this 19,000 is not 19… what was the exact level on that? Let me get it for you here. 19,908 is not your average level here, guys. That’s a breakout point. So again, when you’ve got an overbought condition, the path of least resistance on a break of that is to the upside, looking at something and saying, “It’s overbought. Stop going higher. I’m telling you, please stop going higher because this indicator says you’re overbought.”
Do we really think that anybody in the market is listening to that? Trust me, they’re not. They’re algorithmic systems. Quant programs have just all gone off at once, and they’re all entering long, right? Just remember that those same systems are going to be getting a little nervous up here, so my advice is keep an eye on these critical VantagePoint levels very, very closely to see if we can hold above them.
Euro versus U.S. Dollar
Euro versus U.S. Dollar
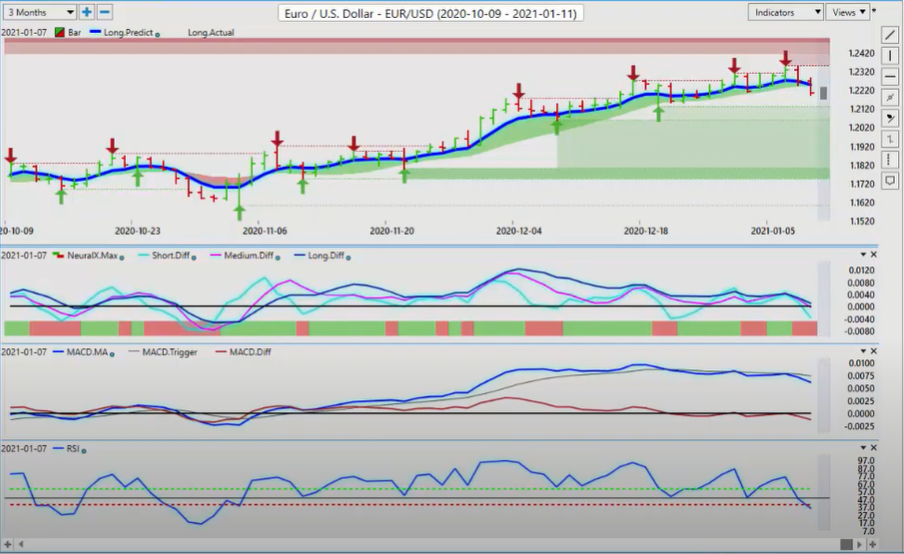
Now, as we get started in some of our 4X pairs for this coming week, the Euro in trouble again, but it’s paused right on the key VP level, the T cross long. Again, this is not a moving target, guys. It’s updated each night, but the market is drawn to this area like a moth to a flame. 122.11. You can see that we’re closing just a hair below that.
Now the real setup here comes back here, guys, okay? So we click on our F8, and we can see that the market is pressuring the blue line, the predicted moving average. As soon as it crossed below it, with the Neural Index and the predicted MACD and the RSI broke down below 50, that’s when it started accelerating to the downside.
But let me be clear. The inter-market correlation that is going to drive the Euro is not going to be Bitcoin. It’s going to be the Dollar Index and more specifically, it’s going to be gold. This is the main reason that the Euro had a big move lower. When you look at these two charts side by side, they are virtually identical. If I click on the F8, this was the trigger warning me. And again, the talking heads and pundits are all saying the Euro’s going to 125. Maybe it is, guys, but it ain’t going to be this week.
So let’s… when we look at our charts more closely, this is a classic signal using the VantagePoint software. We break down and close below the predicted moving average. The very next day, we come up to the predicted moving average, hit it to the exact number, and then the real move shows itself. Down it goes.
This is a clear way of showing that VP was at least three days in front of this move on gold moving lower when you’re looking at the correct indicators. As soon as the Neural Index came on board, down it went, but that again, provides several other trading opportunities for us that tells us that we’ve got the green light to buy US dollars.
So whether we can maintain that going into next week, we need to see the Euro break down below 122 and stay below it. There’s plenty of room for this thing to move. The only issue I have is is that predominantly the dollar has weakened on the Tuesday after the nonfarm payroll number, whether it be a good number or a bad number. So keep that in mind in your trading.
British Pound versus U.S. Dollar
British Pound versus U.S. Dollar
The pound dollar also, again, under pressure. When we look at the Dollar Index as a main analysis tool with gold, oil, S&P 500, and Bitcoin, we get a real feel for the market. Is it possible that Bitcoin and the US dollar can go up and down together, or is a more likely scenario that Bitcoin is getting ready for a major retracement, and it’s the dollar’s turn to have a little run. That’s a scenario coming up next week that very well could come to fruition.
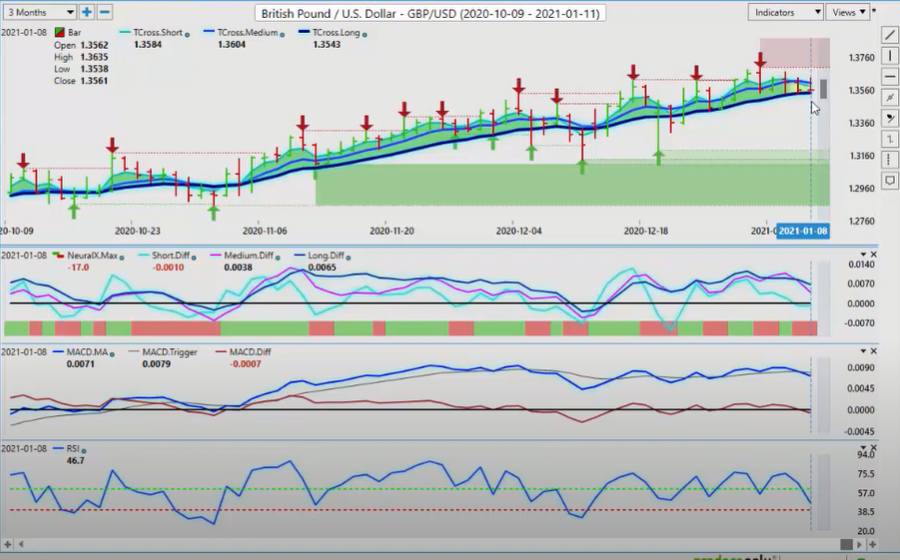
So keep your eye on the prize here, guys, okay? The key pivot area, 135.43. We want to watch this area very closely. If we break through on here on the pound and again, the same setup is there. The medium-term crossing, the long-term predicted difference. The Neural Index is down. MACD is crossing down. We don’t have the kind of momentum on the pound dollar, however, that we’re looking for. And again, I had talked about this in the Live Trading Room. I think we’re going to see a separation of these two pairs, Euro, US, and pound dollar. Over the many years that I’ve traded the 4X market, over 20 years, they go up and down together. We’re seeing something very different now after Brexit. The Euro is strong, or the pound is strong.
They’re not necessarily both strong at the same time because of dollar weakness, so keep that… again, always remember that. When we click on our F8, once again, there is the two-day close below that blue line. If anything, I would argue that this is warning in this particular setup to start the week 136.07. Any slight move above there is likely a decent area to look for shorts and a bigger move… excuse me, to the downside is likely it.
Now, nothing’s 100%. We could see a further bout of dollar weakness if we get into the whole impeachment stuff and all that stuff and all of this… again, I’m not going down that particular road here today. I’m just pointing it out that there could be some more volatility in the cards here, okay? So when we look at this closely, that’s what we want to see. Can we hold and close below 136.07? Is a bigger move coming. Well, we’ve got to break through the two aforementioned levels.
U.S. Dollar versus Japanese Yen
U.S. Dollar versus Japanese Yen
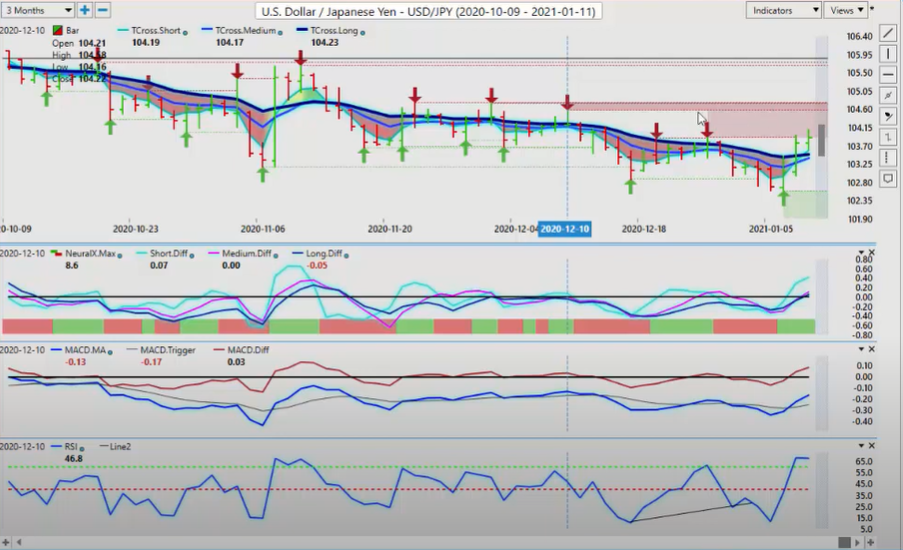
Now with the dollar yen, going into next week, the dollar yen is again… it’s a strange animal, but again, there is a buy signal forming. Now we would have to maintain the risk-on environment for this to remain bullish, but again, we’re coming up into some pretty stiff resistance. And what I would like to see here, guys, is [inaudible 00:15:47] to close above the verified resistance. Get above 104 and stay above it, so we can start pushing our way up towards the 104.50, but we’ve got a lot of resistance in this particular area that’s being identified using the verified zones.
So once again, we’ve got a few different levels here that we’re dealing with, but if we can break through and stay above right now, at least for now, it looks pretty good. The RSI is moving up. We’ve got the MACD is crossing over. Our Neural Index is in full support on this move, going back to January the 6th where we got the first signal from the Neural Index and the predicted difference cross.
So again, it looks quite good for longs. When we click on our F8, we want to look at that key VP level. And that level is coming in at 103.42. I will respectfully submit that if we can hold above 103.42, or if we re-trace back to it on Monday that we could have a pretty decent buying opportunity. So when we utilize the VantagePoint predicted highs and lows, the predicted low is at the same level as the predicted moving average. They’re both sitting around 103.45. This area is where we would look for long, so easy peasy, right? That’s the way we would look at it. Let the market come to us.
I’ll highlight that with a line and put it right in there. So in that predicted moving average and the predicted low of the day, then right now, this is saying number one, we want to be buyers. And number two, we want to let the market come to us to that very specific level or as close to it as possible before we even think about pulling the trigger on that.
U.S. Dollar versus Canadian Dollar
U.S. Dollar versus Canadian Dollar
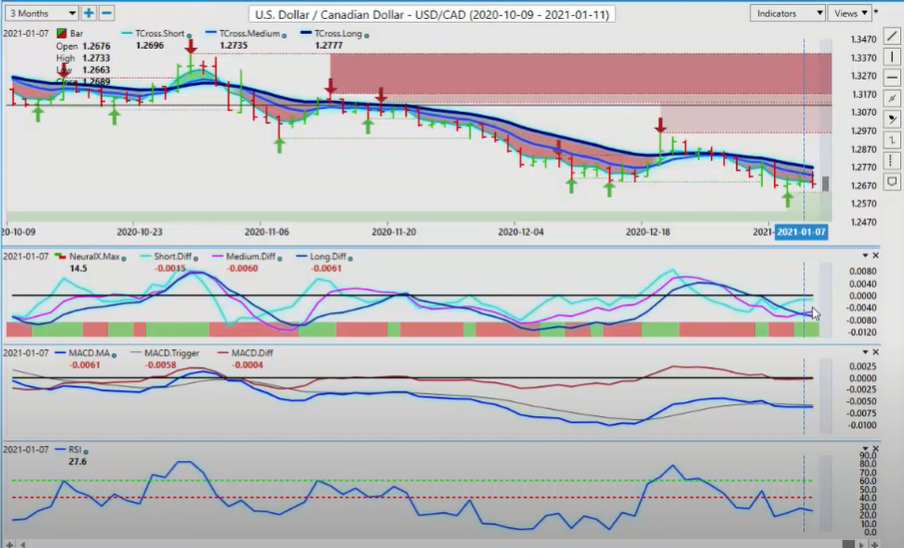
Now, when we look at some of our main equity-based currencies, starting with the US CAD, once again, the Canadian unemployment report was pretty horrible. On Friday, the US one wasn’t too bad. We can see we have a classic buy signal here from VP, and it’s starting right now, guys, okay? And this is being recorded on Saturday afternoon before the market’s even opening because again, this is an outlook, not a recap of something that already happened.
When we look at this and we utilize our VantagePoint software, I will argue that the medium-term trend is weakening against the longer-term trend. The longer-term trend is clearly down, but the medium-term pink line is saying, “Look, we’re starting to see some early signs of strength in this particular payer, not any further weakness.” So we would look to see if there’s a potential long here.
So once again, our key level that we have to close above is 127.66. We’re very close to that now. But when we click on our predicted moving average by itself, we can really get close to the flame, so to speak, here, 127.03. If we can close above that level, one, or preferably two days in a row, then that was likely going to set off some dollar-buying on this particular pair.
So again, we’ve got our medium-term crossing, our long-term predicted difference. Neural Index is positive. We certainly don’t have a lot of upward momentum with the predicted RSI, but there’s something there. So that’s, better than nothing, right? We’ve got a few early signs that the Canadian dollar is going to weaken.
Now, respecting the fact that I’m domiciled in Canada, I can tell you that Canada is a mess right now. We’ve got about 3 to 4,000 new cases of COVID per day in the state of Ontario. So, this is not going to bode well. The prime minister here in Canada was supposed to run a $14 billion deficit. It just came in at about 410 billion, a disaster of a budget. So, I don’t disagree that the Fed is printing money, but trust me guys, he’s only one of many central banks that has got the printing presses on high alert.
So again, nothing I just said benefits the Canadian dollar, but the Canadian dollar will continue to hold strength if based around oil and the S&P 500, but it also needs gold moving higher. So if gold can’t recover, it’s unlikely that the Canadian dollar will either.
Australian Dollar versus U.S. Dollar
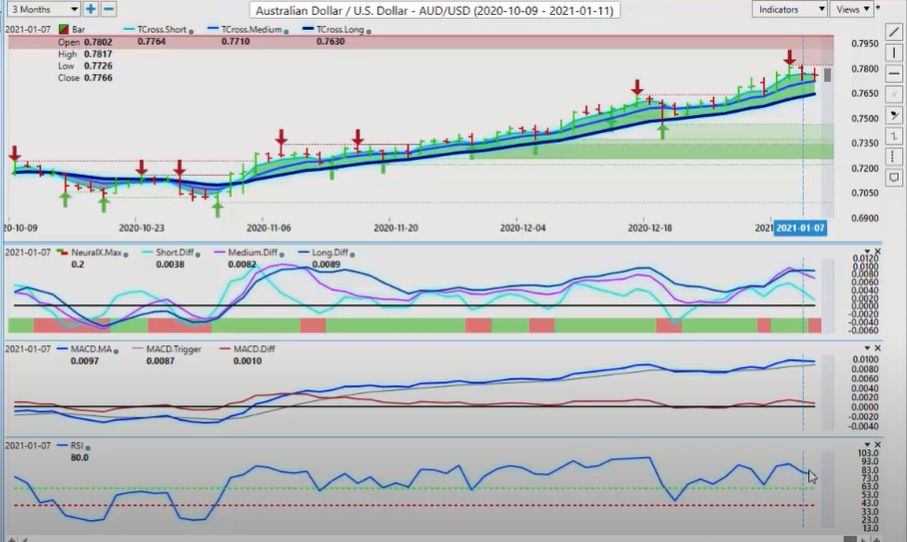
Australian Dollar versus U.S. Dollar
The same would apply for the Aussie-US and the New Zealand-US going into next week’s trading. We can see that we’re getting a little toppy up here. A freshly formed, verified resistance is now formed at that high, 78.19. So again, you can see the classic signal, and this is happening right now before the market opens. We’ve got our medium-term crossing, our long-term predicted difference with the Neural Index. Again, our RSI is not in the perfect position for shorts, though. So again, that’s why we watch, right? And then we click on our F8. So the F8, the predicted moving average, by itself, gives you that edge in the market, 77.41. If we start breaking down below 77.41, then in my respectful opinion only, there’s an 80% probability that we’re going lower.
New Zealand Dollar versus U.S. Dollar
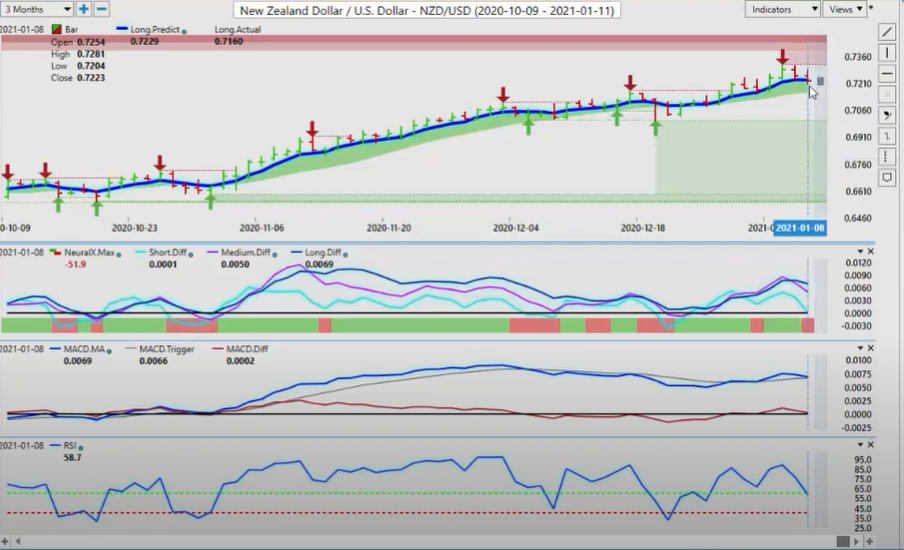
New Zealand Dollar versus U.S. Dollar
When we look at New Zealand, we’re going to probably see the and we do see the exact same setup. The two payers are almost identical. The key level there is coming in at 71.62. So that’s a downside target for at least short-term sell orders. When we click on our F8, we’re closing below the blue line. So again, only in my respectful opinion, if I’m picking between these, obviously I like US-Canada longs, and I give Aussie-US… Aussie-US is a little bit better shape than New Zealand. So if one of these is going to break down first, it’s likely going to be, looking at the VP charts, it’s likely going to be the New Zealand dollar that goes first. The Aussie may hold onto its value a little bit longer, but either way throughout the VantagePoint software, I’m seeing a theme here, but you’ll also remember what I said in last week’s presentation that we’re going to see that we’re not going to see the real price show itself until the week of the 11th. That’s next week, so by Wednesday of this coming week, we’re going to see probably some new trends form here, likely in Bitcoin, in the S&P, in oil, gold, and a number of different F4 pairs.
So with that said, this is the VantagePoint AI Market Outlook for the week of January the 11th, 2021.
Are you using A.I. yet?


