


VantagePoint AI Market Outlook for the Week of January 18, 2021
VIDEO TRANSCRIPT
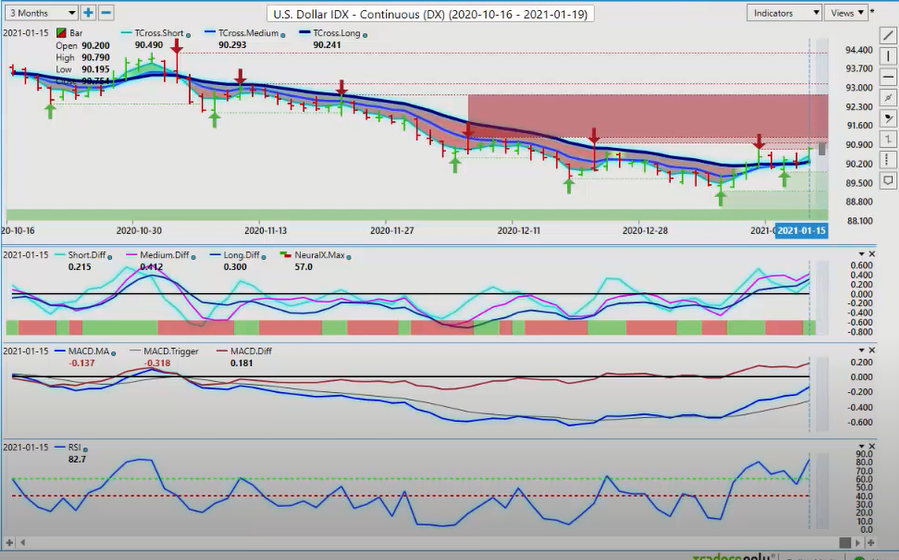
U.S. Dollar Index
Hello, everyone and welcome back. My name is Greg Firman, and this is the VantagePoint AI Market Outlook for the week of January the 18th, 2021. Now, to get started this week, we’re going to begin where we always do with that very important US dollar index that is playing a huge role in our Forex trading, equity trading, and commodity trading. All of these markets, the dollar is affecting.
Now, when we talked briefly about this over the last several weeks, we know we have a dollar cycle at the beginning of, usually between the 29th of the end of the month and up until about the eighth or ninth of the new month. So this happens about 85% of the time where the dollar has a short period of strength, and then usually it backs off a little bit.
U.S. Dollar Index
So my concern here going into next week’s trading, number one is that we have a holiday on… I believe it’s a bank holiday in the US with the Martin Luther King Day. So watch out for thin illiquid markets there. We’ve had a pretty strong rally in the dollar index, but not off a very good news. The retail sales numbers were not great out of the US. Let’s just say that. But things are calming down a little bit in the US by the looks of things.
Right now, when we look at it, we’ve got our RSI that is a little bit overbought, but not too bad. Our predicted MACD, still below the zero line, which is concerning our predicted differences are still pointing higher here. Now, our key level, as I talked about in the last week’s video weekly outlook, we need to break through this level here, guys. If the dollar has any real chance of going higher we’ve got a couple of critical areas that we must get through. If not the dollar will continue at slide.
Now, that level is coming in at or about the 90, 95 level. And then another very large resistance here at 91.17 using the verified support and resistance tool. Now, you can also notice the coloring here. We have a light shade of pink, and then we go into a hard red color here. That’s warning that this is very, very stiff resistance up here.
So I’m somewhat optimistic that we can push through that, but it may not be next week. So we look at our key levels on the downside, not just the upside. Our T cross long 90.24 on the downside. When we click on our F8, very important here, guys, that we hold above 90.32. Now, again, we can see all the market is moved above the VantagePoint predicted moving average. We use this as a pivot area to tell us whether if it’s above it, it’s bullish, below it, it’s bearish.
So we’re holding above this, but again, we really do need to watch going forward next week to see if the RSI can hold its momentum here, if we can advance on the predicted differences. And of course, keep a very close eye on the neural index because it’s a very good shorter term indicator to warn us when the market potentially could be getting ready to turn, and of course, breaking through that resistance.
Gold
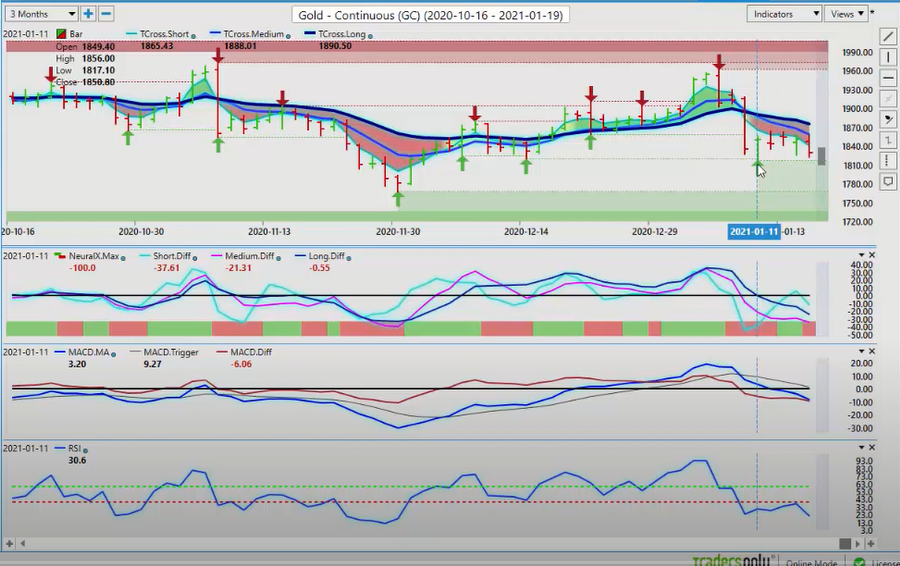
GOLD
Now, to the benefit of the dollar, gold continues to slide. This absolutely helps the dollar, but we can also see we’ve got verified support forming at the low at 1817. We would look for that, if we believe the dollar is going to weaken, then gold must rebound here. So watch the 1817 level very closely. We still have room to extend on the predicted RSI, the predicted MACD and the predicted differences all have room to extend lower.
Not a lot of demand for gold, but there certainly does seem to be a lot of demand still for Bitcoin, which we’ll talk in a moment. But for now, once again, while we’re below 1875 the primary trend for the calendar year 2021 remains down. When we click on our F8 and identify our main pivot area, you can see that we came right up to that key vantage point level at 1857 on Friday only to get violently rejected off of that level. Very, very sharp move off of there. But again, just remember, guys, the market is a two-way street here. We’ve got support below and resistance above, but the indicators are pointing towards further losses in gold next week.
S&P 500 Index
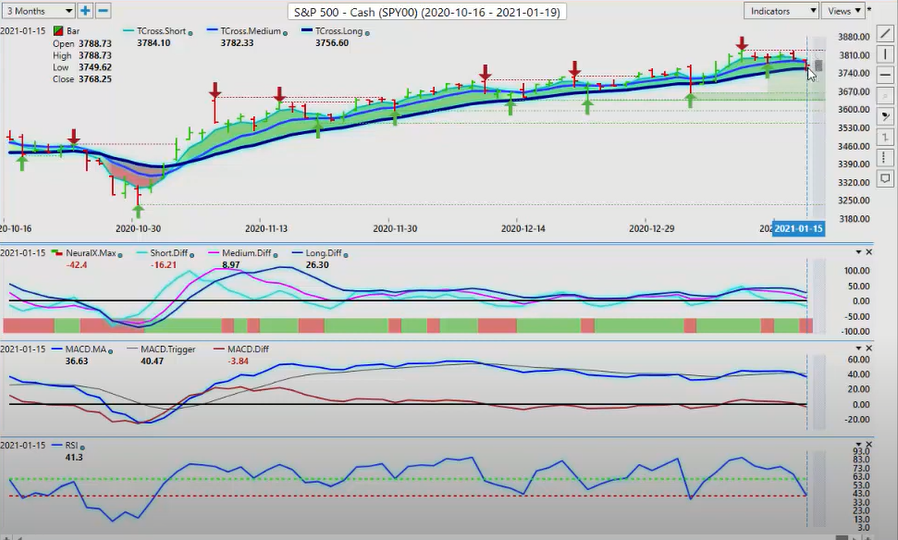
S&P 500 Index
One of the things that’s really driving this is the equity markets. Now, we had a sell off on Friday, but it didn’t really start, you can see here on Friday. It was building throughout the week. We had our medium term crossing our longterm predicted back here on January the 11th, actually. And we’ve really been stuck. Once we put in that verified resistance up here at the high of 3826. We had a lot of pundits that were calling for 4,200. The S&P is just going to go higher. And that very well may be.
Now, my concern with this bit of a sell-off here on Friday is that it is a holiday long weekend in the US and a lot of times you will see profit taking, going into that only for the same people that close those long trades. They’re looking to pick them back up again. So I’m looking at very closely the predicted MACD, but our RSI is not breaking down below 40.
The reason why we want to use a 60/40 split on the RSI is we’re looking for momentum here. And not an overbought or oversold signal, but momentum of is it building to the downside? So right now, our key T cross long 3756, this is a very important level here guys, because that’s also the yearly opening price. So again, we can’t really say the S&P 500 is bullish if we’re not profitable on the year. Just a side note there.
So we want to watch this level very, very closely. If we can close below 3755 for a couple of days in a row, then that would point to further losses likely pushing us back down into the lower 3662 area. But my optimism on that remains heavily guarded right now. You’ve got a stimulus package coming out from the president-elect that I think will boost the stocks. The fed is still very dovish up from the interest rate side. All of these things support the S&P 500.
So be cautious about jumping on shorts here. It would be my specific advice there. Because we know that whenever the S&P has moved lower, it’s usually somebody has helped it recover very quickly, I might add.
Bitcoin
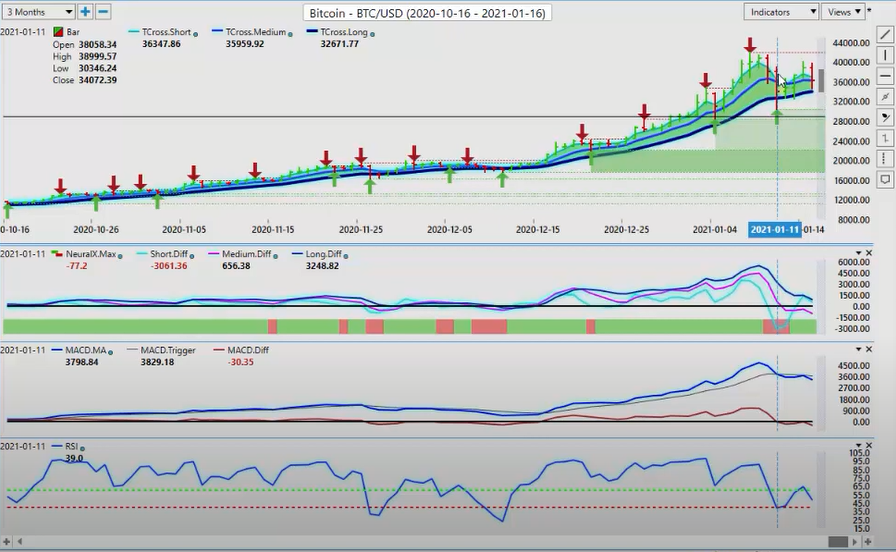
Bitcoin
The other one we’ve got here is of course, Bitcoin. All eyes on the market are on Bitcoin here, guys. Now, in my respectful opinion, as long as we’re above 29,000, then Bitcoin still remains very bullish.
We had a couple of very violent moves, particularly on Monday. And just remember here, guys, this is why we kind of, in some degree, want to turn the TV off here because the same people that were telling us that Bitcoin was going to 146,000, those are the same people that told us not to buy Bitcoin in the first place. Now, those same people are saying that Bitcoin could be a bubble. Confused yet? I certainly am.
So again, let’s look and know our levels. If we know our levels, then we can make our own decisions on this trade. We’ve come down on a very choppy open trade here on Monday, but then we’ve recovered closed back up above the key VP level here. And then we bounced off of it twice only to extend higher. Now, I believe that 40,000 is 41,933 as the new high. Again, as going back into December video weekly outlooks on here. I’ve made the call for 2021 at 40,000.
I made that basically in the second week of December. But my concern remains here that, again, the markets are only trending 20% of the time. So we know where our top is, and in my respectful opinion, we know where the bottom is down at 20,000. So Bitcoin has already doubled in the year, but it is still predominantly bullish here, guys.
The indicators are a little soft, but you can see that we don’t have any downside momentum, and that’s the one we want to watch. Now, if the US dollar does continue to rally, that will help push Bitcoin back down again. But again, we want to watch that 29,000 mark very closely. And I don’t see a complete trend reversal on Bitcoin unless we break down below 19,000.
Now, it has been very, very volatile, a very, very choppy week in Bitcoin, moving anywhere from three to 6,000 a day. So like any other new investment here, guys, things will settle. But as I’ve stated originally going back several years, when they were calling it Warren Buffett, and a lot of these people were really bad mouthing and bashing Bitcoin. But I brought up the points that Bitcoin has doubled every year for the last 10 years.
So any competent investor would notice that and would say, “Well, if Bitcoin is such a bad investment, then how come it keeps doing so well?” So a lot of times this is what we get from some of the people like Goldman Sachs, JP Morgan Chase. They tend to get us going the wrong way. So just remember that, that maybe they’re not exactly accurate on their forecasts or maybe they’re already long Bitcoin and they just don’t want us in it. But again, flip-flopping back and forth between Bitcoin’s a scam, then we go on to Bitcoin, 146,000 only for them to turn around and say now that Bitcoin is a bubble. I’m just not buying that, guys. We watch our key levels. If it holds above the key vantage point level, then we will continue to buy even at these particular levels.
Crude Oil
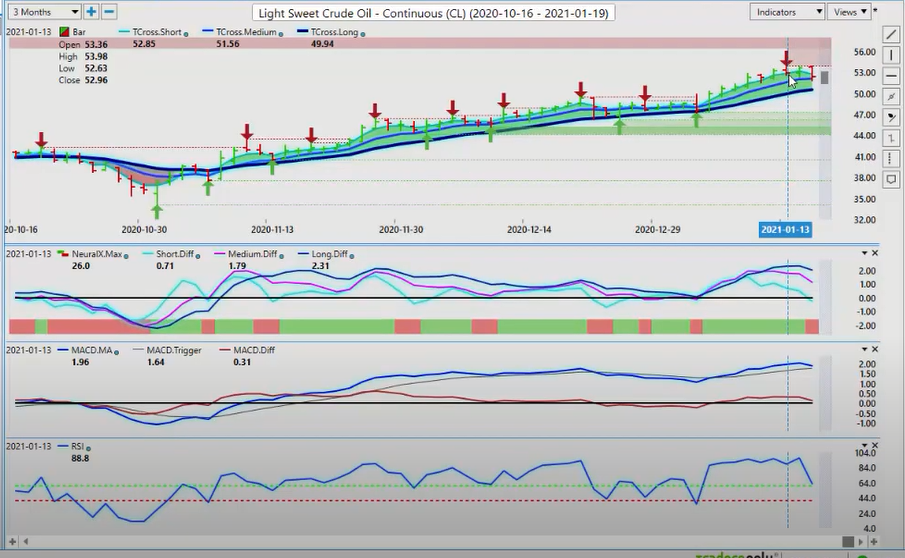
Crude Oil
Now, when we look going into the week two, oil also is in the forefront. Now, both the oil and light sweet crude, this is the main oil that I watch, WTI. You’ve got all those other ones. But light sweet crude is how I personally gauge oil. You do it however you like. That’s up to you. When we look at this right now, you can see that we’ve got resistance on oil here at 53.98. Now, once again, the lockdown seemed to be in full force like Germany, the UK, Canada.
I’m not sure about Australia and New Zealand. You guys would have to chime in on that one. I don’t know what’s going on over there with it, but a lot of these major G7 countries are going into lockdown. Now, this happened last year in March. That sent oil considerably lower from almost this exact same level here. So if we look at that from last year, we simply take our charts, go back one year ago, oil was already starting to slide on a bit of a seasonality in January. But then it accelerated with the COVID lockdown.
So again, these lockdowns seem to be coming back into play again in a number of different places. And that could have, again, a very negative effect on oil. But oil right now is following the S&P 500. That’s what we need to watch. Now again, when we look at our main indicators here for the week, we can see we’ve got our medium term crossing our longterm predicted difference. The neural index is now gone off from green to red. That’s a warning sign that we’re likely going lower.
Now, if this is a corrective move lower on the S&P 500 an oil, then oil is likely to hit 50.55 next week. But if the S&P 500 turns around here, guys, oil is going to go with it. That much, you can pretty much take to the bank, but again, I can’t be sure how the global economies are going to react to this newest lockdown, to these newest lockdown measures.
Euro versus U.S. Dollar
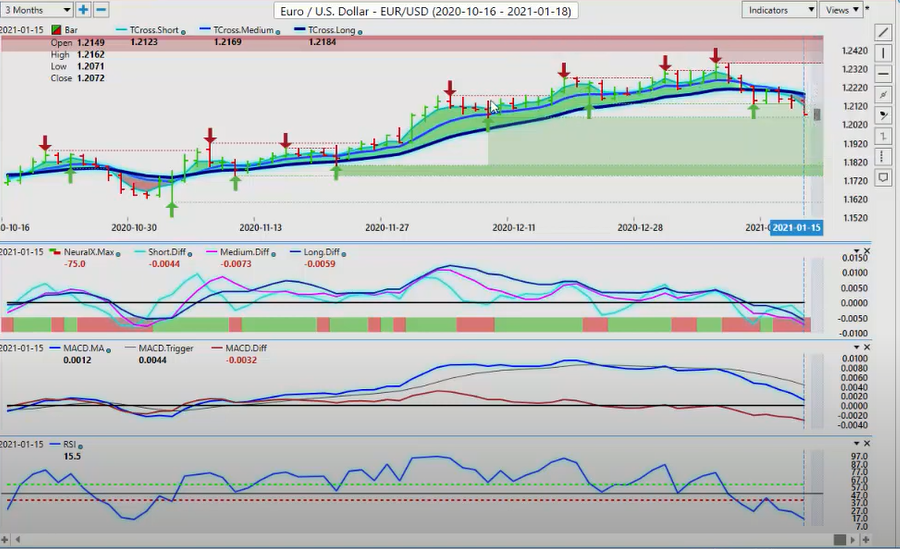
Euro versus U.S. Dollar
Now, as we hit some of our currency pairs, we’re going to do things a little bit different here this week when we talk about some of our equity-based currencies, so we can all what’s going on here. The inner market correlations are very, very powerful guys. This is what I can tell you. Okay? And when everybody is going long Euro/US, they’re basing it on conventional indicators. I’m using inner market correlations. The main inner market correlation that I can advise you to watch if you’re trading the Euro/US whether it be long or short is gold.
Gold is pinned lower. It’s below its yearly opening price. It’s bearish. But we do have some support down there at 1817. We can see a very, very similar support on Euro/US. Now, again, that low is coming in about 2059 and then we have some really big support down here.
But if we break through here, in my respectful opinion, it will be determined by the inner markets. Not necessarily a technical indicator. So again, keep a very, very close eye. If gold continues to slide, the Euro is likely going to follow. Our key resistance now, our T cross long, 1.2184. If we click on our F8, we get our predicted moving average. This is the long-term crossover and I’ve removed the black line.
You can see how the market is in constant contact with this blue line. This provides an excellent entry point for shorts. If it’s above the blue line, it provides an excellent entry point for long. So that’s how we play this. When it crosses over here, I personally prefer two-day rule. I don’t necessarily bite on things until I get the market closing below that blue line two days in a row. And then you can see what the, the likely outcome is.
So for now, keep an eye on 1.2059 and keep a very, very close eye down around the 1.20 area to see where we go from here. Now, once again, the US Swiss Franc. If we’re looking for places of value to potentially buy dollars, we can see that US Swiss Franc is also up against a major resistance area here. This resistance area that’s coming in at the high of 8914. We need to break through this particular area. But for that to happen, we need the dollar index advancing.
U.S. Dollar versus Swiss Franc
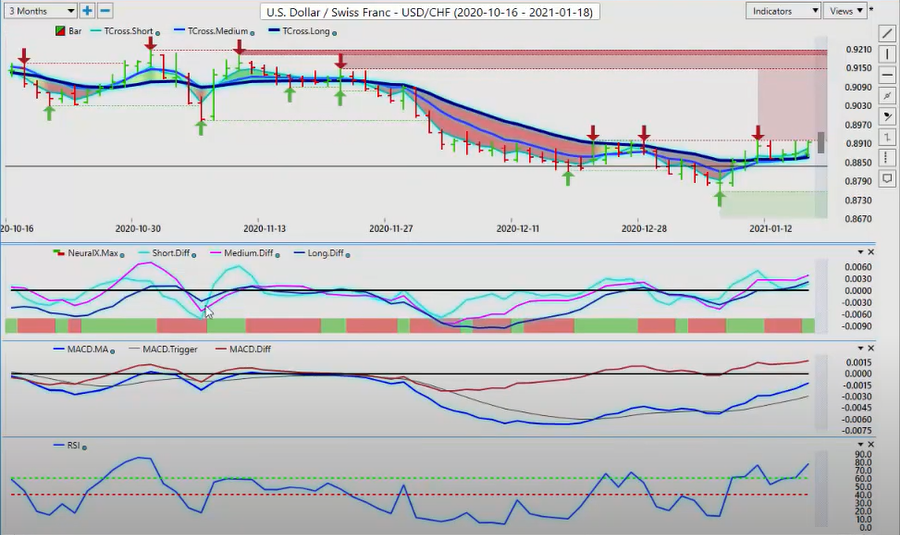
U.S. Dollar versus Swiss Franc
If it can’t advance, the US Swiss Franc will not advance either. These are almost identical charts with the resistance. Right now, the indicators in VantagePoint are saying we do have further upside. Now again, if the US Swiss Franc is going higher, that would indirectly point to tell me that it’s possible, the S&P 500 is a corrective move lower only.
So if that’s the case, well, either way, the US Swiss Franc may be able to benefit from this with a stronger dollar and stronger equity markets. Either one of those or both of those would be a problem for US Swiss Franc shorts. So we’re looking for a breakthrough of this level. If we can get through that level, you can see that we got a real potential shot of running back up towards the next most recent failure point, which was 9147. So we’ll look for that to happen, but if we can’t get through here, guys, then this pair is going to turn around.
British Pound versus U.S. Dollar
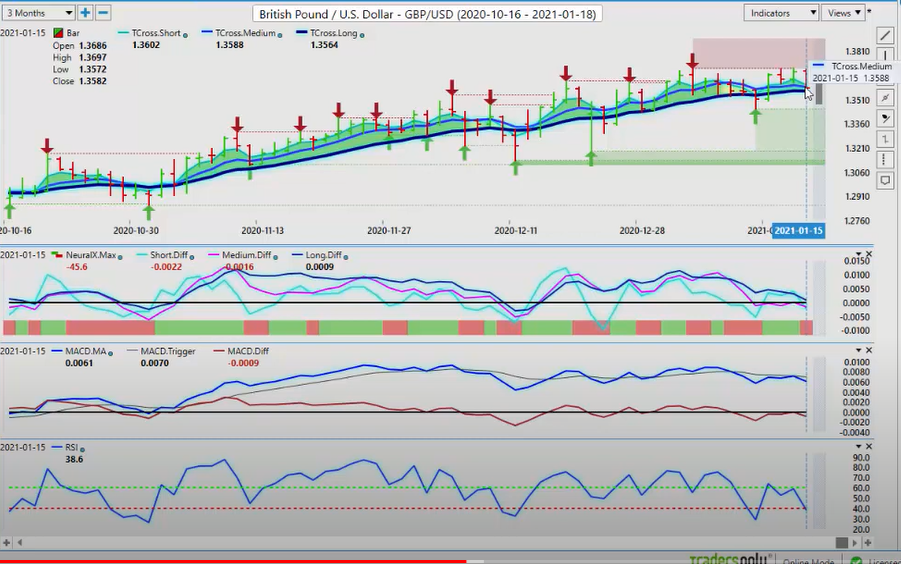
British Pound versus U.S. Dollar
Now with the pound dollar going into next week. Once again, we’re hanging here just on this key vantage point T cross long 1.3564. If we lose this level, we close below this level two days in a row, then that could be it for the pound rally for a little bit here. The pound, very much like Bitcoin. It’s extremely sensitive to any news. So be careful around any economic announcements out of the UK, or the Bank of England, because there are a driving factor here.
Brexit also is still kind of lingering here. They’ve still got to get some trade deals worked out. So that’s both a positive and a negative for the pound. So again, very, very important. When we’re looking at buying a currency let me be very clear about this. We do not just look at standard technical indicators, we look at inner market correlations and we look at basic fundamentals of what is going on in that particular country. This is not a negative or bashing a country or any of that nonsense like one of the ridiculous comments that was put in the comment section last week. This is about identifying whether you want to hold that currency.
When you buy a stock, guys, do you just buy the stock based around because you feel like buying it, or do you look at the balance sheet of the stock? Or do you look at the earnings? Do you look at the company’s holdings? That’s called fundamental analysis. And if there’s negative points about that, then any analyst will bring those up and say, “Okay, well, if you’re buying this, here’s the technical picture and here’s the fundamental picture. If both look good, then you buy that stock.”
Well, currency trading is absolutely no difference. No different whatsoever. You have to identify that. And again, it’s got nothing to do with picking on a country and saying, “Oh, this country is terrible. It’s an awful country.” It has absolutely nothing to do it. You look at the political situation of that particular country, it doesn’t matter what side of the political aisle you’re on, you’re looking at fundamentals. That’s what any economist would look at when buying or selling any given currency.
So right now, the UK is in slightly better shape. Brexit is kind of behind them, but there’s still some issues there. So this is a positive momentum. But if anything changes then that could drive the currency lower very, very quickly. When we look at the dollar yen going into next week, the dollar yen, this is not what I would call a great place to buy or sell this thing. You can see that we are smack dead in the middle of the range. The high of 1.0440 and the low of 1.0259.
We are smack dead in the, not exactly in the middle, but this is not a very favorable area. But right now we can see that based around that sell-off on the S&P 500 on Friday, it kind of turned the VantagePoint indicator down a bit with the neural index. But just remember here, guys, the advice that I’ve given, whether you choose to take it or not, that’s totally up to you, but a lot of times on Friday, that price is not true. It’s profit taking. There’s a whole bunch of things going on there. And oftentimes like rats running off of a sinking ship, once the rats figure out the ship is not sinking, they run right back on it again. Right? So think of it that way, that a lot of those moves on Friday may not continue into next week, right?
So for now, the yen still carries a slight bullish tone to it. My concern is the neural index is very conflicted around here. We’re clinging to that key vantage point level at 1.0365. As long as we can stay above that, it has a chance of moving higher. When we click on our F8, you can see that the waters are a little more muddy here. We’re clinging to this predicted moving average, and we’re struggling at this level. We’re struggling on shorts and we’re struggling on longs. Both sides of this.
So it’s not the greatest one here to focus on trading next week. If we’re looking for places of value to buy dollars, we can’t rule this pair out, but keep a very close eye on the S&P 500. Now, as we go into our three main equity based currencies, we’re going to do this a little bit differently this week, because I get a lot of a number of different emails and comments every week and asked if I could explain what’s going on with these three pairs and how to better trade them, meaning the US CAD, the Aussie US and New Zealand US.
U.S. Dollar versus Canadian Dollar
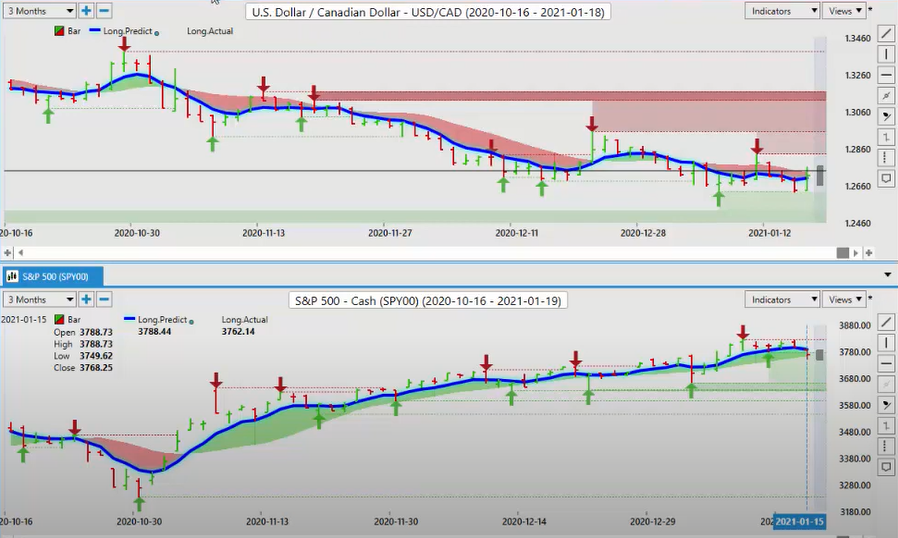
So I’ve set up a little chart here for this week’s weekly outlook, so everybody can kind of understand it a little bit. This is essentially indicator free here, okay? And you can see that I’ve split the screen and I’m going to do all three of these very easily, okay? When we look at the S&P 500, this is intermarket analysis explained by definition. You can split your VantagePoint software and really identify this. So if we look at the Aussie currency here in the S&P 500, these two charts are virtually identical.
So we’ve got a slip below our blue line rate here. And again, that’s because the S&P 500 slipped below there. So if you strip 80% of your indicators off your chart and just understand this inner market correlation, then you have an edge over the market here, guys. So again, if we believe that the S&P 500 is just simply corrective in nature, then if it recovers, it will pull the Aussie back up with it. The same thing will happen with the New Zealand. You can see that these two charts are virtually identical.
So then if we look at the US Canadian pair, and we want to know how to trade that, you can see that the US dollar is no longer the quote currency. It’s the base currency.
Australian Dollar versus U.S. Dollar
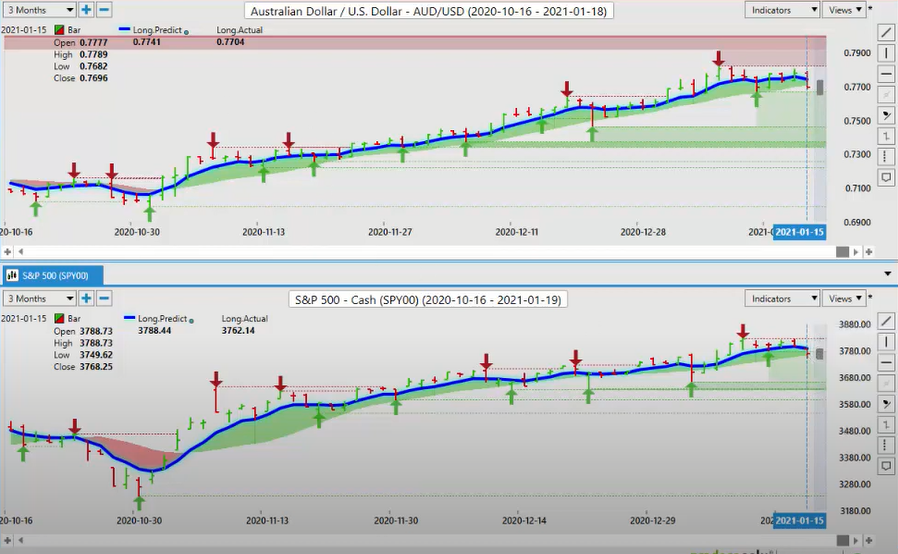
Australian Dollar versus U.S. Dollar
The US is on the left-hand side. Obviously, the Aussie and the New Zealand are on the left side. So they are the base currency. So this would be an inverse correlation.
So, again, as I had stated last week, and again, when you’re talking about things, and specifically when I’m talking about things about Canada, once again, I’m domiciled in Canada. Canada is a wonderful country. A beautiful country. Because you disagree with some of the decisions being made in the Canadian economies and the government, that doesn’t mean you’re bashing Canada. That means you’re identifying problem areas. So the problem area for capital investment flows coming into Canada, I raised the concern that the budget that was supposed to be 14 billion turned into 140 billion.
That is a huge difference. So this combined with a number of other things that are going on here could make the Canadian dollar less attractive. This is what’s called fundamental analysis. Again, the same thing. If you’re buying a stock, do you just buy the stock because of a technical indicator or again, do you go in there and look at the problems? So right now I raised the issue and I said Canada was a little bit of a mess, and it kind of is. So is the UK. So is Europe. So were a number of other countries.
The main issue that Canada, where I’m domiciled in Ontario, Canada, we have gone into a state of emergency. We’re in a full blown lockdown. So maybe a lot of people outside of Canada don’t know that. They need to know that because the last time we went into a full blown lockdown like this, the Canadian dollar went all the way up to almost 150. So again, we’ve got to be careful about this. But here is the difference this time. So I’ve already listed in previous emails, some of my concern on top of which now the current prime minister is saying, there may be a spring election.
The markets don’t like elections. They don’t want the boat rocked either. But my point being here is that all of those fundamentals and then we could go to technicals, and I could bring up all the technical indicators. I will respectfully submit that those are concerns, but what is keeping the Canadian dollar strong? The answer is in an inner market analysis, not a technical indicator, not a fundamental indicator. I’m simply advising of those things, because if we lose this inner market correlation and the Canadian dollar has to stand alone by itself, it could experience some problems.
The other thing is oil. Canada is heavily dependent on oil for revenues. Energy sector is looking much better, and that hopefully improves, but you’ve got GM Ford. A lot of people talking about going to electric cars here. That is a concern. So again, if the Canadian dollar is a stock, then one would have to be crazy not to look at these things. But again, saying that somebody who lives in Canada is bashing Canada because of these fundamentals is utterly ridiculous. The most ridiculous thing I’ve ever heard.
New Zealand Dollar versus U.S. Dollar
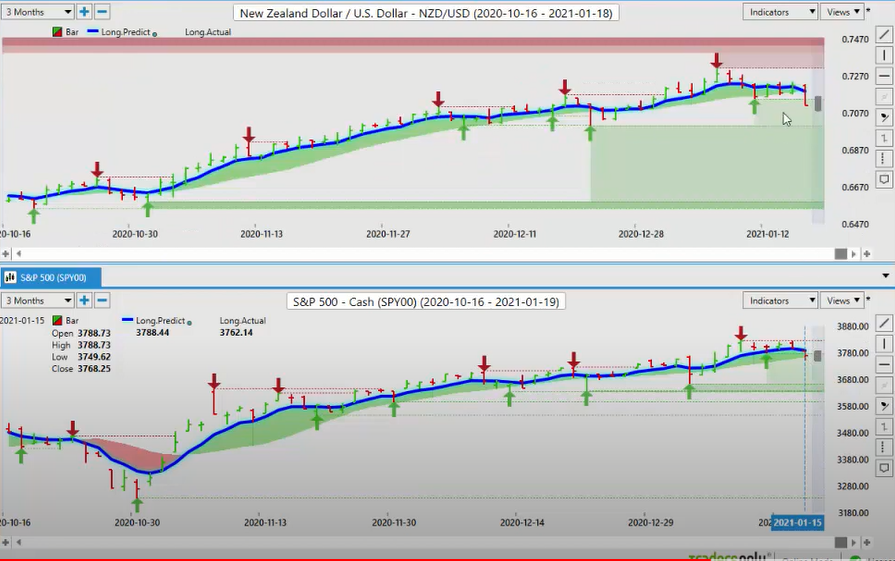
New Zealand Dollar versus U.S. Dollar
These are easily fact-checked to be… Anything I’ve said has nothing to do with political affiliations. It has to do with facts. Plain and simple facts, easily verified with a check. So the main concerns, lockdowns with Canada, oil prices, still not where they need to be, ballooning deficits. But the inner market correlation is… The fact of the matter is that it’s following the S&P 500.
So as long as that correlation remains intact, then even if the fundamentals, which I hope improve in Canada, and the deficit gets under control, which I believe it will eventually, oil prices go higher. It could still change if the S&P 500 crashes. So if you’re trading these three currencies, you need to be watching the S&P 500. So with that said, this is the VantagePoint AI Market Outlook for the week of January the 18th, 2000…
Are you using A.I. yet?


