


VantagePoint AI Market Outlook for the Week of January 4, 2021
VIDEO TRANSCRIPT
U.S. Dollar Index
Hello everyone and welcome back. My name is Greg Firman and this is the VantagePoint AI Market Outlook for the week of January the 4th, 2021. Now to get started the new year, we’re going to begin with the dollar index where we always start our weekly outlook. Now, with the dollar here, we can assess that we’ve made a pretty big leg down in the month of December, which is pretty normal. The dollar, usually not that strong in the month of December, but often does gain strength January through July, around the end of the month, the beginning of the new month approximately. What we will be looking for to begin the week is to see if we can hold down off of this low at 89.64 using our verified support. Now, our predicted differences are trying to turn back up. Our neural index is positive and our MACD has crossed the trigger as is the predicted difference on the MACD, both of which are moving higher.
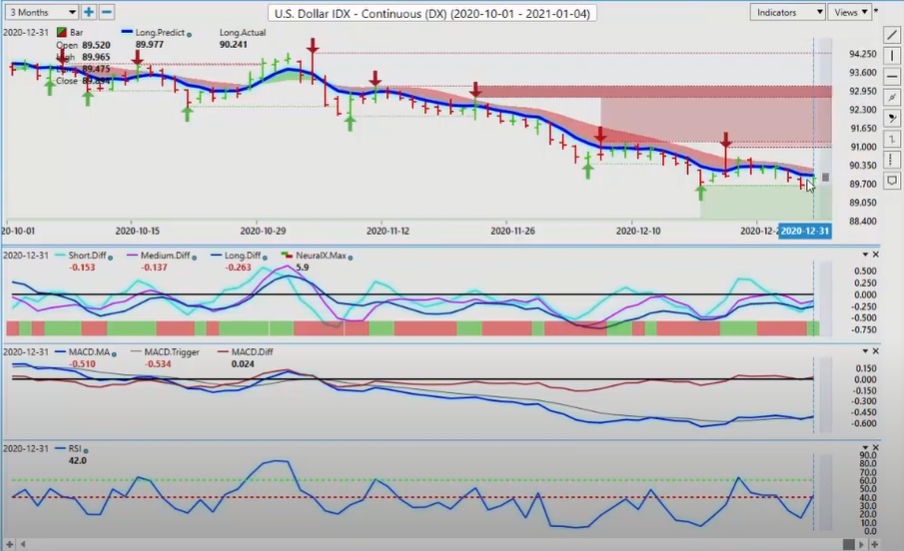
U.S. Dollar Index
Now, again, we want to use the key vantage point pivot levels to pinpoint when a trend is starting to reverse. Now, the longer term trend here is 90.38 when we clear that vantage point T cross long. However, when we look at the long predicted, this is the level where you really want to focus on, guys, 89.97. If we can move above this and close above this level, we’re looking for one or two days in a row, preferably two, to confirm that the dollar is going to gain at least some kind of strength. But again, we need to hold this level, in my respectful opinion, and I would prefer that we get back up above that 90 level and stay in that level.
Now, gold to finish the year, basically wandering around here, but just unable to break through these verified resistance zones. Now, the key level here again, 19.04 is where I’m seeing most of the resistance. We had a slight little pop-up here above there to 19.12, only for it to immediately turn back down. Now, we’re holding again above that T cross long, 18.76. My concern with further longs on gold here, guys, is that we’ve got the COVID vaccine, things are starting to calm down a little bit, so the question is: Can gold continue to rally even if the global economies start to fire back up, the COVID vaccine, assuming it works? This is what is still left to be seen.
GOLD
Now, again, at this time of year, we also want to utilize the yearly opening price. I’ve talked about that at some of the seminars, in a VantagePoint Live training room, but that’s a big deal at this time of year, guys, because, again, if we just put a line on our screen, assuming that this is where we end up approximately at the close, that that will be the open for 2021, then we would be using that level of 18.95 approximately. We could get a gap in the market on Sunday night, but we would use that level to see if gold can get above 18.95 and stay above that particular level. Then, that would tell me that gold would be bullish for the year. But if we cannot maintain levels above 18.95, then gold is likely to turn lower again.
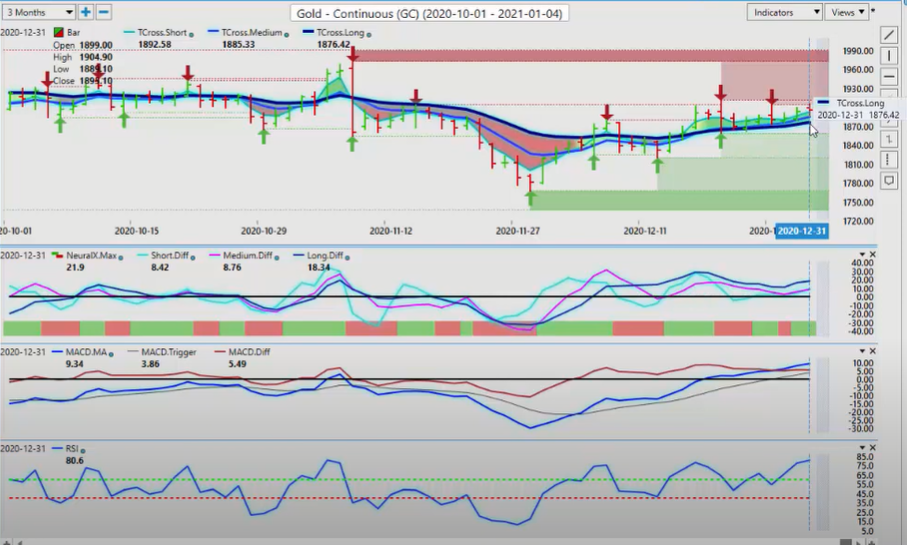
GOLD
Now, the dollar short trade is very, very crowded right now, I might add. Again, if there’s any kind of rally in the dollar, that would likely put downward pressure on gold. So again, keep an eye on those levels to begin the year. Right now, our predicted RSI is sitting at 80.6. Our predicted MACD is above the zero line and the predicted differences from Vantage Point with the neural index are still positive. Again, we still have some minor issues; well, maybe not minor, but there’s still some issues with Brexit. There is still some issues with the COVID vaccine. There is still some issues with the COVID virus mutating into a different type of virus. This could fuel gold and push gold back towards that upper 2000 mark. But my optimism on that at this particular time remains heavily guarded.
Bitcoin
Now, one of the reasons I say that is, again, when we look at gold being a safe haven, we can’t ignore the fact that again, the money that has gone into Bitcoin in this calendar year, I think it’s up some crazy 260% or something, don’t quote me on that, but it’s something like that. It’s made a huge, huge rally, is my point here. I have not been in that camp where people are saying, Bitcoin’s a scam, Bitcoin’s this. Again, I would be very concerned with somebody who is saying that like you’re Warren Buffetts in that, because again, you’ve got corporations that are moving money into Bitcoin for inflation purposes. A lot of the things, safe haven things you would use gold for, a lot of these companies are now using Bitcoin instead. I think that Bitcoin will continue to have a very bright future here, but nothing goes straight up and nothing goes straight down.
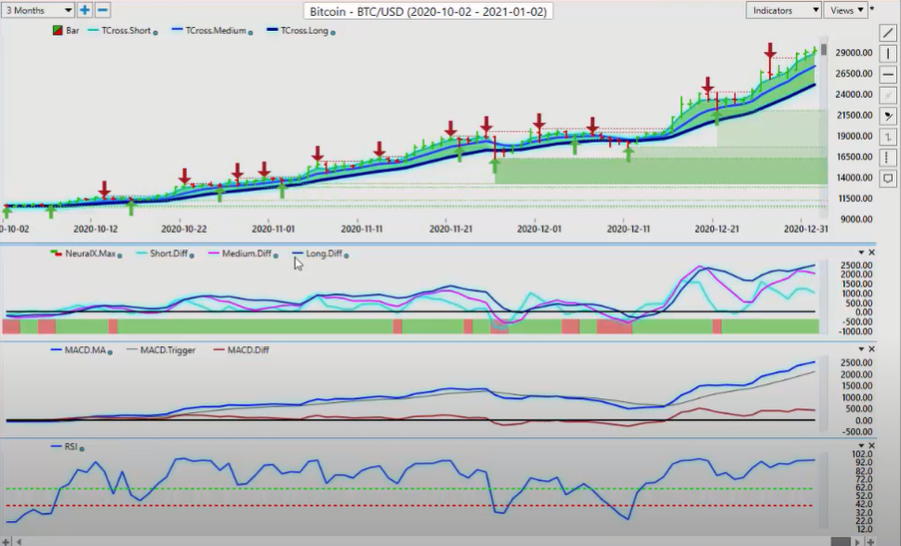
Bitcoin
We should expect some kind of pullback and the key thing here is to know those levels. When I look at this right now, 25,140, the T cross long. That is, we would have to close down below that level again for at least two days in a row for Bitcoin to reverse. You can see that Bitcoin tried to do this back here at the beginning of December and at that particular time, I was, again, a very strong advocate that Bitcoin is absolutely a gold or possibly a new gold, excuse me, but either way, it’s a buy. If we break through this psychological barrier of 20,000, we’re likely to extend much higher. That’s what’s happened.
So again, I think a lot of us, we need to study the charts, the inner market correlations a little closer, and maybe just turn the TV off. Some of the talking heads, your Jim Cramers, these types of guys that are going on and on and on and on every day, banging the gong on this kind of stuff, but are they looking at these charts? Are they looking at Bitcoin, the fact that Bitcoin is actually doubled in value every year for the last 10 years? Again, I bought into that maybe till about the early part of 2018, and then I really started to look at this Bitcoin chart and the inner market correlations that drive it. It was kind of a no brainer this thing was going to go, at least come back close to the 20,000 mark. But if it gets above there, there’s a good chance that this is going to extend much higher.
Right now for 2021, I think that 40,000 is a reasonable target at this particular time. Again, if you don’t want to trade Bitcoin futures, just remember there’s lots of other vehicles in asset classes on the ETF side where you can trade Bitcoin. There’s GBTC Bitcoin Investment Trust. We’ve looked at that one. A lot of different ways that you can get involved with Bitcoin.
S&P 500 Index
Now, with the stocks going into 2021, once again, they’re just ending the year on a very, very strong note yet again. And again, the shorts just don’t seem to be working with the S&P 500. So again, with the interest rates being low, the Fed talking about not raising rates, I would never bank on anything the Fed states or what they’re going to do, because they seem to always be behind the curve. I don’t believe that the interest rates will stay low for that long. In the second half, I believe that they could actually talk about potentially maybe even hiking again.
Again, we have to be very, very cautious; but for now, again, the key Vantage Point level, 36.98. When we click on our F8, if we’re going to turn lower, we would have to break down and close below 37.30. Now, again, it’s always good to use these pivot areas because they’re not a moving target. What I mean by that, it’s a stationary point and we’re looking for if the market can hold above it. You can see on this big rally when it started. We repeatedly have come back and tested this predicted moving average only to see it go higher.
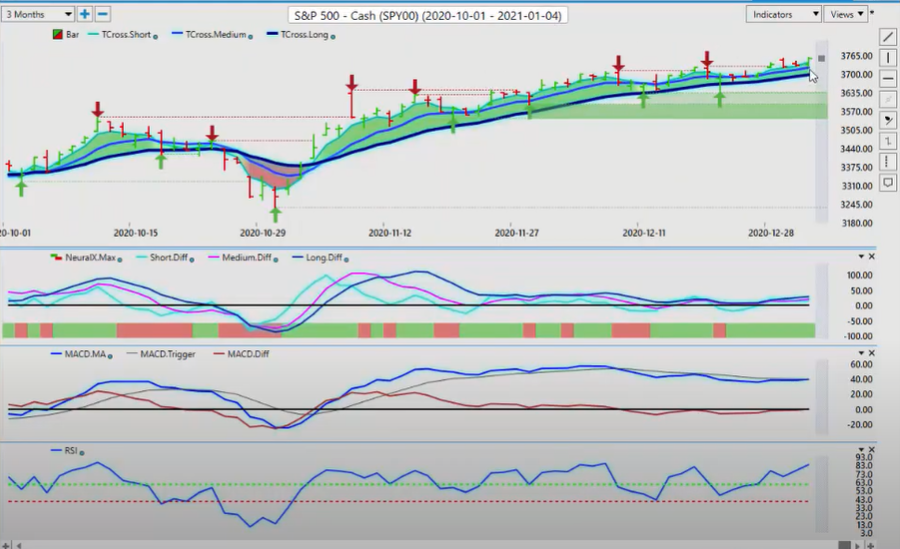
S&P 500 Index
Once again, guys, we want to make sure that we’re looking at the charts and ignoring some of the commentary out there that could persuade us the other way. Because again, we’ve got a lot people that are saying, “Don’t buy Bitcoin.” You’ve got a lot of people, they’re saying, “Short the equity markets.” A ton of people saying, “Oh, the equity markets are going to 4,200.” Well, maybe, but I believe that everything around the interest rates is not really resolved yet. It’s a very short-term forecast on interest rates and I believe that that could change.
Once again, when we look at getting started into the new year, too, oil is going to be a big factor here going into the new year. Right now, oil is riding the coattails, guys, of the S&P 500. The inner market correlation here is indisputable. When we look at this, this big move up that started up in oil, it was started on November the 6th, so when we cross-reference that and go back and look at that S&P 500 chart, you can see that the S&P, it started at the exact same time.
It’s important to identify these inner market correlations. Just remember that if people start getting a little nervous buying stocks up here at these prices, then oil will drop with the S&P 500. It’s never just about one trade, guys. It’s about multiple trades spinning off of one asset or one market class. So, keep an eye on it very, very closely. Either one of these could go first, but if one goes to the downside, the other is likely to follow. For oil to start the year 47.30, we need to hold above that particular level.
Euro versus U.S. Dollar
Now, with Bitcoin here, guys, and the euro, what I will say with the Euro here to start the year is, again, the euros had a pretty strong rally here in the month of December on the back of that dollar weakness. Now, we’ve had discussions in the room and here on VantagePoint AI YouTube channel about how there’s a number of different reasons, then, illiquidity in the month of December. Also, one of the issues that was raised, which was a very valid point, a fantastic point, that on an accounting standpoint, money goes out of the U.S. for tax purposes and then comes back in, and that forms a seasonality. I believe the gentleman that posted that. I think it showed that seasonality was accurate for some 48 years. If that’s the case, and the money’s on its way back, then the Euro could be in real trouble.
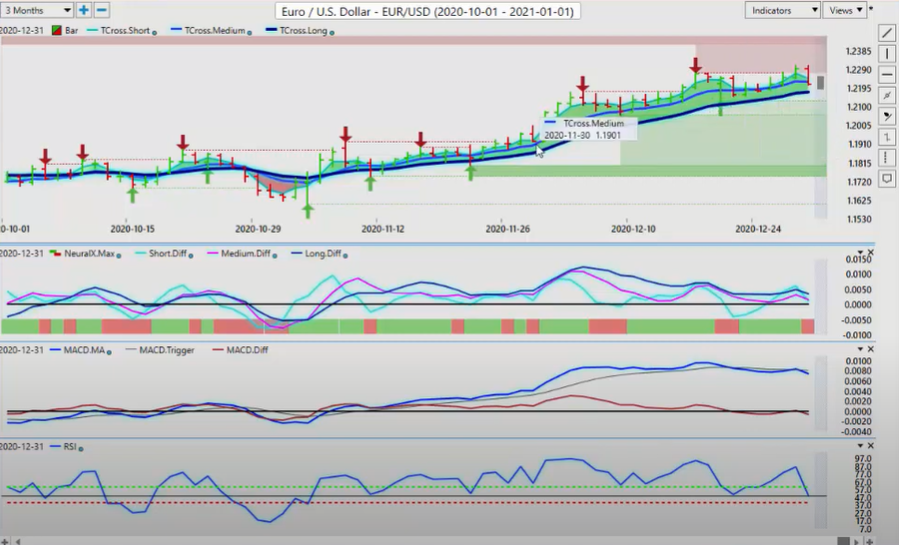
Euro versus U.S. Dollar
Once again, when we listened to some of the talking heads out there, it’s very much similar to Bitcoin. They’re saying, “Don’t buy Bitcoin. No, no, no, no, no. Don’t buy Bitcoin. It’s a scam.” And as Bitcoin keeps climbing up and up and up, so now these same pundits are saying, “Oh, buy the euro. The euro’s the way to go. That’s what you need to do. Buy the euro. It’s going way higher.” I get nervous when I hear that. Then, when you bring in something like the commitment of Traders Report, well, that’s in the billions guys. They’re measuring market sediment via the billions of dollars. But remember the foreign exchange is a decentralized exchange and the total amount that’s traded in the Forex market on a daily basis is getting close to $5 trillion a day. 20 or 30 billion really is not going to be enough to influence me one way or the other. When I look at this, the euro, you can see, to me that final trading day looks like a bunch of rats leaving a sinking ship. It’s what it looks like to me.
The key vantage point level 121.74, we’re going to watch very closely to see if we can hold above that particular level. But if we can’t, then the euro is likely to drop very quickly. One of the other ways you can look at that is this. Closing below that blue line, the euro has had a very nice rally, and again, you’ll notice the date that I’ve marked on there. The inner market correlation the euro has had to both gold and the S&P 500. This big rally started on the exact same day.
Stocks may not be what they appear to be so we’ll monitor it very closely. But if the euro tanks, then we could see gold tank with it, and maybe even the S&P 500. The first step of that has occurred. But granted that it might just be profit-taking. But when I look at the indicators right now, we’re holding above the 50 on the predicted RSI, but we do have a crossover to the downside. On the predicted MACD, the neural index is down and the predicted differences are now angling to the downside. We’re going to monitor this to the beginning of the year, but remember, we are looking for some type of dollar strength at the beginning of January.
British Pound versus U.S. Dollar
Now, the pound dollar, again, we’ve got a lot of issues with Brexit resolved, but there’s still a lot of issues with it that are not resolved. Now, the U.K. is facing more lockdowns, I’m not convinced that the pound is going to be able to make a lot of headway from here. Again, make sure you add the yearly opening price to your Forex stocks, commodity charts, so you can gauge whether something is truly bullish or bearish. If it’s above its yearly opening price, guys, how could it be bearish? It’s saying that the sediment is bullish, if we’re above the yearly opening price; if it’s below it, the sediment is bearish. It’s a very straightforward tactic that many CTAs, I don’t really hear them talking about it, but it’s very important particularly in January, February, and March, when new trends are forming. Make sure you’re adding them to your chart. I think you will really like what you see.
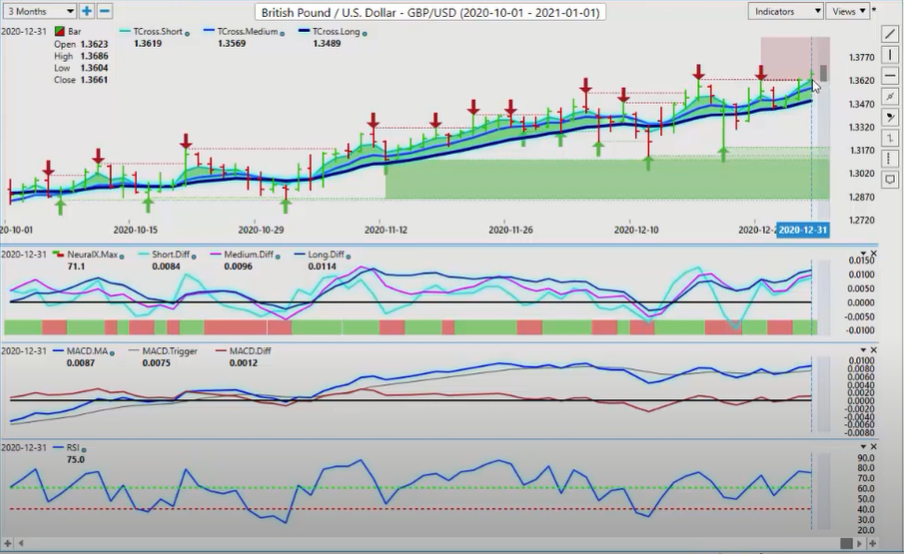
British Pound versus U.S. Dollar
Now, with the British pound, our predicted differences are still pointing up. Our MACD is still pointing up, so it’s still showing strength. But again, keep a very close eye on current events. Right now for the pound, for a complete reversal, we would have to break down below 134.89. But the starting point, again, will be a breakdown and close below this particular predicted moving average at 135.81. If we lose and we close below 135.81, then we are likely going down into that mid-134 level and I would imagine we would get there very quickly. We’ll continue, again, to monitor this to begin the year, but right now it’s still holding a relatively bullish tone.
U.S. Dollar versus Japanese Yen
Now, with the dollar-yen, the dollar-yen has very, very strong, verified support coming in at about 102.88 level. We’ve come back down and tested this, but if we’re looking at for places of value to buy U.S. dollars as we go into the first couple of weeks of the new year, then obviously this would be a place of value. Just like a place of value would be selling pound-dollars, selling euro-U.S., these are, again, markets that are a little bit overextended. I believe the dollar-yen is a little overextended here, but the risk off scenario is again very important. If gold cannot maintain its bullish bias, then we would see dollar-yen reverse higher. But if gold breaks out back towards the 2000 mark, then the dollar-yen will easily push back down through the 102 area. There’s been a lot of rumors talking of intervention by the Bank of Japan at the 100 of all. That would tell me that they suspect the dollar-yen, either way, is going to the 100 level and they’ve been ordered to protect that level.
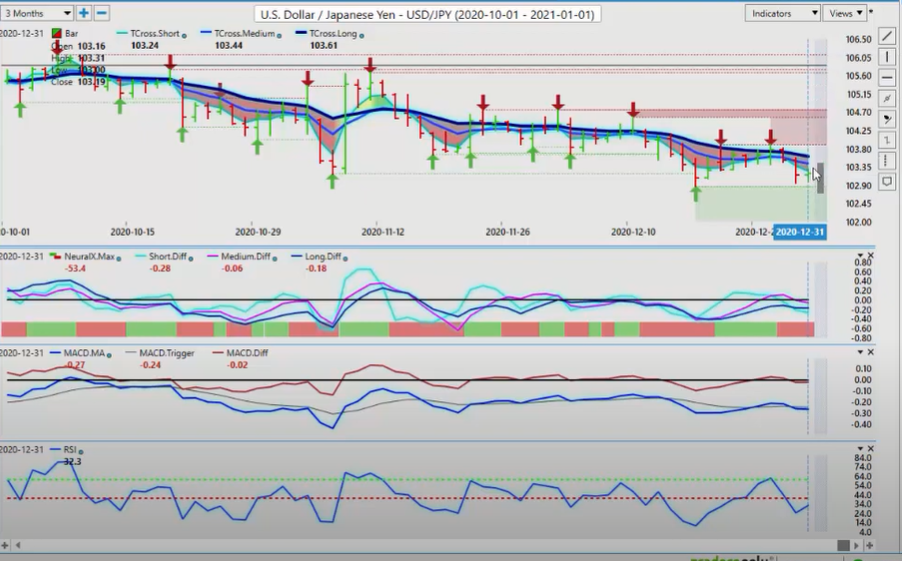
U.S. Dollar versus Japanese Yen
Now, that has never worked in the past. Any kind of Central Bank pegs against currency, stuff like that, frankly, it’s been a disaster, using the euro-Swiss franc pair as an example. So, we’ll watch this. But again, I’m not convinced at this particular time, that the dollar-yen is going to break through this particular level. We’ve got a reverse check mark on our predicted RSI, looks like we’re getting ready to start to turn back up. But our MACD is still down, our neural index is still down, and our predicted differences are below the zero line. Again, if we can get these predicted differences back up above the zero line, the neural index turning positive, and get this RSI above 50. And remember, apply your yearly opening price to this pair. Very, very important.
U.S. Dollar versus Canadian Dollar
With our three main equity-based currencies, the U.S.-CAD, Aussie-U.S., New Zealand-U.S., we’re going to be watching them. Also, when you’re trading these three pairs, guys, you need to watch the S&P 500 like a hawk. I have gone so much as to say in the past that I will be trading the U.S.-CAD and I’m not even looking at the charts. I’m looking at the S&P. If the S&P is going up, I’m selling US-Canada. If the S&P is going down, I’m buying U.S.-Canada.
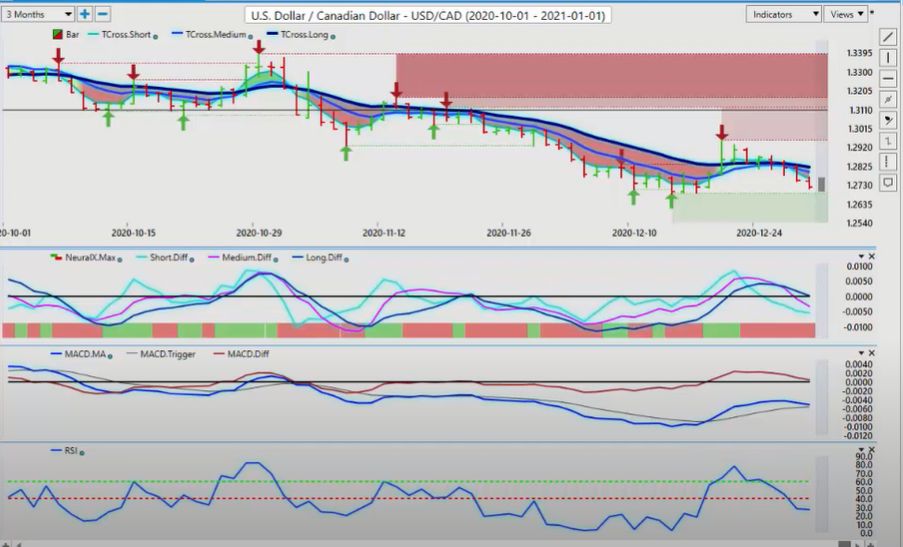
U.S. Dollar versus Canadian Dollar
Now, again, a huge factor in my respectful opinion, the Canadian dollar is grossly overvalued at this particular level. I would forecast by the early part of the second quarter, we should easily hit the 134 mark because, again, when we look at this a little bit closer, if commodities can’t hold their gains, then neither will the Canadian dollar. Now, Canada is back in lockdown, 28 day lockdown, things are not going well here, a lot of jobs have been lost, to say the least here, and the government has taken on an enormous amount of debt. Again, when we talk about the U.S. printing money, just remember, they’re not the only ones printing it. Canada is printing more than its fair share of money, but it doesn’t have the kind of economic engine to pay that money back the way the U.S. does. So, my bias is still, even though I’m in Canada, guys, I’m still dead against buying the Canadian dollar. But I will watch this verified support low 126.88. If we lose that level, then the Canadian dollar could surprise us all and make a run towards the 124. But I think that that’s very unlikely.
When I look at the indicators, our predicted differences are down. Our neural index is down. Our RSI is below 40. But our MACD is surprisingly stubborn. It’s not confirming a move lower. Now, once again, our reversal point is above 128.22. The way that this reversal will start, it will start with a break and close above 127.89. This is how we use these predicted moving averages. Keep a very close eye on those two aforementioned levels.
Australian Dollar versus U.S. Dollar
Aussie-U.S. and New Zealand-U.S. are going to be 100% dependent on stocks moving higher. Again, when I look at this right here, we are a little bit overdone, but another buy signal, yet another one, is forming again. After, you can see we’ve had our corrective move lower bounced off that key vantage point T cross long only to turn around down from that low of 74.62, and go all the way back up into the 74 levels. Pretty impressive rally, but again, dependent on stocks. For now, guys, keep a close eye to see if this predicted difference cross can complete to the upside. If it is going to complete, it’ll probably be by Wednesday or Thursday, and that would signal the S&P is going higher. The Aus is going higher, the New Zealand’s going higher, and potentially U.S.-Canada lower. We’ll continue to monitor that.
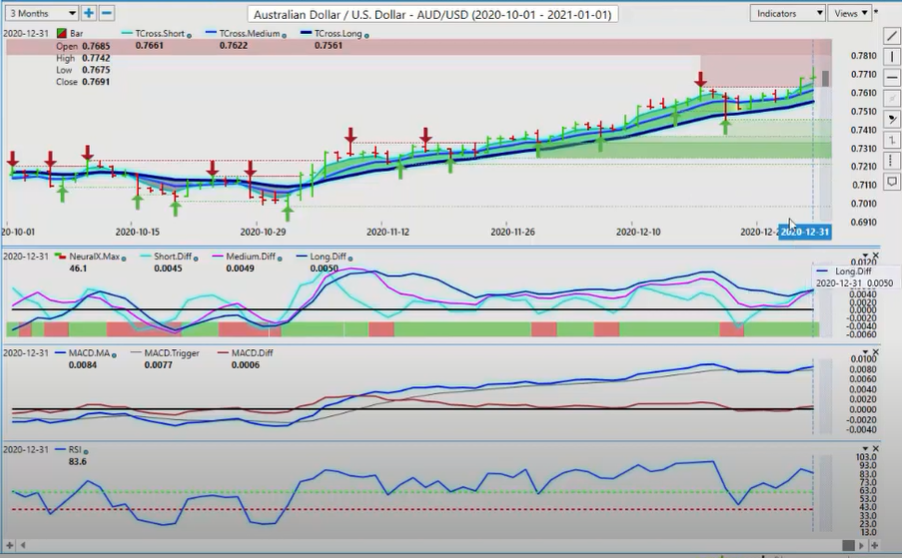
Australian Dollar versus U.S. Dollar
But again, getting close to price, this is how we do it. We use our long-term crossover, remove the black line, and put this blue line in by itself. You can see the long-predicted 76.36. If we can hold above that, the Aussies got a real shock, but again, keep a close eye on the S&P before you make any decisions. Same thing applies for New Zealand here, virtually the same trade here, guys, much like stocks. If you’ve got 50 different stocks, 48 of them are going to follow the S&P 500 regardless of their balance sheets and everything else. The currencies work the same way. You’re either buying or selling U.S. dollars, and most of the other ones just fall in line.
New Zealand Dollar versus U.S. Dollar
When I look at this right now, 7100, we have to close below that in order for this to be a reversal. Right now, the news I feel personally, in my respectful opinion only, there’s a little bit better value buying New Zealand than there is the Aussie. That’s just my opinion based on the charts.
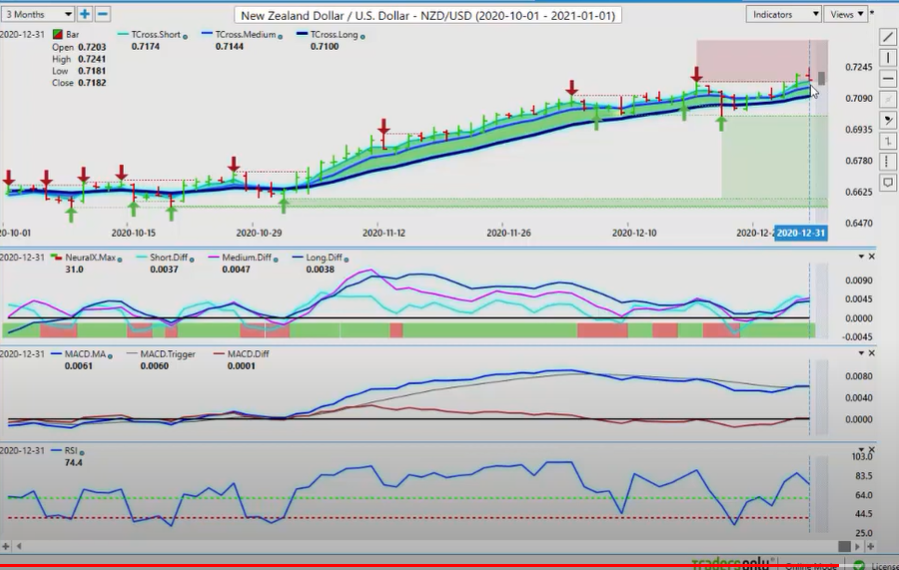
New Zealand Dollar versus U.S. Dollar
But again, this rally too, a little bit overextended. When we come back and look at this right now, you can see that the bulk of these moves came all at the same time. This is what the fourth chart that I’ve shown you guys with that date of November the 4th, where a lot of this activity on multiple different markets, oil, the S&P 500, the dollar, gold, the euro, all of these things took place at almost the exact same day. That’s an indisputable fact that inner market correlations are driving factors. Again, if we get a reversal on one currency pair or on one commodity such as gold, there’ll be a massive train reaction throughout the entire markets. Keep an eye out for that and just understand that these markets are absolutely globally connected. With that said, this is the VantagePoint AI Market Outlook for the week of January, the 4th, 2021.
Are you using A.I. yet?


