


Welcome to the Artificial Intelligence Outlook for Forex trading.
VIDEO TRANSCRIPT
Hello, everyone and welcome back. My name is Greg Firman, and this is the VantagePoint AI Market Outlook for the week of July the 12th, 2021.
Now, to get started this week, we’re going to begin where we left off in last week’s presentation in looking at predicting market moves, multiple market moves, using intermarket correlations instead of conventional standard technical indicators, wave theories, Fibonacci. All of these things can be used, but we must apply intermarket correlations.
So in last week’s presentation ahead of the market, because again, this is an outlook, not a review of something that already happened. When we look at this, we can see at the beginning of last week’s presentation, I brought in gold as a major player here. I had stated that closing above this predicted moving average is an indicator that gold could be getting ready to move up. Not a trend reversal to the upside, but it’s getting ready to move higher. That would put pressure on certain currencies, particularly the US dollar.
US Dollar Index versus Gold Correlation
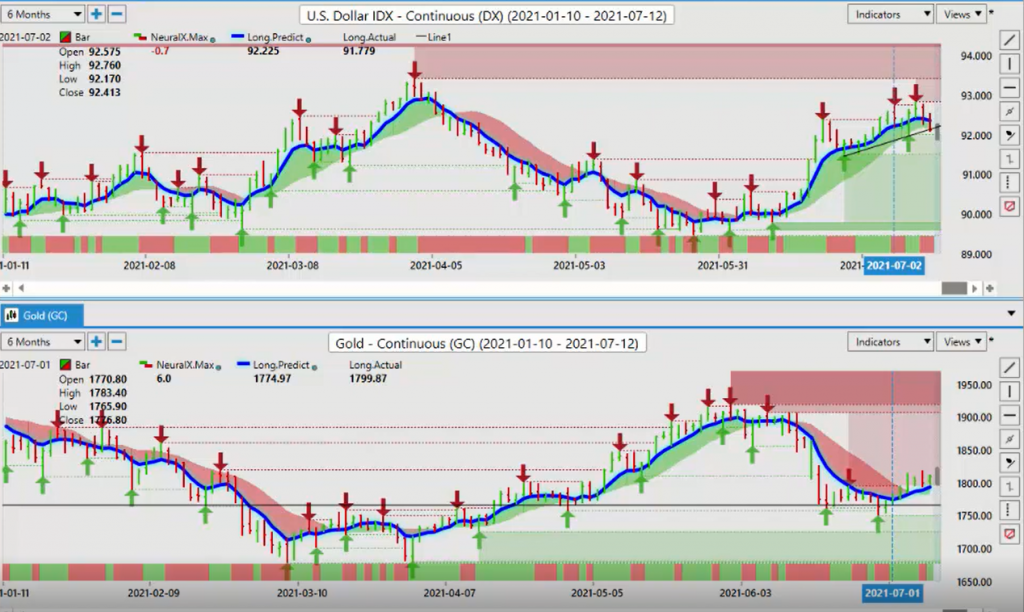
When we look at gold rising above that predicted moving average, we can say, okay, there are certain currencies that are going to be affected by this. We do not want to track impulse buying or impulse selling. We want to track intermarket correlations that will drive multiple other markets. What I had stated in the VantagePoint Live Trading Room and with my own direct client base is that if we break above here, then the dollar will not be able to move higher to any real extent.
When we look at the correlation in last week’s presentation, I had stated we must clear 92.76 decisively, not just a pop above it. And we can see we moved above it based around the Fed. But again, that’s a type of impulse buying that isn’t related to a wave or any kind of theory like that. It’s related to the Fed statement or the Fed minutes. So as soon as that passes, the market leaves that. Now, we’ve got a trend line support that’s coming in here off of this additional verified support low at 91.92 or 91.99, approximately.
If we break down below here and we break down below that verified support zone, we would need gold to continue to advance. That’s what we’re looking forward to happen. To start the week, we would look at the low of 1796, but the main point of this particular presentation is to show that the dollar cannot advance with gold advancing. Either one or the other goes, in most cases, 85% of the time not both. Again, when we look at the dollar index moving lower, that’s going to affect certain currencies.
Euro versus Gold Correlation
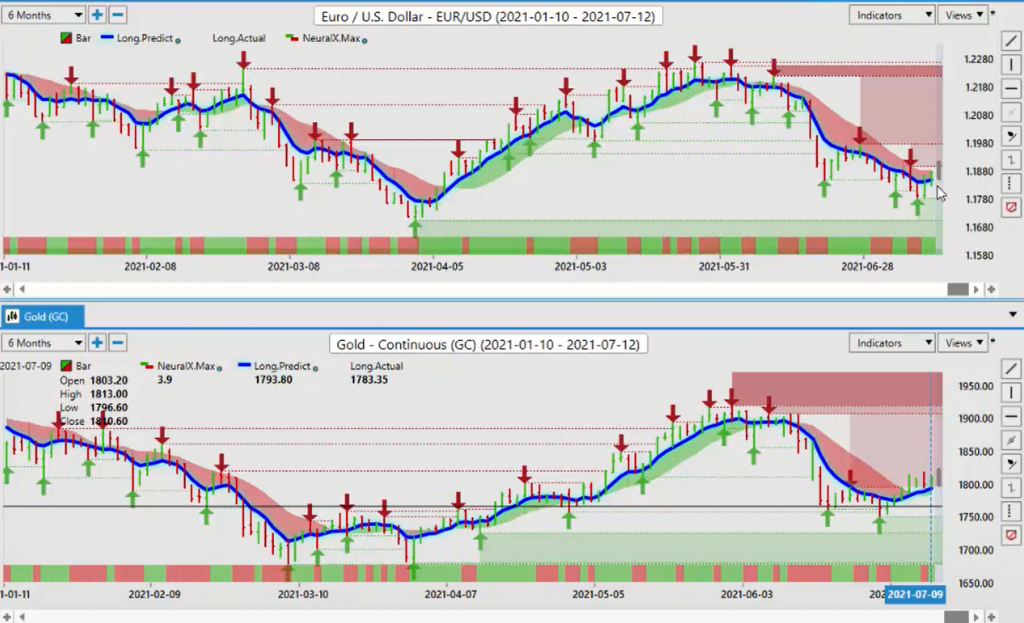
Now, the one that I had mentioned last week more specifically is the Euro-US pair. It will likely start to recover if… Again, we can’t break through that 92.76 level on the dollar index. But if gold keeps moving and holding above this predicted moving average, then the Euro is going up, not down. Now, it’s still corrective in the move higher, but the main thing is that we identify certain currencies, US-Swiss Franc. The Swiss Franc and the Euro are highly correlated to gold. The additional one that I had discussed last week was the yen.
If this move above this predicted moving average and gold is advancing higher, the Yen will strengthen along with the Swiss Franc and the Euro. That is exactly what happened. Now, again, we don’t need 50 different indicators to do that. We don’t need to calculate or count waves. We don’t need a lot of things, guys. What we need is a proper foundation in our trading to first understand that we’re in the 21st century here. Do we want to be looking back at stuff from the 1800s and the 1900s?
Australian Dollar versus S&P 500 Index Correlation
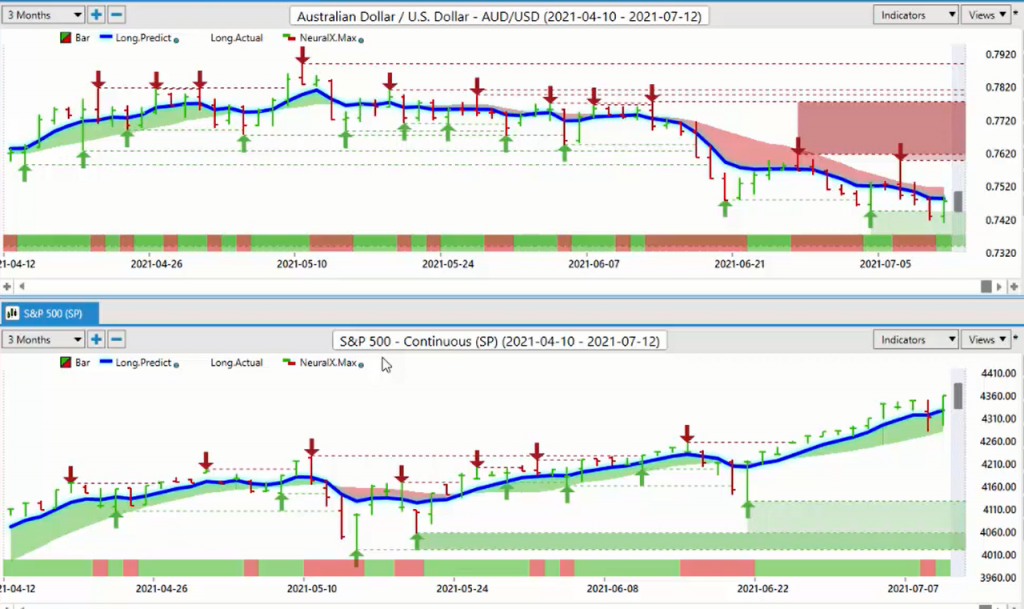
Of course, we can look at some of these things, but we must apply these new forms of trading, which is using the AI to identify these intermarket correlations. Trading basically naked here by just looking at gold prices and saying, if the gold prices are going up, then the dollar is not going to strengthen against these certain currencies. Now let’s take this in our lesson this week. We’ll go one step further and we’ll bring in the S&P 500, and we’ll do intermarket correlations there.
In the VantagePoint software, I can actually set up my pairs that I want to look, and then apply that same theory, but this time using the S&P 500 instead of just gold. There are certain currencies that are going to be affected by a rising or a falling stock market. If we understand that, not only does that help us with our stock trading, our commodity trading, but it really assists us with our Forex trading. Now, again, the Forex market is a decentralized market. You have large institutional flows. I’ve talked about repetitive patterns in the dollar index.
In last week’s presentation, I also stated that 85% of the time, regardless how good or bad that nonfarm payroll number is, the dollar sells off on the Tuesday or the Wednesday the following week. That is, again, what has happened here. But it’s a repetitive pattern that happens nine of the 12 months per year. Again, it’s not based on any conventional methodology, on waves, or any of this stuff. It’s based on institutional flows coming in and out of the US dollar. We don’t want to track impulse buying and selling.
We want to be tracking institutional funds and where they are moving their money. Retail traders, again, the statistic with the CFTC I believe currently is that regardless of the market, 75% of retail traders are losing money and 25% are making money. Based around that statistic, again, do we want to track that type of trader, or do we want to track what big money is doing? The way we do that is with intermarket correlations.
When we look at the Aussie currency, we can see that the Aussie tracks, not only does it track gold to some degree, but it really tracks the S&P 500. Now, with the latest nonsense from the federal reserve, that’s causing a little disrupt disruption in this, but you can see how quickly that comes back. So if we see a big down bar on the S&P 500 on Thursday, we see the exact same thing on the Aussie-US. When we see a big up bar on the S&P 500 on Friday, we see a big up bar on the Aussie-US.
So basically there’s about a 90% positive correlation between the Aussie and the S&P 500.
New Zealand Dollar versus S&P 500 Index
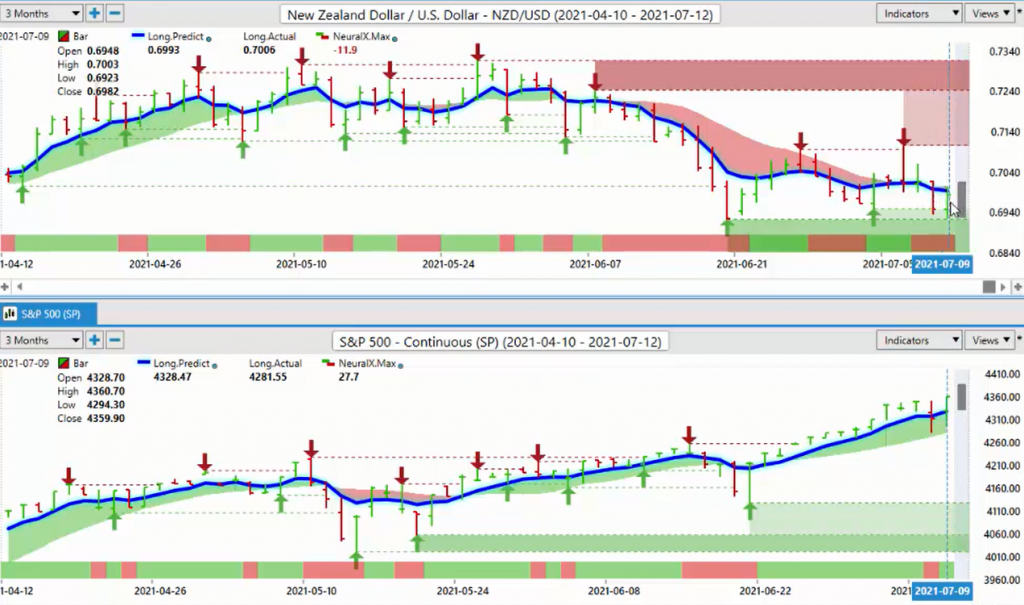
If we apply the New Zealand currency, we see the exact same thing. A big move down a New Zealand-US means that there was a big move down on the S&P 500. But when the S&P 500 recovered, the New Zealand currency immediately recovered also. The other currency that we can apply this to is, of course, the Canadian dollar. When we look at this right now, this is an inverse correlation. You can see that when the S&P 500 goes up, the US-Canadian pair goes down.
Canadian Dollar versus S&P Index Correlation
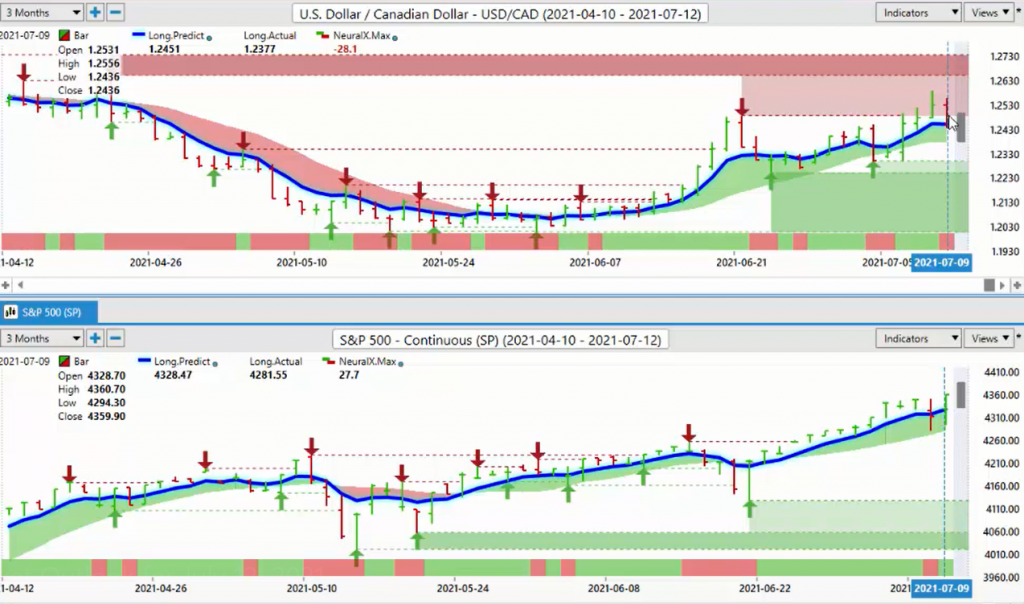
The Canadian dollar is the quote currency, not the base currency on the left. The US dollar is. When we do a comparative analysis here, we then say, okay, well, if the S&P 500 is doing a hard recovery on Friday, there is no way the US-Canadian dollar pair is going to go higher. This is what is the basis of intermarket correlations. In this week’s presentation, we’ve done a follow-up on gold. And gold we’ll talk about more here in a second, but the main thing is we’ve identified the main currencies in the Forex market.
We’ve split them into group A and group B. We’re not applying older technology to this. We’re applying the AI to this, using the predicted moving average, using some of the additional indicators that I will show you in a moment. But the main thing is to segregate these pairs into two groups, group A and group B, one that goes with gold, the other one goes with the S&P 500. Now from here, we can move back to our regular presentation.
So now we’ve got a foundation in our trading, an understanding with our stocks, our commodities, our Forex, what everything is correlated to, we start to look at our main pairs and some of our main commodity groups. If we look at our trading, regardless of what you’re trading here, my friends, is there’s major groupings that we must watch, the dollar index, oil, gold, the S&P 500 to gauge the global equity markets. And of course, I firmly believe based on a round of forecast, particularly from VantagePoint, that Bitcoin should be at least recognized.
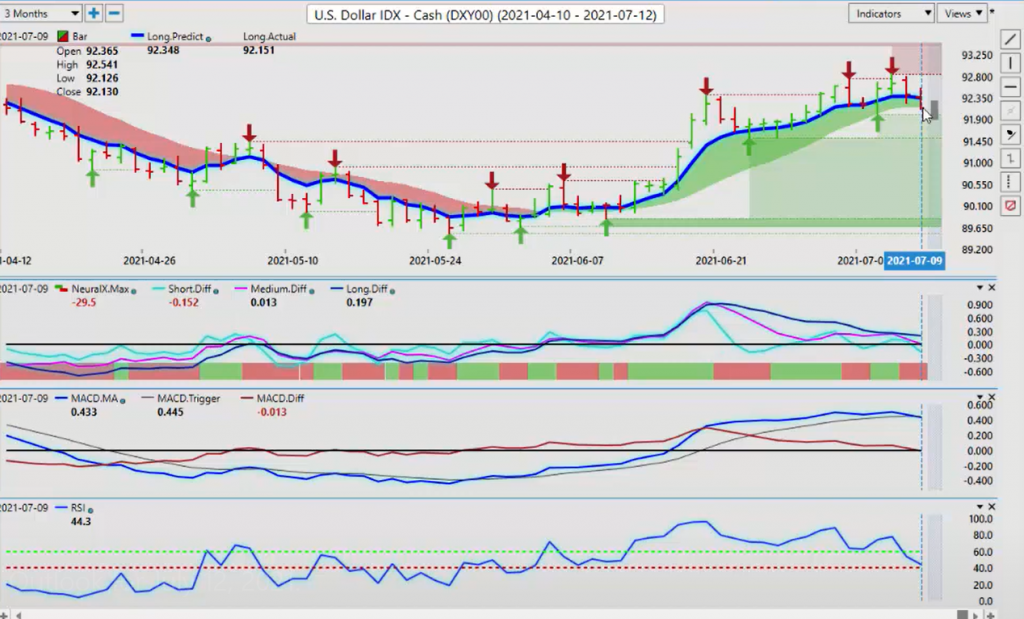
We should not be disregarding that. There are a lot of rumors about Bitcoin. It’s been a heck of an investment, actually the best one over the last 10 years, with an annualized returns of 230%. Yes, it’s been volatile. Yes, it’s been choppy, but that doesn’t mean we don’t want to still look at that as a proper investment. Now, as we look at the dollar index, in the analysis from last week, I had stated very clearly that we must clear 92.74 and we must close above it. And I would prefer it be two days in a row to weed out any false signals.
But sure enough, on the Wednesday, in the Fed minutes, we had a small bounce up above that area, but we could not close above it. And that was the trigger to send this lower. Now, the main thing we want to understand here is this move using the VantagePoint software on the downside. I actually started some time ago, back in the end of June, actually, when the medium term trend was weakening against the longer term trend, and then we’ve got basically just a bunch of noise here, right? The key support level also, again, is 91.96.
If we click on the single predicted moving average by itself, I have, again, a two day rule where I like to close below this level two days in a row. The other thing I’ve often mentioned in this particular presentation is Monday is very often… Whatever the market does on Monday, it does the exact opposite on Tuesday. This, again, often confuses wave theories. Fibonacci is a number of technical indicators, accumulation distribution. I could go on and on, CCI, MACDs. It causes confusion because the price from Monday, usually it does the exact opposite on Tuesday.
Then on Wednesday, in a high volume trading day, we see something different. But the main thing we want to look at from the dollar index right now is that long predicted 92.34. If we’re going to continue to sell US dollars and gold is going to continue to rise, then we would like to stay below this particular level and we would like to break and close below 91.90.
The indicators from Vantage Point, the predicted differences, once they clear, if they clear this zero line and our predicted RSI, again, using the predicted RSI, or any RSI for that matter, using a 60/40 split, we want to gauge momentum. This is a momentum-based market. We want to gauge momentum, not overbought and oversold. That is one of the most least effective ways to trade, trading off an overbought or oversold signal. That’s not a signal. You’re basically telling the market to stop going higher right here and go lower.
I can assure you the market is not listening to you or me for that matter if I were to do that. We always want to make sure that we’ve got a level to gauge a line in the sand, so to speak. And our line in the sand for this coming week is 92.30. If this continues to hold below there, then longs on Euro-US, longs on pound-dollar, shorts US-Canada, these will all be into play. Forex trading is predominantly buying or selling US dollars.
But just remember, it’s dominated not by impulse buying and selling, but rather institutional funds buying or selling large amounts of dollars at specific times of the month. This is normally not a period of dollar strength. When we look closer at the S&P 500, the Fed does a great job of protecting his precious equity markets. They push this thing all the way down to the VantagePoint key level, and I can assure you here also, this is not a coincidence that the market stopped exactly at 4,285 and rebounded.
The VantagePoint T cross long, this predicted moving average, like a moth to a flame, it’s drawn to it, but then it bounced right off of it. And again, we cleared the zero line. We’ve got a reverse check mark, again, on the predicted RSI. The only thing the RSI is at least in my respectful opinion, how I’ll present it, is it’s not used for overbought or oversold. It’s used to gauge momentum using a 60, 40, and a 50 split. You can add a 50 level to your predicted RSI just by going like that.
But you can see, we slipped inside, but we held above the 50 mark and we reversed back off the 60 level and the slope of it is pointing higher. So again, pointing to further strength in the equity markets. But certainly I can’t endorse shorts on here, but if you were to say to me that these equity markets are grossly overdone, I certainly would not argue with you, guys. I have this discussion almost weekly. I would totally agree with you actually.
But again, the market got it set in its mind and I believe that the global equity markets are heavily manipulated by the Fed. Longs are very, very good trades. Shorts have been very, very difficult. They can be profitable at times, but again, somebody keeps pushing these global equity markets higher whenever they sell-off. Now, again, with a quick analysis on gold, we don’t have a lot of momentum here. The predicted differences are starting to turn sideways.
Gold
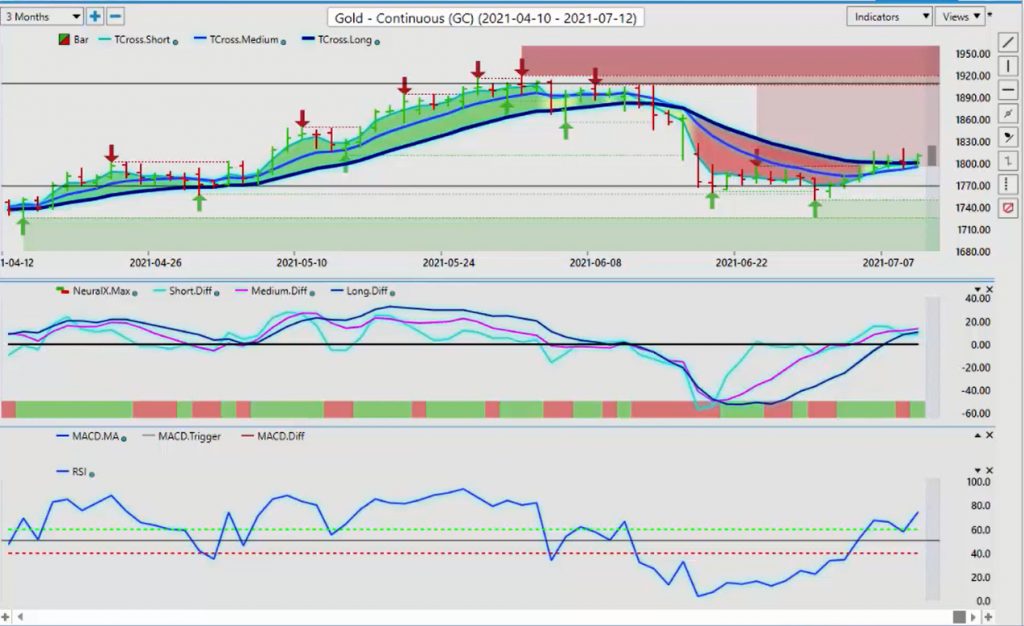
We’ve corrected higher from the exact level that I discussed in last week’s weekly outlook, and a number of currencies followed that. So looking at this going into next week’s trading, we’ve got our T cross long at 1,799. If we click on, again, on our F8, using that predicted moving average, and, again, from last week’s presentation we closed above it and we retraced right back to it multiple days. Every single day, a long trade. It doesn’t require complex methodologies, complex theories.
Just looking at the predicted, moving average, as long as it’s above that, we’re long. If it’s below that, we’re short. So to start the week, we’ve got 1,795. We want to make sure we’re above this still by the end of the day on Tuesday or early Wednesday. Monday, again, is not a day to be trusted. I say to my own direct clients, do not take any positions to a very minimum 9:00 AM Eastern Standard Time on Monday. Let all markets come back in, guys, before we start getting aggressive with any of our trading.
But it still does look pretty bullish with gold, but it’s not a very, very strong signal here. Now, as we look at, again, a driving factor or using those intermarket correlations, we can also apply light sweet crude oil to the S&P 500. Now, in my respectful opinion only, oil was a leading indicator on Thursday that the S&P 500 was going to rebound on Friday. Once again, with all the fancy indicators out there, the AI looks at this and says, okay, no, we’re above that T cross long on the S&P 500.
Crude Oil
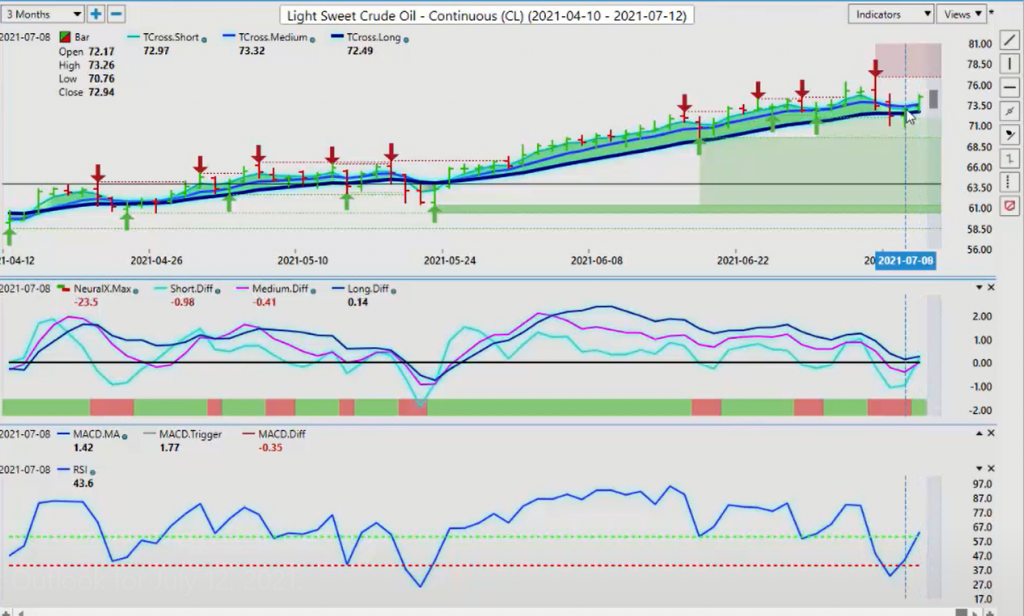
Oil is now recovering, despite all the nonsense from OPEC earlier in the week. It’s moving back up. The S&P is likely to follow. Now, the indicators, again, in the VantagePoint software, we’re holding. This is a great example here, guys, of why I always use that… I try at least 80% of the time to use that two day rule, where I’m closing below that T cross long two days in a row. And you can see, I didn’t get that. So while this looked like a very good short, in actual fact, it wasn’t.
And then on Friday, with the S&P 500, oil has a nice springboard rebound right off of there, and up we go. I would anticipate that if the global economies are opening, the theme parks are opening, Canada’s Wonderland, Disney, people are going to be traveling, then we’re back in summer driving season, then if that’s the case, then oil is likely to extend its particular gains. Now, my good friend here Bitcoin is under a little bit of selling pressure again.
U.S. Dollar
One of the key intermarket correlations that I’ve seen is even though it’s trading against the US dollar,
Bitcoin
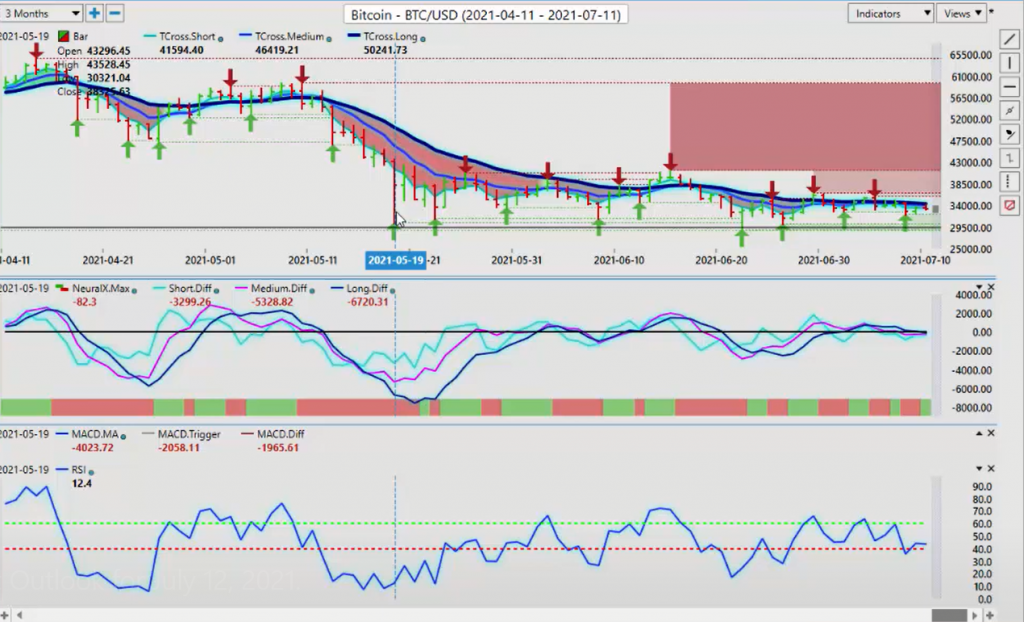
Bitcoin tends to be going up and down with the US dollar. We want to keep an eye on that very closely. I don’t think we’re going to see another big move in Bitcoin until probably into September. I think we’re going to move back and forth along this particular channel. But the yearly opening price, again, a non-indicator that you want to apply to your charts. Make sure you’re looking at that. 28,800 is the line in the sand for me personally.
That’s the Coinbase yearly opening price. The futures side is I think around 33,500. But again, we’re moving in a very long-term channel here from May the 19th. We’ve got multiple failure points up here into June the 15th, up into here. But again, in my respectful opinion, Bitcoin is not going anywhere. It is likely here to stay. The indicators on VantagePoint, Not a lot of momentum either way. We’re likely just going to work back and forth along this channel again until probably early September.
That would be my forecast for now, barring anything from China or any other negative news from Bitcoin. But that’s the true definition of impulse buying and selling, people reacting to Elon Musk, people reacting to China. It’s a buy the rumor, sell the fact 85% of the time.
Euro versus U.S. Dollar
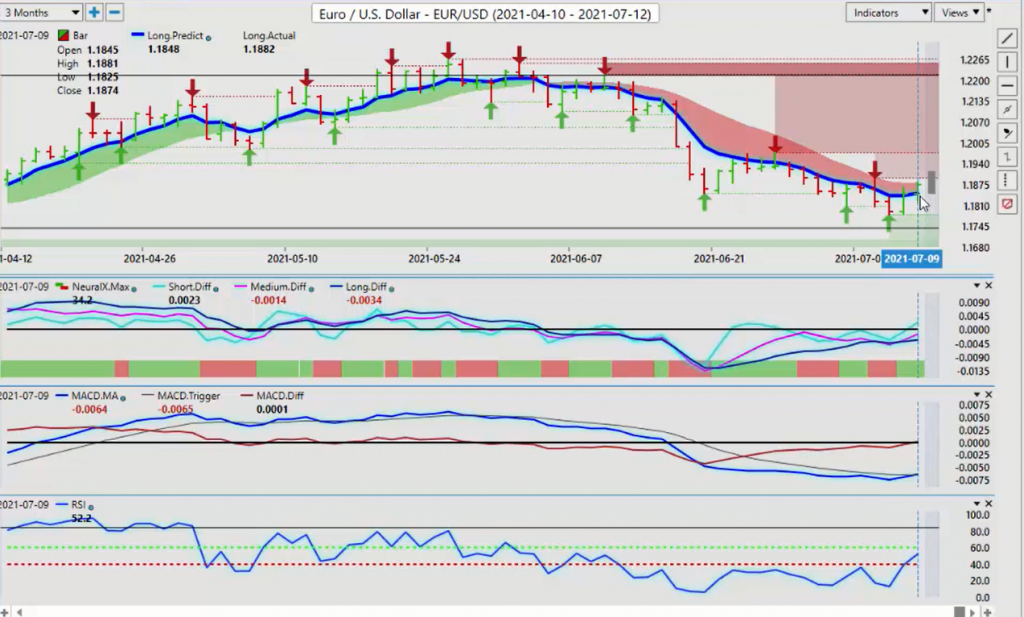
When we’re going forward in our Forex trading, once again with the Euro-US, we must now clear 1.1906 and stay above that level. We have an MA diff cross with the neural index and a rising RSI, but we’re not above the 60 level yet. We’re lacking that particular momentum.
When we click on our F8 in our software, we have a two day close above this blue line. 80 to 85% of the time, this suggests a bigger move is coming, but we need gold to, again, cooperate here. It’s dependent. The Euro is dependent o gold, going higher and the dollar index going lower. That is the likely outcome. We just need to clear this verified high at the 1.19 mark, and then we should be able to retrace back up towards the 1.1975 mark.
But again, on the downside, watching your support low 1.1825, we’re long above that, but we must clear that T cross long.
U.S. Dollar versus Swiss Franc
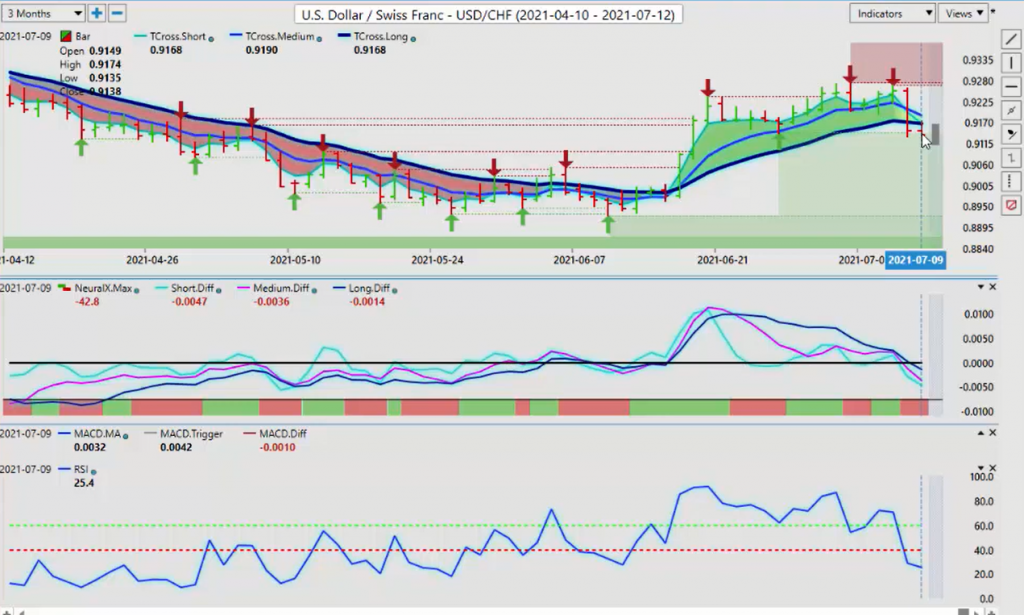
Now, with the US-Swiss Franc, again, we’ve had a big sell-off. That was predicted in last week’s weekly outlook. With the gold prices moving higher, that would immediately strengthen the Swiss Franc and weaken the dollar. But again, we are closing below the T cross long at .9168. Keep a very close eye on that level. Our predicted differences are slipping below the zero line.
The predicted RSI snapping the 40 level, and you can see momentum is building. But we do have a verified support low coming in at .9143 that we must get below and stay below. On the upside, for the start the week, we’re going to look at that long predicted again, .9185. To break it down in simple terms, get as many moving parts out of this as possible. .9168, .9185, that’s where all the resistance is. The predicted high at the start of the week is coming in at .9163.
So if you’re so inclined to short this thing, that is the level you’re going to be watching, between .9160 and .9190. Say for example, you’ve got these verified highs up all the way to .9267 and we’ve got another one at .9274, so all stops above that short while below these particular levels.
British Pound versus U.S. Dollar
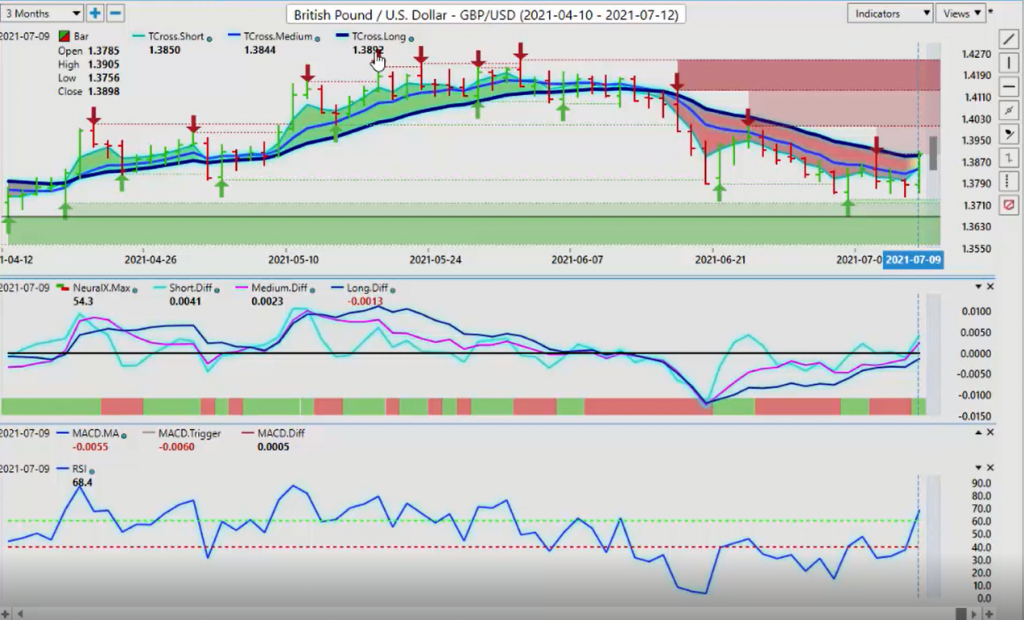
When we look at the pound-dollar again, the pound-dollar is simply a place of potential value for us to buy or sell US dollars. In this particular case, long’s carried the slight edge here.
Our short-term predicted difference and our medium-term predicted difference have sneaked above the zero line with the neural index. The RSI is suggesting that we have momentum building on the upside, but we must clear 1.3892. That’s the T cross long. If we can clear that, we’re good to go on the upside. On the downside, again, we use that predicted moving average by itself, 1.3844. This is a great example here guys of combining this blue line by itself and the VantagePoint predicted low for the day.
They’re both basically coming in right approximately around the 1.3840 levels. That is an excellent area to start looking at long trades. But in my respectful opinion, we are firmly above this yearly opening price down around 1.3650. We need to have stops below that, in my respectful opinion only. Again, I honestly believe it’s a sucker’s bet having stops between the yearly opening price and the current price here. One way you can do that is lower your position size at a secondary position if we were to get back down towards below 1.37.
But at the current time, I think that’s very unlikely based around the momentum we’re seeing in the charts.
U.S. Dollar versus Japanese Yen
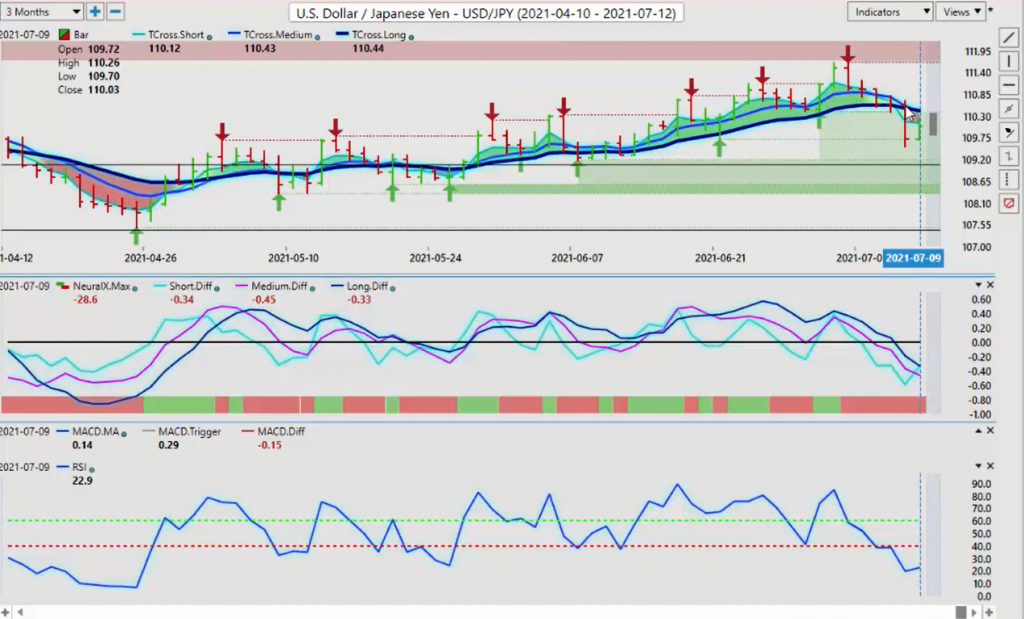
Now, with the dollar-yen, once again, the dollar-yen responding to gold prices moving higher as predicted in last week’s weekly outlook. Using a form of naked trading and only using intermarket correlations, I was able to predict which way these would go, but they’re dependent on gold. Dollar-yen shorts are still dependent on gold moving higher.
If gold starts to fail and back under 1,800 and stays under there the better part of the week, the dollar-yen will reverse very, very quickly. But our key levels to watch now, 110.4. We’ve had a relatively strong close actually at 110.03, but we are still firmly below that. So again, if we click on our F8 in our software, we get a very nice pivot area, 110.35. And once again, that predicted high for Monday is sitting right at that level also. In this particular case, if we’re shorting in that, if we’re so inclined, we look at the predicted high.
We look at the long predicted moving average by itself. And, of course, the most important part of this trade, the aspect of this trade, which is not based on any kind of conventional theories or indicators, the intermarket correlation that gold remains firm. As long as that happens, the dollar-yen will hold below this particular level. Now, with the three remaining currency pairs here, these are all equity-based currencies. In my respectful opinion, Canada is slightly different with a high correlation to oil prices.
And on a side note, the British pound and the Canadian dollar, both of these two currencies have a very high correlation to oil. So if oil is recovering, the pound-dollar longs and US-Canada shorts are pretty decent trades. And that’s just on a side note, just so you know. But when we look at the US-Canadian pair, as I warned in last week’s weekly outlook and to my own direct client base and in the VantagePoint Live Training Room, that we must clear this level at… That level coming in at about 1.2486, but we must close above it.
U.S. Dollar versus Canadian Dollar
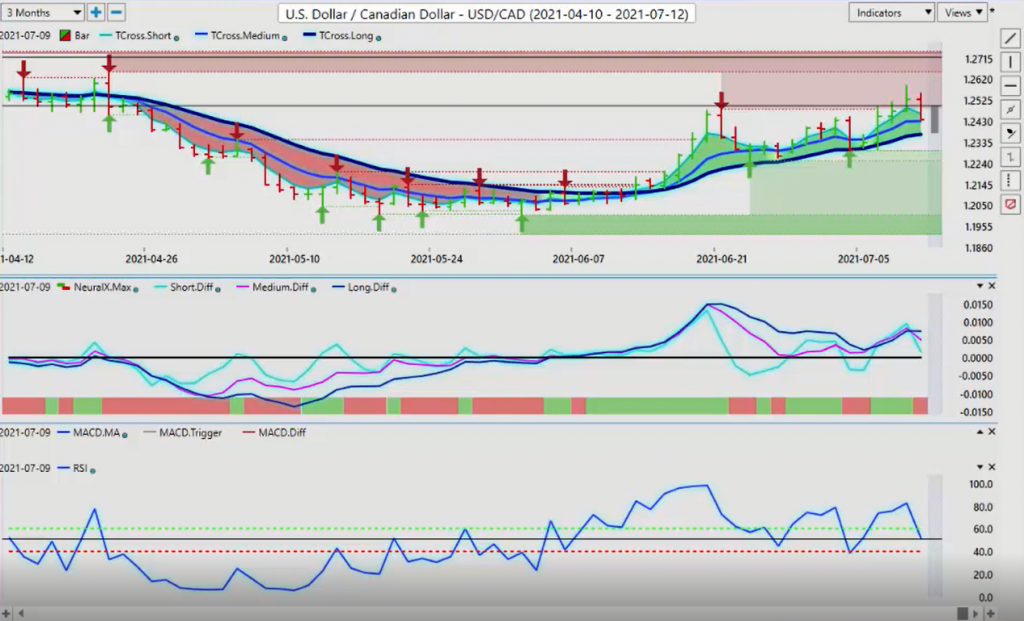
And I would prefer two days in a row. And as you can see, that’s not happening. But as I showed you at the beginning of the presentation, if we look at this bar, this big down bar on the US-Canadian pair, we can go over to the S&P 500 and there’s an answer as to why that happened. And again, it’s not based on conventional theories, wave theories, this theory, that theory. It’s the intermarket correlation risk improved. They started dumping dollars and buying Canadian dollars. This is what we need to understand in our trading as a foundation.
If you want to apply additional indicators, any kind of additional theories of that, then all the more power to you. But like a house, we start with the foundation of the house and we build up from that. That is the easiest way for me to say it. So again, if you are a proponent of the different theories of trading out there, Gann theories, Elliott, all these different theories, then again, just make sure you have the proper foundation under you to understand that an intermarket correlation will immediately trump any of those types of indicators.
An intermarket correlation has absolutely zero lag. You’re not waiting for anything. You’re not counting things. You’re not doing any of those things. Understanding that if you have the line in the sand on those intermarket, then you will know exactly what to do with these. The US Canadian right now, we have major support sitting down at 1.2370. We must break down below that. The first stage of that process is breaking down this predicted moving average to the individual one, so 1.2451 to 1.2480.
Around the 1.25 mark is a reasonable area to start the week with shorts on this, providing stocks hold their ground, right? If stocks hold their ground, the Canadian dollar, the Aussie, the New Zealand, they’re going to remain pretty strong. We know exactly where that level is.
Australian Dollar versus U.S. Dollar
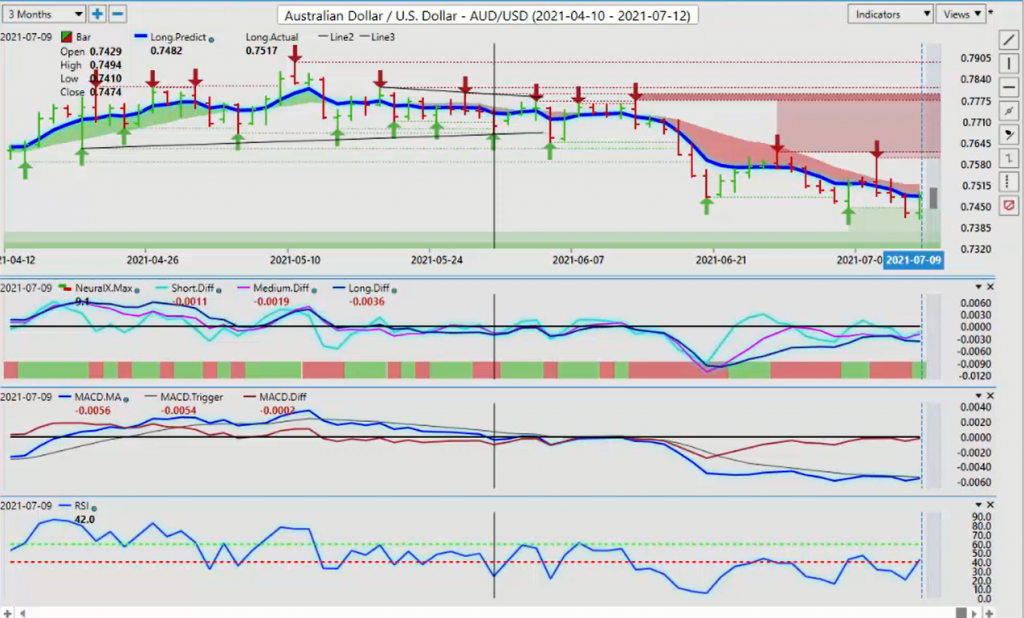
The Aussie and the New Zealand are no different. Yes, they are still in a downtrend. They’re below their yearly opening price. They’re below the T cross long. But when we look at that, .7535, if we click on the F8, we’re looking to close above.
We could have some very good value on longs, but the equity markets are not overly strong during summer months. I’m not expecting additional big moves on the S&P. I’m just expecting more sideways. We’re looking for Aussie to get a little bit of a bump. Now, the main indicators are saying that still the neural index is onboard, but that’s really about it, guys. We’re trying to clear this level of .7482. We didn’t get that on Friday. Maybe we’ll get that early in the mid week on further dollar weakness as stocks and gold climb.
New Zealand Dollar versus U.S. Dollar
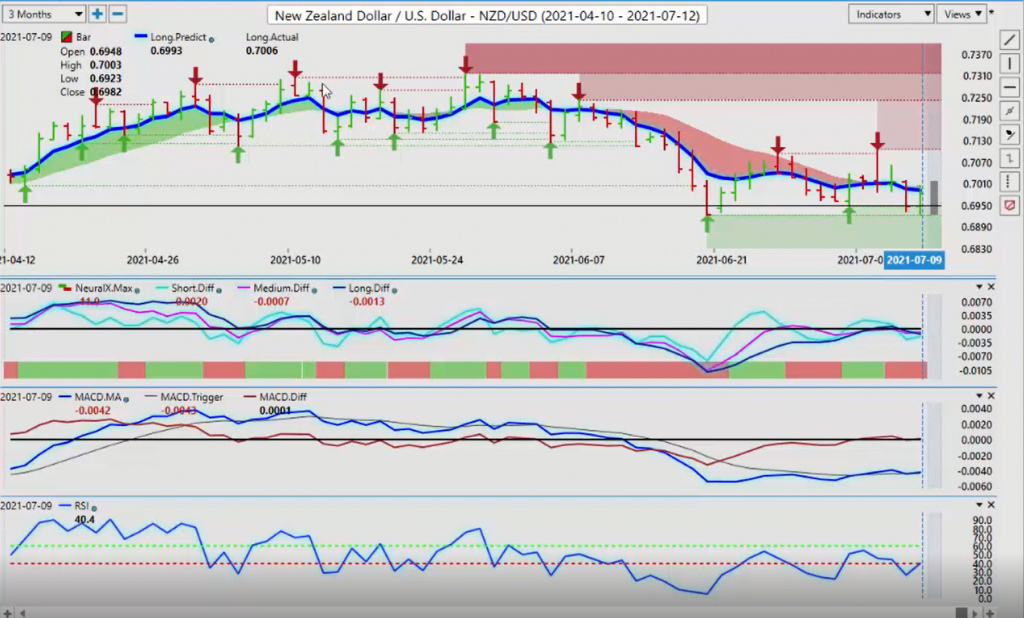
We will continue to monitor those things and also pay a very close attention to New Zealand-US, because, again, we’ve got very strong support down here. That’s coming in at the low of .6923. We just need to break above the T cross long. Now, we’ve got a fresh buy signal starting on New Zealand with the MA diff cross, but the neural index is not onboard. The neural index, if it was on board, it would not be red. It would be green. Maybe that’s another good place of value to start selling US dollars, right? Because, again, we just have to clear this.
But if we click on our F8, you can see the level. Another way of doing this, .6993, putting limit orders just slightly above that, buy limit orders just slightly above that level if we anticipate that the equity markets are going to go higher and we’ve got a broader US dollar weakness. With that said, this is the VantagePoint AI Market Outlook for the week of July the 12th, 2021.


