


VantagePoint AI Market Outlook for the Week of July 20, 2020
VIDEO TRANSCRIPT
Hello everyone. And welcome back. My name is Greg Ferman, and this is the Vantage Point AI Market Outlook for the week of July the 20th, 2020.
U.S. Dollar Index
Now, once again, to get started this week, we’re going to begin with that very important US dollar index as we have several markets that are at critical breakout points. The dollar index, recovering somewhat towards the latter part of the week, but still unable to make any significant gains or overtake the TCross Long.
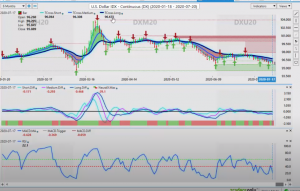
US. Dollar Index
We have several key pivot points here between 9606 that goes all the way up to 9667 on the dollar index. And as we can see here, we’re unable to break through these critical levels.
What we want to look at is any kind of divergence in the market here. We can see that the medium-term trend against the long-term trend is trying to reverse back to the upside, warning us that the dollar still could rebound off of these key verified support levels.
We’ve come down to those levels, touched that level exactly on July the 15th, which is directly consistent with last month’s swing-low on June the 10th. So we’re looking to see if this level can hold, however, we have an even bigger support level coming in at 9447.
S&P 500 Index
The only way that that level can be tested, in my respectful opinion, is if the S&P 500 continues to advance. That will put downward pressure on the US dollar and upward pressure on a number of other currencies, like the Aussie, and the New Zealand. Even the Euro and the British pound may be able to recover somewhat.
Once again, when we look at our key VantagePoint predicted moving average by itself, that key pivot area is 9624. If we can overtake this 9624 level, that will take the pressure off the dollar, at least in the short term. But if it cannot overtake this level, then the dollar could see further downside with a risk on environment.
Now, if the mood turns nasty again with equities and the COVID virus, the EU summit this weekend, all of these different factors could benefit the dollar or they could sink the dollar. So we’re at the mercy of some of these key events. But when we cross-reference this to the S&P 500, the S&P 500, once again, back up at the yearly opening price, 3237. We’re seeing if we can push higher here.
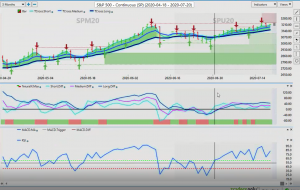
S&P 500 Index
The RSI is starting to turn back up. And again, using the RSI with a 60/40 split, or just using it if it’s above or below the 50 level, is a far better way to use it, versus overbought and oversold. Trading off an overbought or an oversold condition, usually has an accuracy of about 50%. Those are just not good enough odds here, guys.
Basically, you’re telling the market to go up or go down when it’s oversold or overbought. We try and avoid that type of trading because it’s very, very dangerous in these types of markets.
When we look at the S&P 500, once again, we put in a slightly new high this week. We’ve gone up to, again, the 3231 area, only to see it back off yet again. Now, when we look at that key VantagePoint level, we can see that the entire trading week, the market has been in contact with the VantagePoint Long Predicted, which is the predicted moving average based around the correlation to 31 other markets. So we use that level as a pivot area for potential entry points.
Now our medium-term, crossing our long-term predicted difference, is, again, it’s warning that this trend may not be that strong. So we’ll continue to monitor it, but for 4x traders, equity traders, just understand the correlation between the dollar and the S&P, that it’s an inverse correlation currently. Meaning of course, that if the S&P breaks out to the upside, the dollar will break down very quickly.
GOLD
When we look at gold, gold continues to struggle up here, but it’s holding its ground. We’ve made a high again, another new high this week, which looks pretty good. We haven’t gone up as high as is 1829, but again, we are still holding above this key VantagePoint TCross Long, 1795.
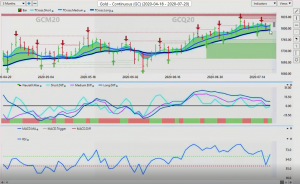
GOLD
My concern is the predicted differences are continuing to drop lower. The good news is, they’re starting to flatten out here and our RSI has come down, kissed the 40 level, bounced back up, and now we’re at the 60 level. So there’s certainly some evidence that the dollar could come under additional selling pressure this coming week.
Crude Oil
But the one thing that I am looking at also here, with that correlation to the equity markets, is of course, light sweet crude oil. We have been stuck at this level up here, basically going back into early March, or excuse me, early June. We can see our predicted differences are running completely flat.
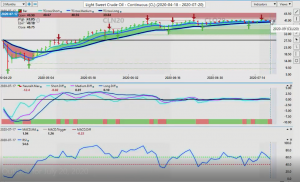
Crude Oil
But our RSI is telling us that we’re losing momentum here. It doesn’t necessarily point to a trend reversal, but it warns us that there isn’t a lot of upward momentum above $40 a barrel. So we want to keep an eye on that one also for a potential short.
Euro versus U.S. Dollar
Now, as we look at some of the currencies for next week, we can see that the Euro is up, moving towards a very significant resistance zone at the high of 11493. I do expect some volatility immediately out of the gate on Sunday night, because of that EU summit. I’m hearing different rumors that there’s different packages being offered. Nothing concrete as of Saturday afternoon as to what’s going on.
Because again, this is an outlook, not a recap of something that already happened. Just to clarify, this is a forward-looking outlook as to what we’re doing for the trading week.
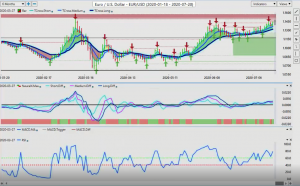
EURO versus U.S. Dollar
So when we look at this, in most cases your order flow traders and your big banks are going to be targeting these very significant verified resistance zones. In my respectful opinion, if we can get above, on the Euro, if we can get above 115, and basically permanently stay above 115, we will see a fresh new trend in the Euro. We’re just not there yet, guys.
The predicted difference is pointing down. That is definitely reason for concern here for longs at this particular level. We also have the event risk.
If we think about the bailout package that’s basically being negotiated right now for the Eurozone, it very much could be like the US dollar, where the Euro gets initially gets a bump from that, but then you buy the rumor, sell the fact. Then a few days later, the Euro’s plummeting again. So be careful of a false break up at these particular levels. Very dangerous level, potentially, to be buying the Euro.
U.S. Dollar versus Swiss Franc
Now, with the US/Swiss Franc, we’ve turned around this week, as we anticipated. However, we’ve gotten all tangled up again in that critical VantagePoint TCross Long. 9440 continues to hold this particular pair to the downside. Our predicted differences are rolling over a little bit, our RSI losing momentum. And of course our neural index is down.
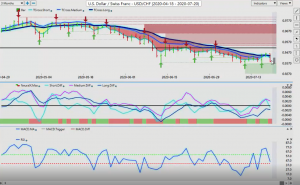
U.S. Dollar versus Swiss Franc
So for next week, 9440 is the level we want to watch. But if we also bring in our blue line by itself, we have closed below that key VantagePoint TCross Long at 9415, however, we’ve closed below it on a Friday. Always remember that Friday, very thin markets, liquidity is low. Monday is often a reversal day.
So be cautious again with this one, selling down around this particular area. And, again, keep a very close eye on the dollar index and that 9570 area.
British Pound versus U.S. Dollar
Now, with the British pound, again, the pound is really somewhat gotten pounded for the most of the week. But again, that critical TCross Long, 12523. Using these pivot areas in your trading allows you to see better an area to wait for your position. So if you wanted to go long on the pound/dollar, the TCross Long at 12523 would be that level.
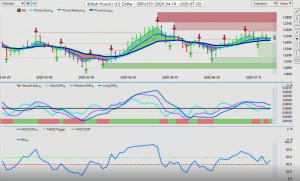
British Pound versus U.S. Dollar
But with the medium term crossing the long term predicted difference, that told us that this is not a very good level to buy, up at this 12663. Which we discussed in last week’s AI Weekly Outlook before the market opened, that this was going to be a problem area.
So again, we’ve come up and tested around this area multiple times last week, failing every single time. So again, identifying these verified support and resistance zones is critically important. We have an additional support low at 12480, and again, the TCross Long from VantagePoint at 12523. So if we were to buy this pair, those are the levels we would look at.
But right now, it looks like the pound is starting to recover a bit. We didn’t break below the 40 level on the RSI, and we’ve recovered back above the 50 level, but just barely. So again, this pair consolidating within a tight range between the 12480 and the upper limit high at 12669. We’ll continue to play this range as long as it holds.
U.S. Dollar versus Japanese Yen
Now with the dollar/yen for next week, once again, the dollar/yen very often is going to follow gold prices here, guys. It’s not just equity, it’s inverse to the equities, but it’s positively correlated to gold. So if gold continues to advance, the dollar/yen will move lower.
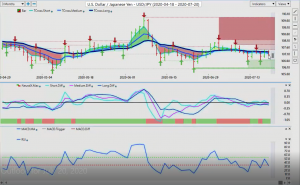
U.S. Dollar versus Japanese Yen
Now again, significant resistance as we start… Again, moving into summer trade here. I wouldn’t expect a lot of movement in August, but we could get a breakout on the major markets before August 1st, only to see the market go flat the rest of the month of August. I couldn’t tell you how many times I’ve seen that in summer trading.
So we’re looking for a bigger move, but the signal here from VantagePoint is warning us it may not be what it appears to be. The medium term crossing the long term predicted difference. The neural index is positive. But the RSI is saying that we’ve got momentum building to the downside.
So watch the pivot area 10725. As long as that’s holding, then there’ll be additional downside pressure on this particular pair.
U.S. Dollar versus Canadian Dollar
A pair that’s becoming increasingly popular, actually in the 4x market, the US/Canada, once again, still moving sideways. We’re exactly where we were last week here, guys. So for now we play the lower limit. We buy the lows and sell the highs until this particular breaks.
A little trick that I can share with you, that in order for this to break to the upside, the S&P 500 must crash below the levels we discussed. Basically the S&P 500 would have to turn very bearish to drive US/Canada to the upside. If the S&P 500 is the one that breaks out to the upside, then shorting US/Canada will be a very, very good play.
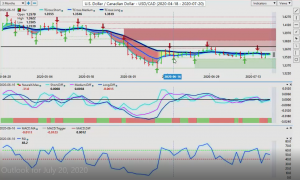
U.S. Dollar versus Canadian Dollar
We know where our key levels are. Using our verified zones, our high 13646, to approximately the 13715 area. And very, very strong support sitting down between 13490 and about the 13471 area. 71 to 86 level. And if we get below this particular support level at 13316, we’re basically talking a complete trend reversal on this particular pair.
My optimism on that in the current market environment remains heavily, heavily guarded. So watch our main levels here for now. We’ll buy the bottom, sell the top. We’ll use the neural index. It’s green, telling us we’re going to go higher. The RSI is basically flat, so we’ll continue to monitor this pair. But again, it’s going to need a breakout on the S&P 500 to break this channel on US/CAD.
Australian Dollar
Now, the Aussie and the New Zealand, basically the same trade here, guys. We’ve made a slightly new high here. We’re still moderately bullish, but let me be clear. Inter-market correlations are definitely what will determine the next move on the Ozzie, the New Zealand, and even the CAD.
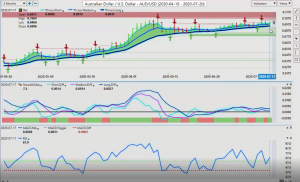
Australian Dollar versus U.S. Dollar
So if the S&P goes positive for the year, and it stays positive for the year, the Ozzie will turn positive for the year also. Get above its yearly opening price, above the 70 cent mark. But it’s going to need the help of stocks here, guys, for that to happen.
New Zealand Dollar
And the New Zealand dollar is no different. Right now they are holding the key levels. The TCross Long on New Zealand, 6516. And the TCross Long on VantagePoint, that key level, 6941. As long as those levels hold, then the long trade is the play. But, again, if the S&P 500 turns further negative, the Ozzie and the New Zealand will be pulled down with it. And the US/CAD will be taken higher.
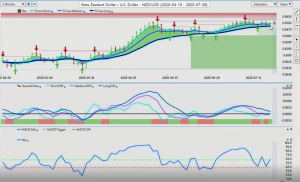
New Zealand Dollar versus U.S. Dollar
So once again, we’re getting closer to the month of August, where we’re going to go into heavy consolidation. The likelihood is, we’re going to go to heavy consolidation. But we’ve still got a relatively busy week ahead of us. But as long as you know your levels, guys, we will all do just fine.
So with that said, this is the VantagePoint AI Market Outlook for the week of July the 20th, 2020.
Are you using A.I. yet?


