


VantagePoint AI Market Outlook for the Week of June 29, 2020
VIDEO TRANSCRIPT
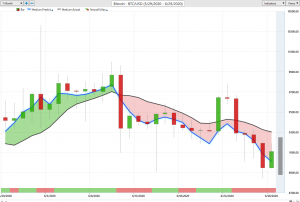
U.S Dollar Index
Hello everyone, and welcome back. My name is Greg Firman, and this is the VantagePoint AI Market Outlook for the week of July the 1st, 2020. Now, to get started this week, we’re going to begin where we always do, within our market correlations, but we’re going to look at things a little bit differently this week, respecting the extreme conditions that we’re dealing with, with the COVID stuff and all of these things.
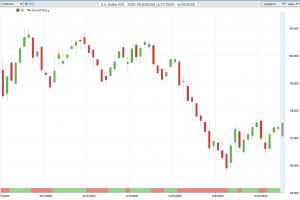
U.S. Dollar Index
The one thing that I’ve noticed that most systems are missing is inner market analysis. Now, when we look at inner market analysis from a direct standpoint, we can see there’s two main driving factors in all of these financial markets, the dollar and the S&P 500. And what I’m briefly going to do is explain to you how these inner market correlations are driving the commodity markets, the currency markets, all of these markets are being driven by inner market correlations.
So when we’re trading pairs like Aussie-US, New Zealand-US, US-Japan, or even Bitcoin or gold, there is a huge inner market component to our current trading conditions.
S&P 500 Index
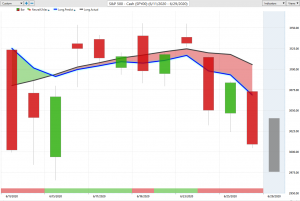
S&P 500 Index
So when we look at, it in my respectful opinion, just about everything globally is running off the S&P 500. If it’s a risk-on environment, the S&P 500 is moving higher, then most of your currencies are doing well. The dollar’s doing poorly. Now with this most recent sell off on the S&P 500, you can see that that’s putting upward pressure on the US dollar index. Now the dollar index has not broken through it’s key level that we discussed in last week’s Forex weekly outlook at this 97.50 area. It’s failed multiple times. But what we can further assess is that we have support building on the dollar index also at 96.38. So we’re trapped in a very tight range, going into a period of known dollar strength.
Euro versus U.S. Dollar
Euro versus U.S. Dollar
Now, with the equity markets pushing lower, it is possible that this is just the end of the month, but in most cases, the end of the month flows favor the S&P 500. But the main thing we want to look at is, what markets are dependent on the S&P 500? So when we look at this right now, we can see that as the S&P 500 moves lower, it’s pulling the Euro down with it. Now, prior all of these COVID lockdowns and all the rest of this stuff, we can see that there was a clear inverse correlation between the S&P 500 and the Euro-US currency pair. That has changed. The correlation is now turned positive. When we look at pairs like New Zealand-US, we can assess here, the correlation is virtually 98%. When the S&P 500 goes down, it pulls the New Zealand-US pair down with it.
Australian Dollar versus U.S. Dollar
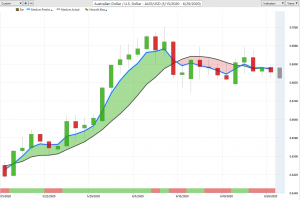
Australian Dollar versus U.S. Dollar
The same thing could be said about the Aussie-US. When we look at the Aussie-US, these two charts between the Aussie and the S&P 500 are almost identical. Now, the key thing to understand here, guys, is the Elliot wave, Fibonacci, accumulation, distribution, all these different wild and wacky indicators that market participants like to use have been rendered virtually useless against these powerful inner market correlations. So, again, this is simply a review of those correlations and how powerful they become based around the COVID virus, the global lockdowns, all these things.
British Pound versus U.S. Dollar

British Pound versus U.S. Dollar
When we look at the British pound, the British pound sold off again, but it’s sold off because of the S&P 500. Not necessarily because of Brexit or because of a lack of demand for British pounds. It moves to a risk off environment. And it’s amplified when the S&P 500 moves lower. It drags these currencies down with them.
Bitcoin
Bitcoin
So when we look at things like Bitcoin, even Bitcoin is clearly following the S&P 500. These charts are virtually identical. So if you’re a Bitcoin trader, again, this is a presentation that simply highlights these powerful inner market correlations that you need to know. So using these inner market correlations and the blue line by itself, it’s easy for the eye to follow the blue line by itself with a correlating pair or correlating market.
GOLD
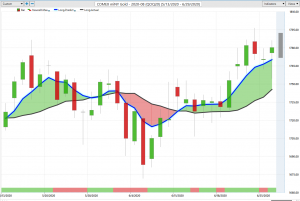
GOLD
When we look at gold, again, very interesting that there was an inverse correlation prior to March, and then this all of a sudden changed. We can see that gold and the S&P 500, for about two months, moved up and down together. But gold has decided to break away from that correlation. Now, gold is moving higher and the S&P 500 is moving lower.
So again, these are all correlations we want to watch. One of the more powerful correlations that I’ve seen, also, is the EWZ to the S&P 500. It’s been a leading indicator. So when we look at this ETF on the EWZ, these two markets between the Brazilian EWZ and the S&P 500 are virtually identical. One can be a leading indicator for the other. But again, it’s understanding that most of these currencies are running with the S&P 500. If we look at the US-Swiss Franc, it’s really gone kind of crazy here. It’s all over the map. And it basically all started with when the COVID, the lockdowns and all this started in the middle of March. But prior to that, the correlation was clearly 100%. The S&P 500 goes lower. US-Swiss Franc goes lower. The same thing with dollar-yen. It’s having trouble figuring it out, but largely the S&P 500 and the dollar-yen move up and down together.
So when we look at this, split our screens, we can clearly see what is going on with these financial markets. Everything is reliant on the S&P 500, either moving up or moving down. So from here, now we can move over into our weekly outlook. Now, once again, when we come back to our main charts, understanding these inner market correlations will trump all conventional indicators. This is what the charts clearly show us. The other markets are ignoring, again, conventional technical indicators, they’re even ignoring a lot of fundamental data. All of these markets are following the global equity markets, but more specifically the S&P 500.
So when I look at the dollar index, as we discussed in last week’s weekly outlook, the dollar must break through this critical resistance between, basically what I had stated in last week’s weekly outlook, that if the dollar is going to fail, it’s going to be between 97-50 and 98. I will reiterate that exact same thing. However, the dollar is building a good support level, and it does appear that it’s getting ready to break higher. My concern here, the RSI is turning sideways. Yet again, there is not a lot of momentum on the dollar, but in most cases, the dollar is strong into the first week of the new month. But bear in mind, we have a holiday short week. We have Canada Day on Wednesday, and I believe the Americans have the July 4th is being celebrated on, I think, July 3rd is going to be your holiday. That’s my understanding. So again, a very short, choppy, volatile week with the dollar still holding below key resistance.
When we look closer at the S&P 500. Once again, we are not making new highs here, guys, unfortunately. I would love to see the S&P 500 move higher so we can get back to, not a new normal. I’m not a fan of that terminology, new normal. Just back to normal. I think that’s a better term, because a new normal suggests that everything has to change, everything has to be different. We want to get back to just a normal here. That’s what I’m looking for. So if we can hold this level. Right now, we have very significant verified support that needs to hold at 29.98. So if you’re an S&P 500 trader, or if you’re a currency trader, or if you’re a commodity trader, or you’re a Bitcoin trader, this is a very, very significant level for you.
If this level holds and the S&P 500 turns around, then most of your currency pairs will turn around. Euro will move higher. Aussie will move higher. The CAD. Bitcoin will go up. Gold will back off. These are all the things we look for in an outlook. And again, this is an outlook, not a recap. We’re talking about a forward looking trade plan the week. So this level of 29.98, watch out on Monday for them to try and run this area only for it to reverse late day Monday or Tuesday.
GOLD

GOLD
When we look at gold, gold is not out of the woods here by a long shot. We have huge resistance up here. Now, this resistance is at 18.01. In my respectful opinion, if we make a clean break of 18.01, then the COVID cases will be back, the governments will be talking shut down again, lock downs, and all this type of stuff again. And if that’s the case, then obviously gold is going to go considerably higher.
But just remember, you’re at the mercy of the politicians, the WHO, all of these different factor and people that are making decisions for us, again, will ultimately affect your trading. So we have to be mindful of where the support level is on gold, which is down at 17.54 and significant resistance. The indicators from VantagePoint right now are saying, they’re starting to flatten out here, and this would be perfectly normal going into a period of known dollar strength.
Crude Oil
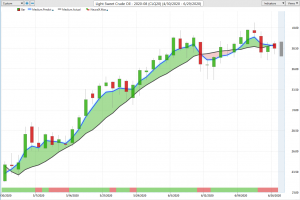
Crude Oil
Now with oil for next week, again, the inner market correlation is still the equity markets or the S&P 500. If the S&P 500 fails and breaks down below 29.98, then you can pretty much take it to the bank that oil’s going down with it. We would be moving into, potentially, a fairly significant risk off environment. So watch your levels here, guys. As I always say, as long as you know your levels, you can trade off them. 37.54. If we break down below the T cross long, that will suggest a reversal in oil. But remember, guys, we need to close below this level at least two days in a row.
And when we look at the additional correlated markets here, as we had already taken a quick peek at, we see that Bitcoin again, under pressure, is it possible, excuse me, that Bitcoin is a leading indicator now for the global equity markets? I would say that that’s reasonable. However, Bitcoin is still within its overall range. In this particular case now, we have good support on Bitcoin at 89.12, we have additional support, very significant support, down to 86.47. And of course, the 82.01 level. In order for us to get down to these levels, guys, what would it need to happen is the S&P 500 would have to break down below 29.98, stay below that level, and break to the downside. That would potentially pull Bitcoin down with it.
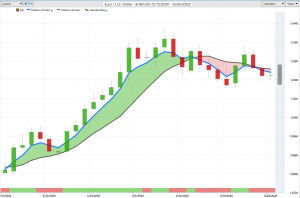
Now, as we look at some of our major Forex payers, the Euro-US, once again, the support line in here is still sitting there from last week when I drew it in from last week down around this 111.66. But you also have the yearly opening price sitting around 112. Now, again, this is a very dangerous level to trade short at, in my respectful opinion, unless we get confirmation from the equity markets. More specifically, the S&P again. If it breaks down, then based around the inner market correlations, it’s telling us it would pull the Euro down with it.
And again, this correlation is rather new, because prior to the COVID, the correlation was inverse between the Euro and the S&P. So right now, for this week, we want to see if we can hold above 112.19 by Tuesday. Monday is always a fake trading day, guys. The price is very seldomly accurate on Monday. I always tell my own direct clients to just stay out on Monday, observe the market, and be prepared for a reversal. So if the Euro makes a big move down on Monday, it’s probably going to reverse on Tuesday or vice versa.
So the main thing is, know your levels. Watch this level at 112.19. If we click on our F eight on our VantagePoint software, this is our moneymaker rate here, 112.38. If we hold below 112.38 on Monday morning, it’s probably going to take a bigger move down. But if we get above 112.38, the pressure would be off the downside and it would start moving higher. That would suggest that the equity markets are going to recover. Now, once again, with the US-Swiss Franc, it’s the Euro-US counterpart, we would watch this level very closely here. Our T cross long is 95.11. We would be looking at for the market to push this, the bulls to push this through this level. If they can push it through this level, which at this particular time, my optimism remains heavily guarded based around the risk off scenario, but the indicators from VantagePoint are suggesting that that could very well likely happen.
We’ve got our MacD crossing, our RSI above 60, our predicted differences are rising. And more importantly here, while we’re stuck on this resistance level of 95.11, when we click on our F8 in our VantagePoint software, we get a different pivot area. 94.74. That’s the level we want to watch. As long as we’re holding above 94.74, we have a real shot of this pair going higher.
British Pound versus U.S. Dollar
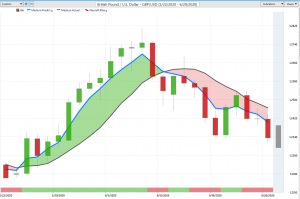
British Pound versus U.S. Dollar Index
When we look at the British pound-US dollar, once again, a lot of factors driving the British pound lower. Brexit issues, coronavirus, the S&P 500, but the key market, in my respectful opinion, that’s driving this pair lower is the S&P 500 based around the inner market correlation that I showed you at the beginning of the presentation. So, I would strongly recommend that you watch these inner market correlations and be mindful of them that that’s what’s driving all of these markets. So for this coming week, 124.71, as long as we’re holding below that, then shorts are viable.
We also want to click on our F8 and bring our blue line, our predicted moving average, by itself at 124.28. So you can see how quickly I can identify two major resistance points. The 124.28 area, up around the 124.80. But if we break above that level, the pressure would be off the downside and we would reverse. Now, we also have a verified support level at the low, 123.35, and you can see that we are closing right on that verified support. So be very cautious of a bear trap with this particular pair.
Now, dollar-yen for this past week is, once again, very confusing. As the equity markets crash, the S&P crashed, the dollar-yen was turning higher. This very often happens in the week of the non-farm payroll numbers. So if the dollar-yen can get above 107.24, then we could be getting ready to move higher with this particular pair, which is also suggests, not confirmation, but suggests that the S&P 500 is going to hold the 29.98 mark. So keep an eye on dollar-yen. It’s a very important pair.
And again, if we use our blue line, our predicted moving average by itself, we get the long predicted. 107.01 is a decent pivot level to buy from. So if this level, 107 holds, than a long trade is there, but that could also be an indirect warning that we would have a long on the S&P at the aforementioned level of 129.98. So again, watch your levels, know your levels, and be mindful of these inner market correlations.
New Zealand Dollar versus U.S. Dollar
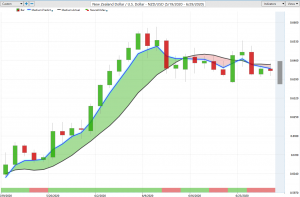
New Zealand Dollar versus U.S. Dollar
Now, with our three main commodity, what used to be our commodity currency, the Aussie, New Zealand, the CAD, they are clearly not commodity currencies anymore. They are equity currencies. And what I mean by that, specifically, is that they are asking absolutely going to follow the S&P tick for tick. So right now, the US-CAD is advancing on the S&P 500 weakness. So what you need to understand as a trader, is that the S&P is driving the US-CAD pair up or down. The same with the Aussie, the same with the New Zealand. It’s all the same trade. So the S&P, if it continues to free fall down, then the US-Canada will take out this resistance level at the 137 mark very, very easily.
You can see that we’re closing right on that particular level. Order flow traders will watch this level. They prefer to trade at the swing highs and the swing lows. They don’t like to trade in the middle of the range, and I don’t blame them, because it can be a dangerous area to trade. But right now we do have a very mixed bag here. We have our predicted difference crossing to the downside at a known resistance area, but the predicted differences are starting to turn back up with the neural index. So we would monitor US-Canada on Monday. We would not necessarily trade it, because again, this particular pair is prone to reversals on Tuesday. So keep an eye on the level. In my respectful opinion, the order flow traders are probably going to come out of the woodwork here, guys, between 137 and the secondary resistance area at 138.32. That is more than likely where they’re going to come out looking to short this particular pair.
Now again, with the Aussie and the New Zealand, the Aussie is putting up a very strong fight here. The bulls are trying to hold the line here at 68.52. Luckily we have the VantagePoint software to give us the key pivot areas here. You can see that virtually every single day for the last seven or eight trading sessions, we’ve been banging up against the T cross long, 68.52, and each time we’re coming off that. But we’re coming off it smaller and smaller. The neural index is down. The predicted Mac D is down. The RSI is not breaking below 40, so we don’t have a lot of downward momentum. So here’s the trick, guys. The momentum to the downside will be immediate on a sell-off of the S&P 500. If it breaks down lower, it will pull the Aussie down with it immediately, regardless of any economic data, COVID, any of this stuff is going to be irrelevant. If the S&P goes lower, it pulls this down.
But we know the level to watch. That’s the key advantage using the VantagePoint software, is we know this level. 68.52. If it breaks down below there, then get your longs off the table and look for shorts. The same thing would apply to New Zealand-US. When we look at New Zealand, 64.12. You can see, we’re hugging the blue line, the predicted moving average. If we break down below this, that’s going to trigger a much bigger short here. But again, when we look at it, the predicted differences are picking up on something. The RSI is picking up on a lack of momentum, but it could be argued, at 38.6, that the New Zealand is also getting ready to fall. But again, the key driver for next week is going to be the S&P 500.
So with that said, this is the VantagePoint AI Market Outlook for the week of July the 1st, 2020..
Are you using A.I. yet?


