


VantagePoint AI Market Outlook for the Week of March 9th, 2020
VIDEO TRANSCRIPT
Hello everyone, and welcome back. My name is Greg Firman and this is the VantagePoint AI Market Outlook for the week of March 9th 2020.
U.S Dollar Index
Now, to get started again, we begin where we always do with that very important US Dollar index. Now, with the dollar index, what we’re seeing in the VantagePoint software, again, this is an outlook, not a recap, we’re looking at prepping for next week’s trading and showcasing some of the VantagePoint strategies. When we’re looking at this right now, we want to make sure that we’re looking back a little bit further in time to find these verified support and resistance zones. Now, the Fed has once again interfered in the financial markets, cutting 50 basis points. In my respectful opinion only, probably one of the worst rate cuts in history. I’m still not grasping why they’re doing this for the most part.
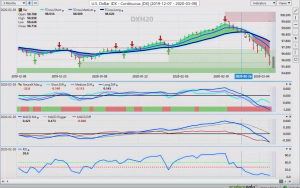
If we look at the unemployment numbers out of the US, very, very strong. There is nothing here pointing towards a recession at this current time. The dollar is coming well off of its high, getting pounded lower by that Fed intervention here. But again, we’re coming back, using our VantagePoint charts, coming back into July of 2019, down in this low area of 95.36. We’ve made a full retracement back down, so now we’re going to see if the dollar can recover. In most cases, at the end of the first week of the new month, the dollar is usually weak. There’s a lot of things going against the dollar here right now, but mainly the Fed interfering in the markets. So again, when we look at these indicators, we first want to make sure we’re identifying that we actually do have some verified support back here, and order flow traders tend to watch these major reversal points or retracement points.
So again, we’re going to be watching this 95.27 area very, very closely. We’re already seeing warning signs in the VantagePoint software with the medium-term crossing the longterm predicted difference. However, we can also assess here that the neural index is not an agreement yet. Now, another great example of why we want to make sure we’re being very cautious about trading around things like overbought, oversold accumulation distribution because these signals very often produce results like this. The market is completely ignored, the oversold condition, excuse me, and continued to push lower with the primary trend. So again, we’ve got to be cautious about that. Just because something is oversold, that doesn’t mean it has to go higher.
Next week for the dollar, again, we want to watch this area very closely and keep another close eye on the predicted difference in the neural index. If we can get that neural index turning positive, we may be able to move higher. Now, what we can assess here, very clearly, is the extremely high correlation, between the S&P 500 and the US Dollar. They’re moving up and down together. I’ve heard some pundits talk about how the Euro is being negatively affected by the selloff in the equity market. That’s simply not factual, guys.
S&P 500
And by looking at a basic chart, we can see that. We can see that right now, that as the S&P 500 is pushed lower, the Euro is absolutely benefiting from this. Again, when we look at these direct inner market correlations, this is what we want to see. Not listen to somebody on TV, but look at our actual charts. When I look at again, the Euro is actually fairing very well. So if there’s any kind of reversal in the S&P 500, higher, every time the S&P 500 turns around, that’s having a positive effect on the dollar and a very negative effect on the Euro.
When we look at our overall range on the S&P 500, we want to make sure we’re identifying this. This is exactly where we were last week. We have this 28.58 level that continues to hold. However, in last week’s weekly outlook, I also warned everybody about the 50% retracement level here. I am not a big proponent of Fibonacci, but I do support grid trading. When I look at the high, the low, the high minus the low, divided by two, basically gives us the center part of this particular range. This is where the market is failing, right around this 50% mark. So we’ll continue to monitor this to see if we can break above that. But for now, all of the resistance on the S&P is sitting around this 31.33 area. We’ve come up to this level multiple times and failed.
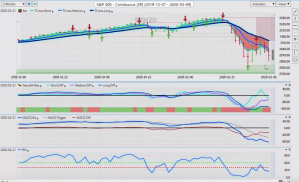
If we look at the VantagePoint long predicted, using that predicted moving average only as a pivot area, you can see that we were only last week able to close above that level one day. I’ve talked about this at the seminar, I’ve talked about it here. A two day rule. I want to see if it’s going to reverse. I want to see it close above the VantagePoint predicted moving average at least two days in a row to take the pressure off the downside. But at the current time, it appears that there’s still more downside ahead for the equities.
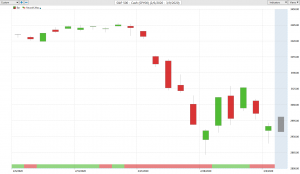
Now, when we look at oil, oil again, having a very, very rough week. As I talked about in last week’s Forex Weekly or AI Market Outlook, that we’re looking for that correlation between the S&P 500 and oil
Light Sweet Crude Oil
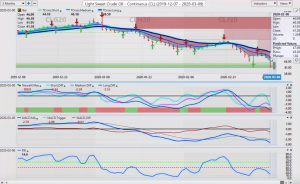
Now, when we look at oil, oil again, having a very, very rough week. As I talked about in last week’s Forex Weekly or AI Market Outlook, that we’re looking for that correlation between the S&P 500 and oil. It’s still very strong here. As stocks get pounded, oil is moving lower. OPEC trying to interfere, they were unsuccessful, so oil still looks like it has more downside ahead. But again, we would expect oil to rally either way in another month or two. As we start moving in, coming out of the winter into summer driving season, oil usually bounces back on that seasonality. We’ll keep an eye on that, but for now, still looking rather bearish.
Gold
Now, gold has had a fantastic week, a recovery week, and the Fed cutting 50 basis points, that once again, in my respectful opinion, it’s very difficult to call it a free market when the Fed is constantly interfering in these markets. If they had have just stayed out of the market, in my respectful opinion only, the markets would have recovered on their own. It is a free market. But the Fed feels the need to interfere. It would not surprise me one bit if this Fed is actually hiking again into the third and fourth quarter of this year because again, they’re like a retail trader. They’re reacting to every little piece of news out there, trying to fix something that isn’t necessarily broken. When I look at this right now, gold has made a full retracement back up to its most recent high. That certainly does have a bullish tone to it. But if the coronavirus starts to back off, we could see gold, again, start to lose momentum here.
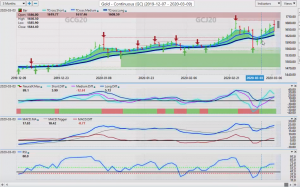
But looking at the main indicators, it does suggest we’re getting ready for another push to the upside. And again, we’ve got more central banks coming this week. The ECB, we’ve had the Bank of Canada’s cut 50 basis points. The ECB doesn’t have a lot of bullets left in that particular gun though, so we’ll see what happens here. But right now, gold is turning around back up to the upside. If we look at our main daily pivot area, you can see, there’s that two day rule again. Two days closing above that blue line and gold starts to push. But again, we don’t want to ignore these very significant, verified resistance levels. So gold potentially could have a tough road as we start pushing towards the 1700 mark.
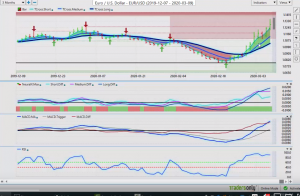
Euro
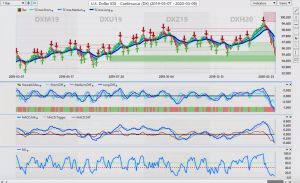
Now again, as we looked at the Euro, going into the currencies here, once again with the Euro, the Euro is pushing higher, but again it’s feeding off the weakness on the global equity markets. Now the ECB, the European Central Bank, is coming out on Thursday. I suspect that could be negative for the Euro because they’re going to have to do something. We’re just not really sure what. We can see that there is a sell signal, it is forming here the medium-term crossing the longterm predicted difference. But again, when we look at this European currency, the Euro currency, it is absolutely benefiting from this global sell-off in stocks.
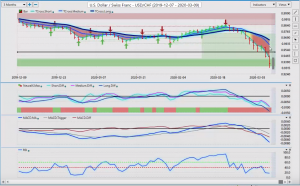
U.S. Dollar/Swiss Franc (USD/CHF)
When we look at additional currencies that mirror the Euro like US Swiss Franc, we can see that it’s been pushed aggressively lower here. Now, once again here, guys, we want to come back and use our verified zones, and as you can see, as we start coming back, we have to come back quite a ways to find some good support here. Now, that support level there, again, is all being breached, pushed down into the 93 levels. Again, if those stocks can turn around, the global stock markets can settle and start to turn around, we could see a very good buying opportunity on this particular pair. But for now, I would strongly advise to limit trading with payers like dollar, Yen and US Swiss Franc because they are risk off currencies. If the stock markets continue to crash, these two pairs will crash also.
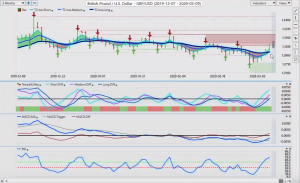
British Pound/U.S. Dollar (GBP/USD)
Now, when we look at the British Pound-US Dollar, once again with the British Pound-US Dollar, we’ve had a good recovery buy signal that we talked about in last week’s weekly outlook, the medium-term crossing the longterm predicted difference, but with the neural index. That is the signal we’re looking at. When we click on this right now, we’ve taken over the major support at 129.20 but again, the Bank of England is going to speak this week also, so we’ve got to be careful, but when we look at this right now, we are closing back here. We’ve got a verified support zone.
When we’re buying against the trend guys, we need a reason to do so. We absolutely had a reason to buy this, the medium-term trend weakening against the longterm trend. We’ve got a rising RSI. The slope of the blue line is moving higher, but once again we’re coming into a very strong verified resistance area here. We’ve got to be careful if the Bank of England starts getting very dovish this week or starts talking about rate cuts also. Then again, we could see yet another sell-off on this particular pair, so keep a very close eye again on the global stock markets and this week with the Bank of England.
Now once again, the VantagePoint software is a very powerful tool, but it has no access to things like the Bank of England or the ECB. That’s why I discuss them in this weekly outlook because I’m not recapping something that’s already happened. I’m talking about what’s going to happen. Very, very important that we understand that, so we need to discuss briefly event risk coming into the market. Any good trader will look at advanced technicals, inner market analysis, but we’ll also be very mindful of any event risk that’s coming into the market and there is substantial event risks coming into the market next week. Now, once again, with the US-Japan, very much overreacting here to everything that’s going on. When we look at this, we’ve got a big move down on dollar -yen. We come back out to a year, but once again, when we bring our charts back out a year, we can seek out these verified zones.
The AI software looks at these failure points in the market and that’s a fairly significant failure down at one 104.46. Now again, I’m not absolutely convinced that we can get down this low, but we’ve certainly getting close at 104.99. So again, we could see potentially a very strong buying opportunity if everything starts calming down with the coronavirus and money starts quietly going back in. What I tell my own direct clients is that look, as long as the S&P 500 is holding above that area that we identified at 2858 then there could still be a long trade here on the dollar-yen because again, nothing goes straight up and nothing goes straight down. This thing is dropped from the 112 area all the way down to the 104 area in two short weeks. A fantastic call, I might add looking at the VantagePoint software.
Now again, if we look at leading indicators here, we’ve got a failure point and then we close below the predicted moving average two days in a row. Multiple opportunities to get into this trade using the predicted moving average by itself without the black line. Using that blue line as a daily intraday pivot area, there was multiple, multiple opportunities to short this thing guys, and there still is, but remember we very likely could have the same trade on the upside, we’re looking for this. Again, this is an outlook, not a recap. This week we’re looking to overtake the 104.81 area close above that area two days in a row. That would tell me the pressure is off the downside and we can start looking at longs, but again, it’s a very methodical approach. We have the medium term crossing the longterm predicted difference.
U.S. Dollar/Japanese Yen (USD/JPY)
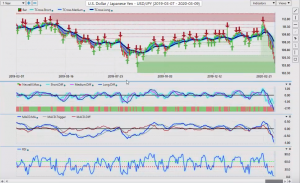
That’s warning us that the medium term trend is weakening against the longterm trend. The RSI, I don’t think it could be any lower at 4.3 but again, it’s moved into oversold territory basically, at the start of this big move. And that’s why indicators such as overbought oversold, accumulation, distribution, have severe limitations in how they call the market. We need the additional indicators and the intermarket correlations to get a more accurate viewing of when the market is getting ready to turn and it’s usually at the most unlikely time. So next week we’ll keep a very close eye on that. Now with the US-Canadian pair next week, the Bank of Canada has drove this thing all the way up above the 134 area this week, this past week.
U.S. Dollar/Canadian Dollar (USD/CAD)
The Canadian dollar again, once again, now we’ve got a dead heat race here, the Fed has cut, the Bank of Canada is cut but it we’re at basically a standoff here. So we’ve got our resistance up at this high and that high is up at 134.63. Shorts carry a slight edge while below that level because we have the medium term trend weakening against the longer term trend. So again, if we get a bit of a turnaround inequities, bit of a turnaround in oil, that will really help the Canadian dollar. So keep an eye on the one 134.63 area. But more importantly, if we look at our blue line here, our predicted moving average, the correlation to 31 other markets worked into this blue line. We can assess here 133.96 that is our immediate pivot area.
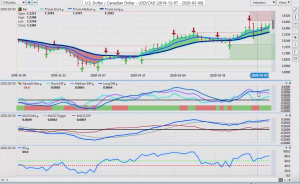
A breakdown below that area would have us starting to look at shorts. I feel we may have a shortcoming up by mid week so we’ll keep an eye on that particular level of breakdown below that level with the medium term cross over the longterm cross looks like we may have actually have a short pending here, but for now keep an eye on that particular level that I just mentioned.
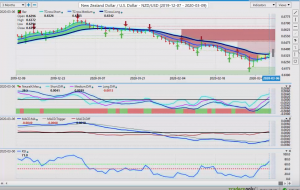
Australian Dollar/U.S Dollar (AUD/USD) & New Zealand Dollar/U.S. Dollar (NZD/USD)
When we look at the Aussie-US and New Zealand-Us, my concern here is that this absolutely looks like it’s nothing more than a corrective move. Now the Aussie-US and New Zealand-US is very highly inversely correlated to US CAD, meaning that if US CAD does break lower than Aussie-US and New Zealand-US are going to break higher. That’s the inner market correlation you want to know and understand and again this weekly outlook, not a recap, helps you prepare for that so you can watch these things because there could be multiple opportunity.
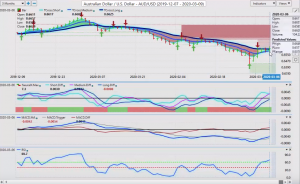
If US-Canada does end up moving considerably higher, then this will be yet another failure for the Aussie-US. We will see the exact same signal on New Zealand-US. So we want to watch these levels. The T cross long 63.42 we’ve got a verified resistance coming in at 63.58 and with the Aussie currency we can see virtually the exact same thing. We’ve got our key T cross long at 66.25 and in an immediate pivot just above that at 66.45. This pair spent the entire week guys at this level. So whether you’re a trend trader or a contrarian trader, there is something in the VantagePoint software for all of us guys. There is no black and white strategy that you must do this or you must do that.
The VantagePoint software is a powerful analysis tool and you can build your strategies off of a number of different tools in the VantagePoint software and if you’d like to bring in an additional tools that you’ve been using, then you certainly can do that also. We also have fundamental traders that simply prefer to trade off announcements, off fundamentals, but they work in the inner market correlations to assist with that. Very, very powerful when we combine all of these things together. So with that said, this is the VantagePoint AI market outlook for the week of March the 9th 2020.


