


VantagePoint AI Market Outlook for the Week of March 16th, 2020
VIDEO TRANSCRIPT
Hello everyone and welcome back. My name is Greg Ferman and this is the Vantage Point AI Market Outlook for the week of March the 16th 2020. Now to get started this week, we’re going to begin with a very different presentation this week. We’ve got, I would call extreme volatility in all markets, commodities, futures, the Forex, but what we’re going to try and do here today is break this down a little bit based around inner market correlations. Now again, this is an outlook, not a recap, but we’re not talking about things that have already happened. We’re looking at prepping, going in to the next week’s trading, and understanding what the likely outcome will be. Now, the main thing we want to do here guys is identify direct inner market correlations. They will trump indicators like overbought, oversold, accumulation, distribution, all of these things that try and call the market after the fact. We don’t want to look at that. We need to understand the inner market correlation so we can immediately deal with something if we have to based around these news announcements, bank rate cuts, all of these different things. It’s very important that we understand that.
U.S Dollar Index
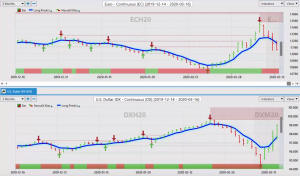
So when we look right now at the dollar index, when we compare it, we see following this blue line, the direct inverse correlation between the Euro and the dollar index. Basically it’s tick for tick. If one goes up, the other goes down. Now that intermarket correlation may be obvious to some, but not obvious to others, but when we look at the line here, we can actually assess here what’s going on. Now, as the Euro starts to fall, the dollar goes up and vice versa. Now when we look at this right now, what’s happened here, when the dollar’s selling off, that’s given rise to the Euro. So we understand that direct inner market correlation, but if we take this one step further, we can also further assess here that when we look at the S&P 500 directly, a driving factor in the markets here, this is the main correlation that we need to understand. That when the S&P 500 put this top in place, the dollar index actually did the same thing. We see a number of different pundits talking about the correlation between the S&P 500, and the Euro, when in actual fact that’s not factual. What’s factual is the S&P 500 and the dollar have been running together. Now we can assess here on Friday, Thursday and Friday, that we started to penetrate this predicted moving average. We’ve closed above that level.
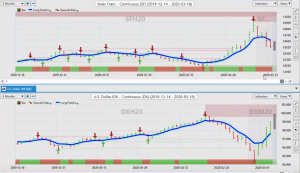
S&P 500
By closing above that level, we started to put maybe a bit of a bottom in here on the S&P 500, but the point being, that if we follow these inner market correlations here, the correlation, right now, is not between the Euro and the S&P 500, but rather the dollar, and the S&P 500 moving up and down together.
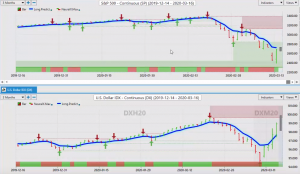
So if the dollar is recovering, that suggests that it’s possible the S&P 500 could recover also. Now again, we can kill multiple birds with one stone here. We know this key level 2719, we need to close above that level. The good thing is we’ve come up on Friday getting very, very close to that particular level at 2683. If we can close above that level, for one or two days in a row, I would prefer two days in a row in this particular case, given the volatility, that we could see a recovery in the dollar, and in the global equity markets, and things may start to calm down a little bit.
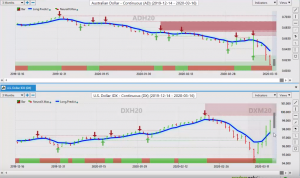
Aussie versus US Dollar
Now when we look at the additional inner market correlation, the turning point, the dollar going higher, that pushed the Aussie even lower.
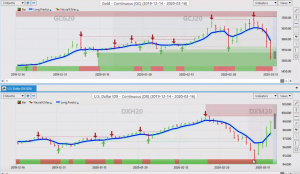
New Zealand Versus US Dollar
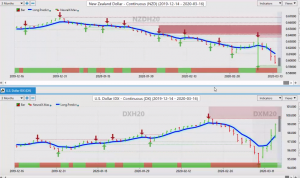
The same thing happened with the New Zealand currency, you can see that one puts a top in, the other puts a bottom in, and it causes that absolute reversal.
Canadian Dollar versus US Dollar
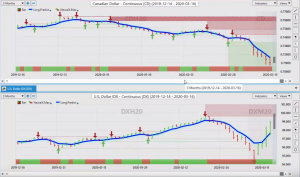
The Canadian dollar, almost identical, but the Canadian dollar and the US dollar had been moving basically more or less together. Both very weak here as we can see at this particular point, but the dollar is recovered. Now that has a lot to do with the Bank of Canada. The Bank of Canada, by the way, has cut a 100 basis points in 10 days. I personally have in my career, I’ve never seen that, particularly over a virus like this, a flu-like virus.
So again, I think that the media, if anybody needed to be quarantined, I don’t think it would be necessarily a bad idea to quarantine the media for 14 days just to let this thing settle a little bit here, because again, I think the market’s getting ahead of itself. There’s panic buying, panic selling, all of the above, people trying to get in, people trying to get out, but understanding these inner market correlations will help you get out in front of this. That’s the main thing.
Gold versus Dollar
So the same thing we can assess here with gold. When we look at the US dollar index and gold, we can see that as the dollar puts a bottom in here, gold immediately starts to sell off. So when the bottom comes in here, that puts a top in gold, that doesn’t necessarily mean that gold is going to sell off any further from here. It simply identifies how quickly these inner market correlations take effect, and in the kind of market conditions that we’re in right now, it’s paramount to your success that you know and understand these inner market correlations.
U.S. Dollar/Swiss Franc (USD/CHF)
When we look at the Swiss franc, we can see the same thing. The Swiss franc currency futures were aggressively moving higher. The second the dollar started to recover, we can see that the Swiss franc. So think of this, this particular is like the US Swiss franc. So as the dollar index goes higher, US Swiss franc goes higher. Euro US goes lower. That’s the intermarket correlation we want to look for.
U.S. Dollar/Japanese Yen (USD/JPY)
The Japanese yen, we see the exact same thing. The second the dollar index stalls and starts to move higher, the yen immediately halts it’s advance and starts to move lower.
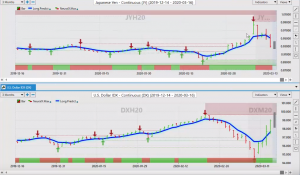
U.S. Dollar/British Pound (USD/GBP)
When we look at the British pound, virtually the exact same thing. The British pound moving higher, it hits a top as the dollar hits a bottom, and they both reverse. So if you’re looking at this right now, again, next week is very, very important.
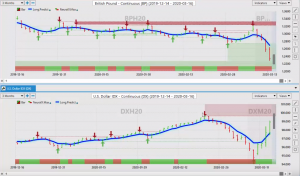
US Treasury Notes versus The Dollar
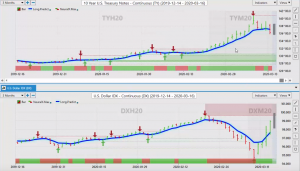
So if you’re looking at this right now, again, next week is very, very important. We can look at that via the 10 year treasury notes. Also, we can also make, you can see the inverse correlation here. There’s a number of different things that we can assess.
When we look at oil, for example, with oil, could oil now be getting ready for a recovery? What we can assess here is that oil stopped the decline the very second the dollar did. Oil is trying to recover. Doesn’t necessarily mean that oil is going to break out to the upside, but there could be a long trade there. I think we would be able to agree on that based around the very strong inner market correlation that we see here.
So again, it’s all about understanding the inner market correlations guys. If we understand what markets are correlated to each other, we have a better chance of getting out in front of some of these moves. Or in the alternative, at least what we’re doing is we’re not reacting and overreacting to intraday moves. We get a better understanding of what the inner market correlations are.
Now, when we look at our main currencies going into next week, and again, very important that we do that breakdown to understand what is driving these markets. So what, in my respectful opinion, is driving the Euro US is the recovery obviously in the dollar, but also the slight recovery in the S&P 500 that’s pushed the Euro back down.
EURO/USD
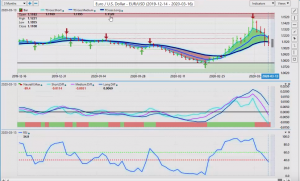
Now we are at one 1120, we’re closing basically just below that particular level. This is a big level going into this week. If we click on our F8, we also get an additional pivot area, 11193. So right now the main thing that you want to understand, connecting the dots to these inner market correlations that if the S&P 500 recovers, and the dollar index continues to recover, then the Euro is going lower, not higher. That’s the way we want to look at this guys. So again, knowing those key pivot areas and understanding these indicators, we’ve got our medium term crossing, our longterm predicted difference, our neural index is down, and our predicted RSI is sitting at virtually a breakout point. At just below the 40 level.
So again, understanding your key pivot areas, where the market is, this will, and more importantly, understanding those direct inner market correlations. Now with the US Swiss franc, we would look for the market to break above 9566 this week. We need the dollar index again moving higher, and we need the S&P 500, and the global equity markets moving higher in order for this trade to advance for any kind of long trade to form. We can further assess, again, we’ve got a base on the US Swiss franc. When we found a base on the dollar index. This is not based around an overbought or oversold, or accumulation distribution, or any of these things. It’s based on the inner market correlation to the dollar. That there is zero lag When you understand these in our market correlations and the invert, both positive and inverse correlations, critical at this particular stage, because we’re going into another very volatile week. We’ve got the FOMC. We’ve got central banks talking, and I don’t know if the Bank of Canada is going to cut again, the Bank of England. Anything is possible next week.
So again, understanding how these markets are going to react to that is of critical importance. When we look at that pound dollar, the pound dollar under significant pressure here, but again, if we’re only trading on an oversold condition here, then we would be getting repeatedly stopped out. The market is pushing lower, the pound is under pressure. So again, we have to be very cautious here. Now when we look at our T cross long one, 2793. The further the market moves away from that, the more likely it is it’s going to retrace to that. We’re about four or 500 pips from that right now. So the probability of a retracement is very strong.
Again, when you look at that blue line only, where we’ve got the correlation to 31 other markets, and using that as a pivot area, the slope is still heavily down, but the pivot area is 12605. So in my respectful opinion, the probability of next week that we at least come back to 12605 is about 75 to 80%. that’s the probability. So we can play it on the long side, and then sell when it gets higher or reassess when it gets higher, but the probability of a retracement is very strong. So again, we need the global equity markets to basically start coming back a little bit, and then we can see the pound potentially rise.
US Dollar / Japanese Yen
Now again with the dollar yen. This is a pair that you want to be very, very cautious of, but once again, the reason why this turned around is not because of an overbought or oversold signal, or accumulation distribution or any of this stuff. It’s simply the inner market correlation to the dollar index. The dollar index turned, and the dollar yen turned higher. This pair is anything but out of the woods here yet guys. Now we’ve closed above the 107 level. Now we see how we do on a retest when it pulls down lower. Once again, we can click on our F8 and get additional pivot areas down to 10576. One could argue here the same thing that I just argued with the pound that the further we move away from the blue line to the upside, the more likely it is we’re going to retest it on the downside.
Understand again, your inner market correlations. If the equity markets, meaning the S&P 500 can recover, then the dollar yen will hold above these two levels. If the equity markets crash again, then you can expect the dollar yen to come back to 10576. Again, the inner market correlation, guys, is what you want to watch. If the dollar index cannot hold its gains, the S&P cannot hold their gains, then dollar yen will not hold these gains.
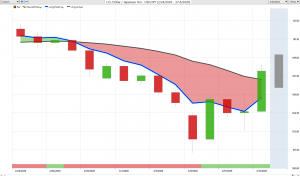
When we look at the US Canadian pair going into next week, once again, two rate cuts pushing the US CAD almost to the 140 mark this past week. In my respectful opinion, only the Canadian government is maybe grossly overreacting to this. Now again, Canada is unlike the US. Canada, we have no people complaining, there’s no tests available, yada, yada, yada. Well, Canada doesn’t have any tests, and in fact, if we go to a healthcare practitioner, and we don’t have any symptoms, we’re sent home. There’s no reason to have a test if you don’t have the symptoms. That’s the logic here.
So, but at the same time, they’re contradicting themselves by cutting a hundred basis points in 10 days. So like most politicians, very confusing to say the least, but for now, we have moved aggressively away from the 13532 area, and what looks like a very easy, short, very often is not. As you can see, if you’re playing in accumulation distribution, or an overbought or oversold. Basically you had a pretty tough week, but if you’re going with the primary trend, as outlined by vantage point, more importantly, bring in our blue line by itself. You can see how the market is just hugging this. So anytime it gets near this blue line, we simply buy. On a break and close below that level, for one or two days in a row, then we start looking at short. So the main thing we have to break down below 13736 before we think about shorts.
Now again, we do have what appears to be a possible top in there, but I would argue that even that is highly speculative because again, we’re still making new highs here, and we’ve got a higher lows and higher highs. So again, be careful with this pair. People will say to me, well it’s got to, it’s at 135 it’s got to go lower. It’s at 140, it’s got to go lower. Well guys, look back on your longterm charts. I’ve traded this pair in the 155, 160 range. So to say it can’t go higher would simply not be factual. And when we look at the price of oil, basically getting killed. The problems between Russia and Saudi Arabia, $30 oil prices, that doesn’t bode well for the Canadian economy, or the Canadian dollar in general. So keep that in mind, but the main thing here guys, whatever your position is, just know your levels. 13736, if we hold above this level for the week, then longs are still viable.
When we look at our other commodities currencies the Aussie and the New Zealand, there is certainly no love for either one of these two pairs. They have just been getting absolutely killed. However, there could be some light at the end of the tunnel here also. When we look at this, if basically we can get out of this global risk off environment, then there could be some very, very good long trades on both the Aussie, US, and the New Zealand Us, but right now, the RSI is at 5.5. That is about as oversold as it absolutely gets here guys. And when we look at the New Zealand dollar, we see basically the exact same thing. A little better at 11.7, but not much. So again, these currencies are going to be geared towards whether those equity markets can recover or not. So the main thing, and the main point of this presentation this week, which is quite different than the other ones that I’ve done, is to identify these inner market correlations, because these are leading indicator, leading correlations, that will assist in a very, very turbulent market.
So with that said, this is the Vantage Point AI Market Outlook for the week of March the 16th 2020.


