


VantagePoint AI Market Outlook for the Week of May 18, 2020
VIDEO TRANSCRIPT
U.S Dollar Index
Hello everyone, and welcome back. My name is Greg Firman, and this is the VantagePoint AI Market Outlook for the week of May the 18th, 2020. Now, again, to get started this week, we’ll begin where we always do with the US dollar index, a very important component of all market trading whether you be in currencies, commodities, equities. There’s a correlation there to the dollar no matter what you’re trading.
US Dollar Index
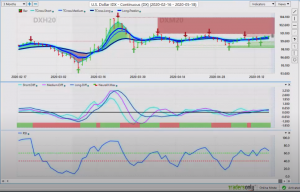
When we look at the current market conditions of the dollar index, we see that we have a very mixed signal here inside the VantagePoint software. Now, we have our triple EMA cross that is attempting to complete up against a very strong verified resistance zone between 145 and, of course, this major level at 100.97. Now, our medium-term predicted difference is crossing our long-term predicted difference, which is, again, confirmation that we could be seeing the dollar turn lower here. That’s what I would watch for in this coming week.
Our predicted RSI, also starting to lose momentum here. Now, our neural index is still positive. What we’re looking for is for the neural index to match the medium-term crossing the long-term predicted difference and a failure between the two aforementioned levels. If that comes to fruition, then we would see the dollar drop pretty much across the board.
GOLD
GOLD
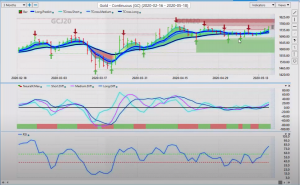
Now, how this relates to gold. Again, gold is being used as a confirmation tool here. When we look at the gold contracts and the very, very strong signal from VantagePoint, again, off these verified support levels down at this 1683, our triple EMA cross is starting to advance. Our predicted differences are also starting to move above the zero line. Our neural index is positive and our predicted RSI getting a little bit overbought. Again, we don’t want to be using overbought and oversold signals in our trading or accumulation distribution to some degree, because it has a lower win percentage because we’re basically telling the market if something is overbought, then it has to go lower.
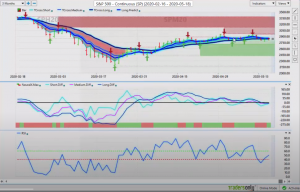
Again, we don’t want to do that in our trading. We want to follow real money as best we can. Clearly, real money continues to buy gold. Now, with that move up in gold, we can see that that’s having a very negative effect on the equity markets. Now, the S&P 500 made a valiant effort to try and break through these key levels up here in this 29, 2940, 2970 mark, but you can see we have a very strong resistance building in this particular area. We also have very strong support, which I will point out, and the RSI is failing to hold below the 40 level.
Now, again, when we look at an RSI or accumulation distribution or one of these other similar tools, excuse me, we want to use it as a momentum based indicator, not as an overbought or oversold condition. We would look for, again, this particular RSI that I’ve modified in the VantagePoint software, number one, it’s been sped up to a nine period. Number two, it uses a 60/40 split. If we break down below 40, we could see an acceleration to the downside. If it breaks above 60, we want to buy that type of momentum. Remember, an RSI is a leading indicator. It’s not necessarily designed solely to be used as overbought or oversold. We look for it to confirm momentum in the market.
S&P 500 Index
S&P 500 Index
Right now, actually we don’t have a lot of downward momentum in the S&P 500. Essentially, as long as we’re holding above this lower verified support zone, which I would tag at or about 2718, then longs are still viable there. Now, one can also… There’s meat on the bone here for everyone, guys. If somebody wants to sell, then you would want to hold out to at least the 2922, 2950 level.
Crude Oil
Crude Oil
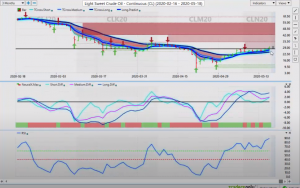
Now, as we look at, again, light sweet crude oil, oil prices are trying desperately to advance higher here. My optimism remains heavily guarded that oil can get really past $35 a barrel, if that. Again, we have to see if the global economies are going to continue to open up or if they’re going to be shut down again. If they’re shutdown again, oil will plummet. Once again, we’ve got to look at these things. We can see that our medium-term crossing our long-term predicted difference has told us that this is a dangerous area to buy here, that this could be a bull trap. Whether it’s right or wrong, it gives us that valuable information that we need to make a decision in our trading. Should we really be buying oil at these levels based around price, based around intermarket correlations or, more importantly, based around supply and demand? Supply is very high, guys. Demand is very low. Again, I don’t think oil has a lot of upside from here.
Bitcoin
Bitcoin
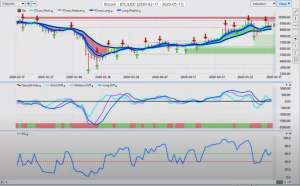
Now, one of my favorite ones I like to talk to, which I have decided I am going to add to the weekly outlook here, the AI weekly outlook, is Bitcoin. Now Bitcoin has come off yet another [inaudible 00:05:24] I think this is for the third time, and it was, once again, a very, very good buying opportunity on that dip. You can see how the market reacted to the news that Bitcoin is going to be halved again. Basically, it was just a buying opportunity. Now, we do have very stiff resistance on Bitcoin up here in this 10,000 mark.
Again, in my respectful opinion, the indicators in the VantagePoint software are warning us to ignore the pundits out there that are saying, “Bitcoin’s a scam, Bitcoin’s this, Bitcoin’s that. We’re not buying Bitcoin.” I would have to respectfully disagree. The charts tell me that Bitcoin is something we should be buying here on a dip. Once again, our key levels for next week, 9359, the long predicted. As long as we’re holding above that, we are likely to move higher. Our predicted differences are above the zero line. Our RSI is breaking 60. Our neural index right now is currently not on board, but if the neural index can flip over from red to green, I think, once again, we have the green light to start looking at longs on Bitcoin.
Euro/US Dollar
EURO/US Dollar Index
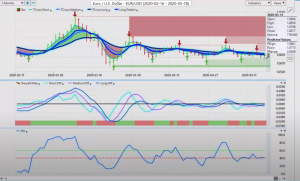
Now, as we move into our main Forex pairs here, you can see that the Euro US is struggling to break higher, but we can also assess, guys, that the medium-term crossing the long-term predicted difference is, again, warning us of pending dollar weakness. Now, if we can get in the RSI again, you can see as moving sideways along the 60 level, we’re looking for, or the 40 level, excuse me, we’re looking for a sustained break below 40 if we were going to short this thing. Again, the medium-term crossing the long-term predicted difference is a warning sign that the Euro US is probably going to go higher.
Now, it is a holiday short week in Canada, and I think that UK may have a bank holiday also on Monday. Monday is usually not a true price in trading. Tuesday is. We see a reversal from Monday to Tuesday, so we’re looking for potentially a strong push to the downside on the Euro, which will be a buying opportunity for us.
US Dollar/Swiss Franc
US Dollar/ Swiss Franc
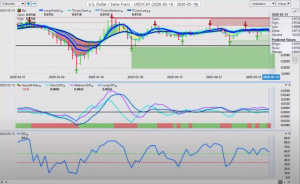
Now, the same thing would apply but in inverse perspective to US Swiss franc. When we look at US Swiss franc, we have significant resistance here at the VantagePoint level at 9734. Then, we have additional verified resistance up to the 98 level where we would look to continue to short this thing. Again, let the market move higher on Monday, maybe part of Tuesday, Monday being a holiday, and then use that to set your shorts around these critical VantagePoint levels.
Now, again, an additional strategy that I love to promote is the T cross, is, excuse me, the long-predicted by itself which is 9743. That’s the area right around that predicted moving average that I would focus my shorts around.
British Pound/US Dollar
British Pound/US Dollar
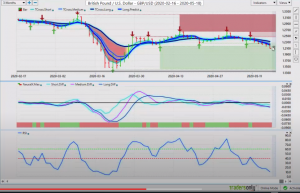
As we move into some of our additional pairs, Great Britain US under pressure yet again this past week. Now, part of this came from comments from the administration saying that they’re okay with a strong US dollar now. I’m getting a little confused on this one too, because no country really wants an overly strong dollar and the US has a fairly strong dollar right now.
What I would be cautious of here, guys, is this is usually when we have multiple support levels stacked up around these areas here, more specifically the one I’m looking at is this one around 12165. This has the classic makings for a bear trap. Be very, very cautious here with shorts at this level. Again, if we look at our predicted RSI and, again, I do not endorse overbought oversold conditions, but we are sitting at 10.6 on the RSI. It gives us a bit of a warning here that we could be getting ready for a reversal. If we look at the signal on the dollar index, looking at the medium-term crossing the long-term predicted difference, remember that the British pound still makes up a significant portion of the dollar index. If the dollar index turns down and fails around that, between the levels that I had mentioned, that the pound would be a buy, not a sell. Again, be very cautious shorting anywhere down around this 12160 level.
US Dollar/Japanese Yen
US Dollar/Japanese Yen
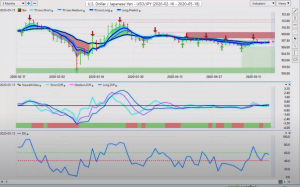
Now, with the dollar yen this past week, the dollar yen making small moves to the downside surprisingly in a very orderly fashion, but it’s just not able to break into a trending move here. I believe that one is coming in the not too distant future. It will likely be triggered by the S&P 500 or the Nikkei when those global equity markets either move higher or move significantly lower. One of these two things is going to happen, guys, it’s not going to keep moving sideways. When that happens, that is likely going to set off the dollar yen.
Now, with rising gold prices, the biased here would be to the short side. In my respectful opinion, we keep playing the range. We sell the top and we will be very cautious buying on dips here. The shorts are clearly the better play. We basically look for it to move into these levels between 10750 and 10810 is essentially your sell zone. The indicators in VantagePoint are very mixed at the current time, but I believe that a short ultimately is likely to prevail in this particular pair.
Now, as we move into our three main commodity currencies or what I’m lately, as of late, I’ve been calling them more of equity based currencies because they’re following the S&P 500, the Aussie, the New Zealand and the CAD go up and down with the S&P 500.
US Dollar/Canadian Dollar
US Dollar/ Canadian Dollar
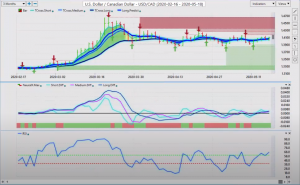
Right now, US CAD is absolutely at the mercy of that inner market correlation. When we look at this right now, again, 14070 is a big level. 14052, the T cross long, you can see I’ve got them side by side here, longs are slightly favored, guys, at this particular level, but we have to be cautious and we need understand proper stop placement.
We want all stops below 13850. You would lower your position size to allow for that volatility if you’re going to buy this pair. Now, if the equity markets break higher, if more specifically the S&P 500 goes higher, then we would look to short at this particular pair. We would look to do so around this verified resistance zone at 14172. Remember, it’s a bank holiday on Monday for Canada. Tuesday’s the new Monday with Canada. Usually, US Canadian pair, excuse me, what often happens is whatever the US Canadian pair does on Monday, it does the exact opposite on Tuesday.
Be cautious around what I said. That’s just free advice, an observation I’ve noticed over the years, and it seems to come to fruition about 90% of the time, guys. Watch your Monday and Tuesday price action this coming week. Again, know your main pivot areas. Again, if US Canada can hold above 14050 or so, then longs are likely viable. That would mean that gold is probably going to go higher and equities are going to go lower. That’s how we would read that.
Australian Dollar/US Dollar
Australian Dollar/US Dollar
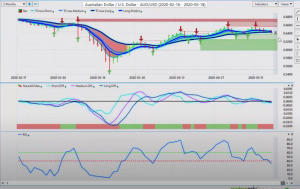
Now, with the Aussie US and New Zealand US, we’re getting some confirmation here that, again, the S&P 500 is getting ready to move lower, not higher. The Aussie is starting to break down again, our predicted differences breaking below the zero line. Our neural index is firmly red, which is down, and our RSI is slipping very slowly and orderly below the 40 level. That tells me that momentum is building to the downside. If we look a little bit closer, we see that New Zealand has already made that move. If you’re going to pick a short between the Aussie US and New Zealand US, I’m pointing you indirectly to the Aussie US versus New Zealand.
New Zealand Dollar/US Dollar Index
New Zealand Dollar/US Dollar
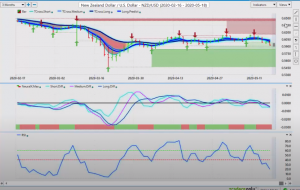
The New Zealand, excuse me, has already made its move so the Aussie is very likely to follow. Again, we would look at all of this. Because of the very high correlation the Aussie US and New Zealand US has to the S&P 500, if both of these pairs continue to break lower, US Canada breaks higher, then it’s very unlikely we’re going to see the S&P 500 higher in the coming days or weeks ahead.
With that said, this is the VantagePoint AI Market Outlook for the week of May the 18th, 2000.


