


VantagePoint AI Market Outlook for the Week of November 16, 2020
VIDEO TRANSCRIPT
U.S. Dollar Index
Hello everyone. And welcome back. My name is Greg Firman, and this is the Vantage Point AI Market Outlook for the week of November 16th, 2020. Now to get started this week, we’re going to begin where we always do with that US dollar index. Now, just to recap from last week, to point out a couple of irregularities. What I had stated specifically at the beginning of last week’s presentation is that it appears that Biden has won the election. And I further went on to say that I’m not convinced that this election is resolved yet. So again, we don’t like it when people put words in our mouths and so just to clarify what I actually said there, I have no horse in this particular political race. I’ve simply reiterated the facts as I see them, that it appears. So when we look at this going forward, how is this affecting the US dollar?
U.S. Dollar Index
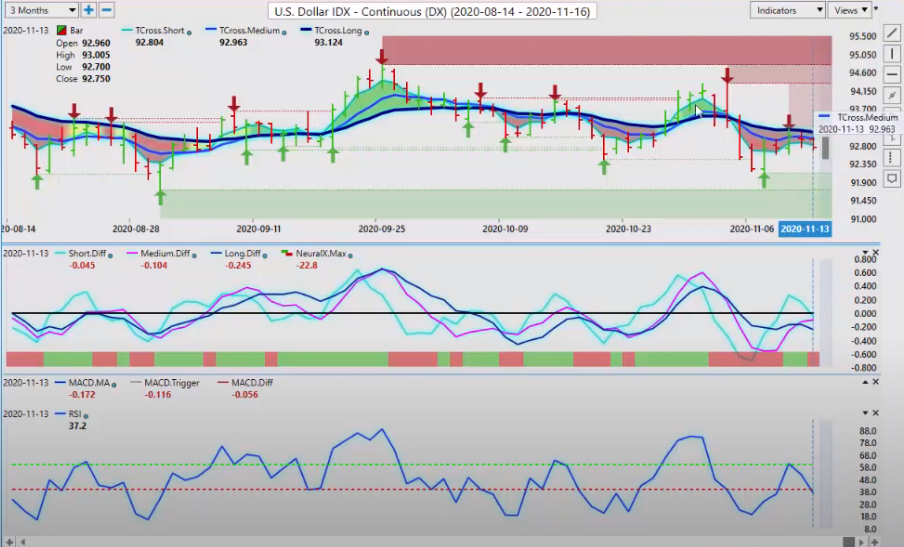
The election is still contested as best I can see. As I stated in last week’s weekly outlook, that I don’t feel that this is necessarily resolved. So the dollar is holding below the key vantage point level at 93.12. Now, what we can assess here is the market has come up to this critical T cross long over the last three trading sessions and has failed each time. What we have to be very cautious of here, going forward into next week’s outlook is, or into next week’s trading, excuse me, because this is an outlook, not a recap of something that already happened. We’re looking at going forward. This is a warning sign that dollar strength could be on the horizon here. We’ve got our medium-term trend weakening against our longer-term trend. This is a very, very powerful contrarian signal. When we look at this, when this pink line, which represents the medium-term trend, is no longer pointing down, it’s crossing over the longer-term trend, which is clearly down, but we must clear this vantage point level.
This is how we combine the VP indicators. What I will further point out is that the predicted RSI using a 60/40 split has come up to the momentum point, the breakout momentum point of 60 and it failed. So what we’re looking for going into this week’s trading is for the RSI to get back up above 60 and the medium-term crossing over the long-term predicted difference to break above the zero line. And of course, takeout this T cross-long pivot area at 93.12. If that happens, then we will see the dollar start to gain ground here.
Gold
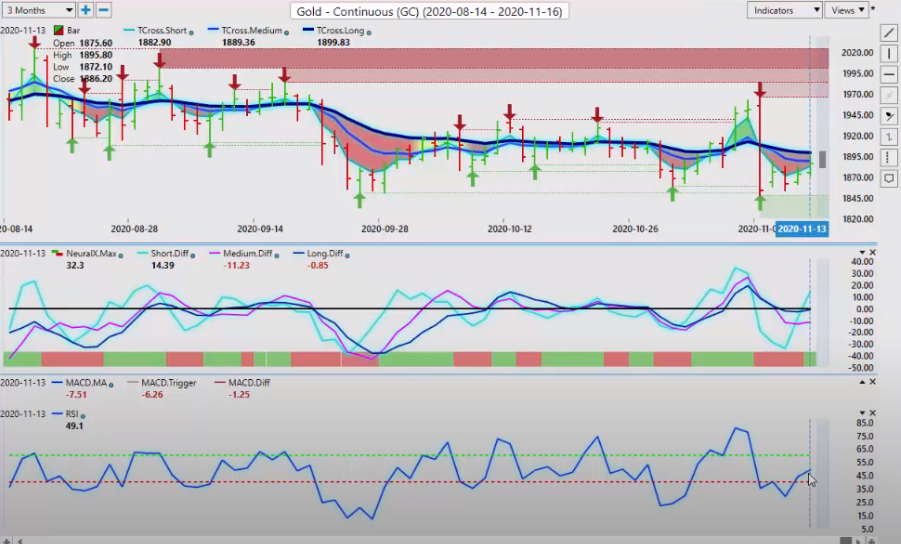
Now the immediate market that we want to use as a comparative analysis to this is gold. We can see that gold is still structurally weak. We’re holding below the T cross long 89.99. In order for goal to remain bullish we must break above this level of the 1900 mark and stay above it.
GOLD
Now it’s looking better with the predicted RSI, but we’re still at 49.1. Our predicted difference cross is still down. The neural index is up, but once again, when we look at this, there are two key levels that you can use with vantage point. We’ve got 1899, 83, the T cross long. Now, if we click on our F8, we can see an additional pivot area. If we break above 1892 and stay above 1892, then we could see gold accelerate higher. Now this would directly also apply to the S&P 500. The S&P 500, still advancing higher here. But once again, the correlation has been that gold and the S&P 500 is up. This correlation formed basically back when this COVID stuff started back in February. So again, when we look at this, the structure of this, that this correlation between the S&P 500 and gold could be breaking down here.
Now, what I’m also seeing is that after we’ve had this big push up, now, remember this big move up was already in play. The announcement of the COVID vaccine just simply help push it up even further, but then it backtracked down and we haven’t made any real gains on the S&P 500 since. When we look at the medium term crossing the longterm predicted difference this is warning us that we may not have a lot of traction on to the upside.
S&P 500
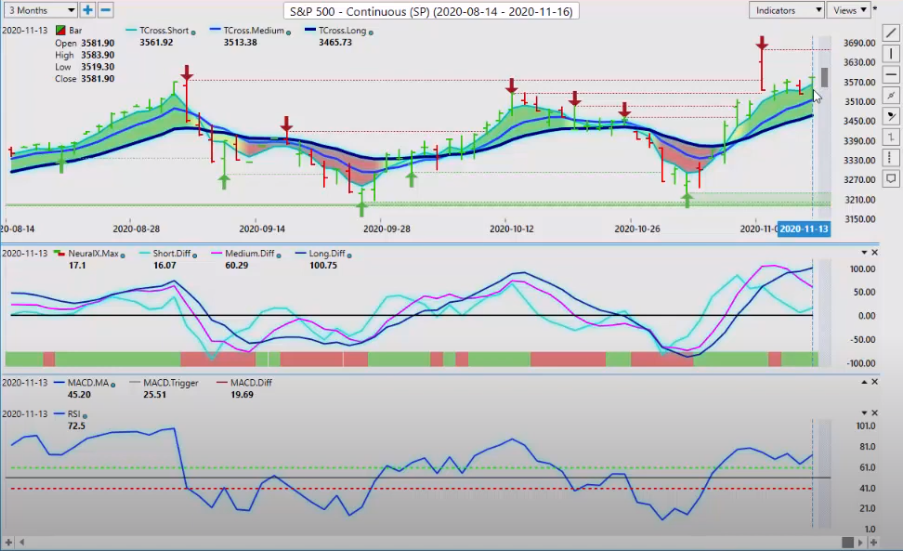
Now wall Street’s calling now, I believe for around 4,300 on the S&P 500. I don’t know that I’m in that camp, but I will concede that the S&P 500 is still very bullish. It’s been bullish for the last four and a half years. The next four years, I’m not sure it’s going to remain bullish here, guys, If the administration changes. That’s left to be seen, I don’t know what their policies are going to be. Cabinet, I don’t know any of that. So there’s a lot of uncertainty as we start moving closer to 2021. Now, when I look at this right now, the t cross long 34.65, we’re long while above that. Now, again, the T cross long using the vantage point long predicted as a pivot area, we can see that the market is holding above this level, and it’s using it as a springboard to advance higher. What I will advise is that we have the medium-term crossing the longterm predicted difference to the downside, warning us that we’re getting very toppy up here. If the neural index starts turning red, then that would be the trigger that the S&P is likely going to suffer a deeper pullback probably into that 34.30, 34.40 area, maybe even lower we’ll have to see. But this would also, under the current inner market correlation, it would also hurt gold.
S&P 500 Index
Crude Oil
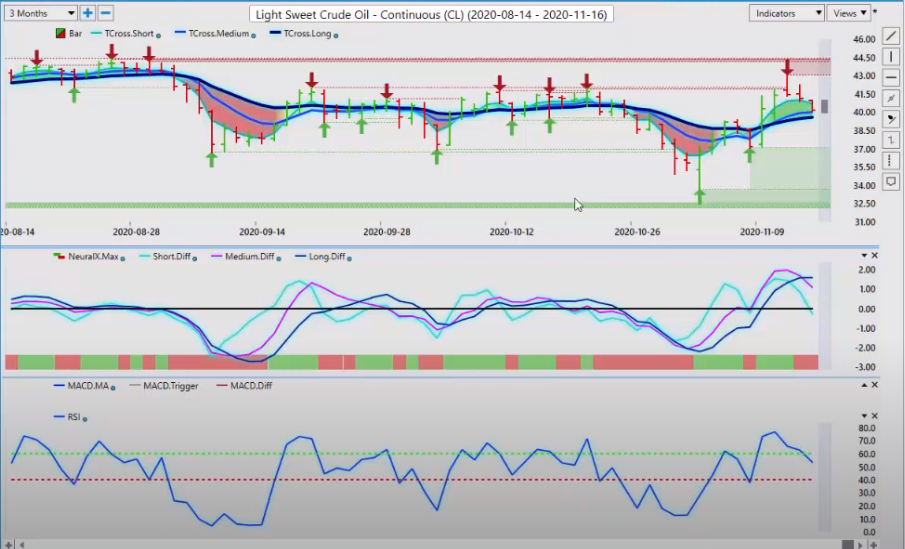
So be careful with these two. Now, when we look at oil, once again, I’ve been pretty clear about this over the last several weeks, maybe even several months, I guess, is that I don’t see a lot of buyers up here. Anywhere above $40 a barrel has been pretty tough. Now our T cross long is coming in at 39.57, but when we click on our F8, we can see that a cell signal is very clearly forming. And again, this is an outlook, not a recap. So when we’re looking at going forward in our trading into next week, we can assess that we have our medium term crossing our longterm predicted difference. We are starting to break down below the vantage point long predicted moving average. And again, with the neural index on that, this is a classic sell signal.
Crude Oil
Good, bad, or indifferent, right or wrong, this is a very powerful setup in the vantage point software. Now we’re still above the T cross long, but the long predicted at 40.34 is starting to give way. So in my respectful opinion, the bulk of the gains that oil made, they made it the day that they announced that there was a vaccine coming from Pfizer, right? It really has done absolutely nothing since. So again, when we look at this particular signal, whether oil goes up or down from here, the way I would look at this particular signal is that there is a bias to the downside. And if anything, it’s warning me not to buy oil up at these particular levels. Now, when we look at one of my favorites here, I’ve been banging the war drums on Bitcoin for the last year and a half here guys.
Bitcoin
And once again, in late October, I actually noticed, and I will concede that there’s been a very high inner market correlation between Bitcoin and the S&P. But over the last month or so, I’m seeing that breakdown a bit where the S&P 500 has had some significant pullbacks, but Bitcoin has remained very strong. Now our critical VP level is coming in at 14,743. We’re long while above this particular level, but we should expect a retracement because if we remember what it’s trading against, the US dollar. There is a potential buy signal forming right now on the dollar. Now, the dollar cycle, usually the dollar doesn’t gain any ground or make any headway until the end of the month and the first week of the new month. That’s when dollar demand is. So Bitcoin very much could still move higher.
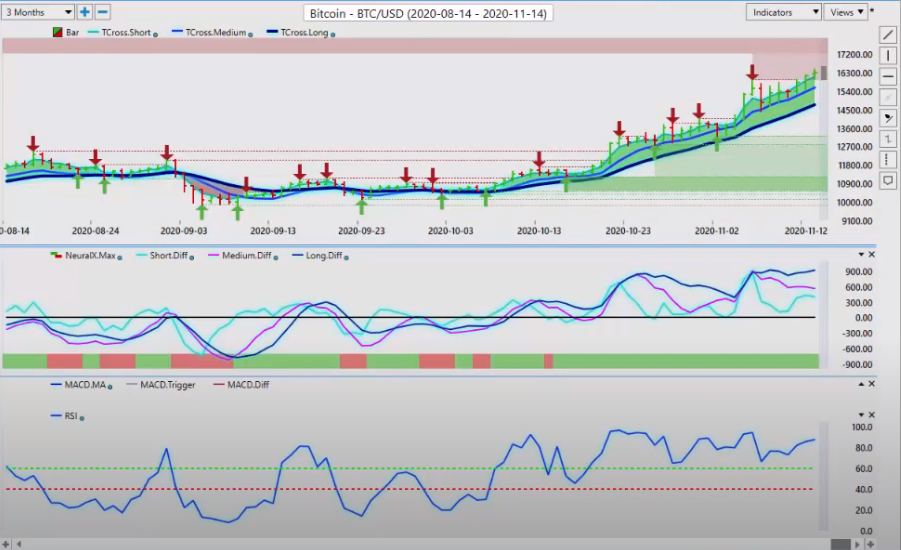
Bitcoin
But again, that very ominous signal off of this newly formed verified resistance zone is warning us to be careful buying at these particular levels. So when we click on our F8, we really see the power of that predicted moving average rate here. As the market is using this predicted moving average, we have basically no sellers around this blue line. So on a daily basis, you can see that Bitcoin, this hasn’t been going on for one or two days here, guys. And that’s why I’ve been such a strong advocate to get long on this thing, because it’s a daily occurrence that it comes back, it kisses the VP level, and then springboards off of that. So we want to make sure we understand where these levels are, but the same thing that would have us go long is also what would have us go short.
So if we break down below the long predicted at 15,762, we could see Bitcoin take a little bit deeper of a correction during the period while it’s over bought. Now, when we talk about overbought, oversold, accumulation distribution, this is where trading those types of signals can be very, very difficult because we can assess that essentially Bitcoin has been overbought this entire time, that it’s advanced higher from 12,700 to almost the 17,000 mark 16,500. Accumulation distribution has been reached during the same period of time, the overbought signal has been there the entire time. But when we’re using the vantage point predicted moving average as a way to determine putting aside the overbought signal for a moment, and just looking to see where the buyers are coming in, you can see why that type of signal carries very, very little weight in the modern markets.
Euro versus U.S. Dollar
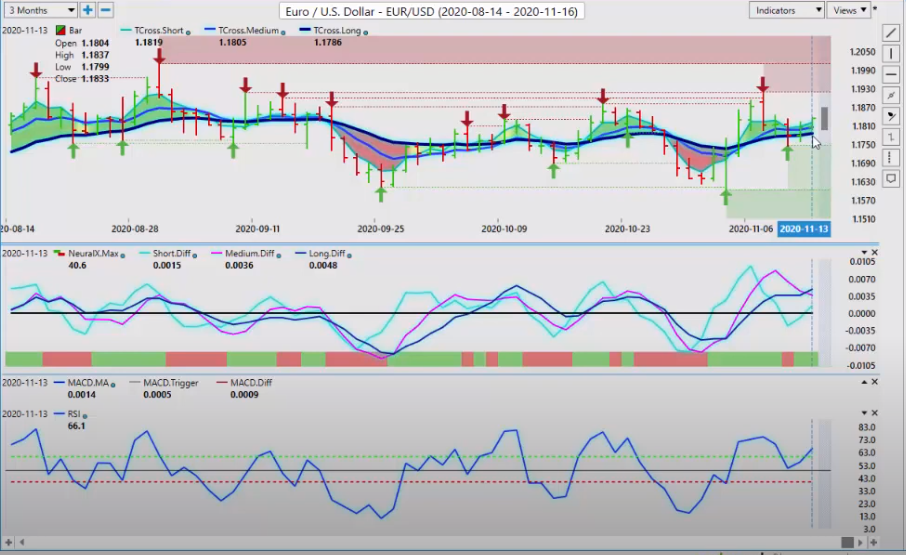
So again, keep a very, very close eye on that long predicted to start the week at 15,762. Now, as we move into some of our main Forex pairs, looking at the Euro, the Euro is looking for the S&P 500 and gold to continue to advance. But again, when we look at this very ominous signal here, at this pink line crossing the blue line, this is again warning us that dollar strength is coming. It may not be here right now, but it is coming. So the Euro, in my respectful opinion, it must break above 120 very, very soon or it’s going to be susceptible to a much deeper pullback. If the neural index goes from green to red and the RSI slips back below the 50 line, this line you can see I’ve drawn here, then the Euro is more than likely getting ready to move lower during that cycle of dollar demand, which is usually again around the end of the month, the first week of the new month.
Euro versus U.S. Dollar
Now we are in November. US Thanksgiving is coming, but be cautious of this. Right now, the main indicator here, the medium term crossing the longterm predicted difference is warning us that the Euro could be getting ready to move lower. When we click on our F8, you can see that the entire week, the Euro US pair has been struggling to hold above this key vantage point level. So therefore, on a breakdown below the long predicted at 11814, what confirmed that we are going lower and the dollar is strengthening, equities could be in trouble. Gold could be in a little bit of trouble. That is what would potentially send the Euro lower, not higher. So keep an eye on that main level. The same thing would apply to the British pound. Now the British pound, things are getting a little bit better there, but very little has changed for the most part.
British Pound versus U.S. Dollar
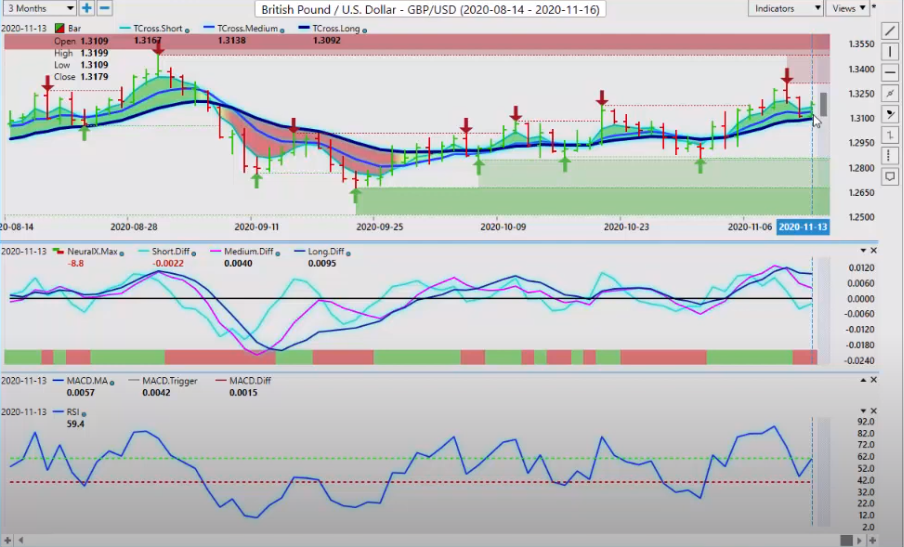
Brexit is not going away, some analysts argue we’re going to have Brexit forever. That’s not an unreasonable statement, right? When you think about it. So for now, the key vantage point level comes in at 13092. We have verified resistance up here at the high 13311. In my respectful opinion, we must get above 13311 very, very soon. The other level that I will advise here is the yearly opening price coming in around 13247. If the market continues to hold below 13247, then again, the pound is susceptible to a bigger sell off on pending dollar strength. So keep an eye on the main level. Also use your F8 by itself. As you can see, we almost had the two day rule. The two day rule, just for people who haven’t heard that from me before, I look for the market to close below this blue line, the predicted moving average, two days in a row.
British Pound versus U.S. Dollar
Usually if I get that two days in a row, the third day, there will be a much sharper move. Case in point, when we look at this, you can see the market moving up. We close below there one day, we close below it right up on it the second day. Then the third day, the fourth day, the fifth day, the sixth day, the seventh day, it just gets slammed lower. That exact same signal could be setting up right now, guys. So keep an eye on this long predicted level at 13168. If we hold below that, shorts will definitely be on the table. But if we hold above it, and more importantly, if we hold above 13247, we could see the pound accelerate. So that is the plan A and plan B from an outlook perspective going into trading next week.
U.S. Dollar versus Japanese Yen
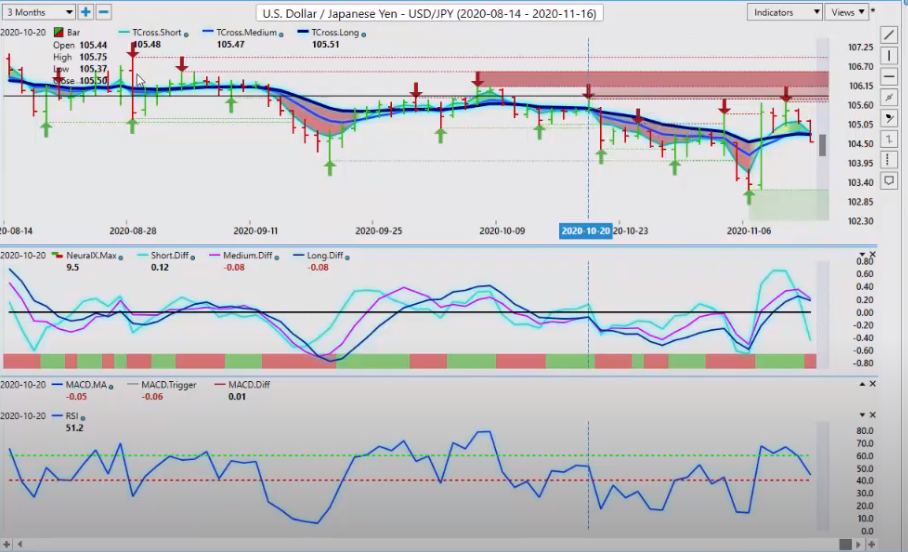
Now, as we look at the dollar yen, once again, very few long-term buyers of the dollar against the Japanese yen. A lot of people don’t realize this, but very briefly, the yen and or excuse me, Japan and China no longer go through the US dollar to settle their respective trade balances. They use their own currencies. So China and Japan want less exposure to the US dollar. That’s what that tells me. So bear in mind, you can see we have this very stiff resistance area up here in this 10575 area. But overall guys, we have not been able to get anywhere near the 107 level in a very long time. Now, again, when we look at this triple [inaudible 00:14:41] cross forming, we’ve closed below the T cross long at 10476, but you can see here how we can, we are just closing now below the long predicted at 10479.
U.S. Dollar versus Japanese Yen
So a sell signal is clearly forming on this, but we must hold below those two levels that I’ve discussed going into next week’s trading. If we can’t hold below these two main pivot levels, then we could see further upside. But at the current time, this is yet another warning sign that the S&P 500 could be getting ready to move lower.
U.S. Dollar versus Canadian Dollar
Another forex pair that I will use to gauge the overall markets is of course, US Canada. If US Canada, we can see the T cross long here is now at 13126, we’re basically closing right on this particular area, 13122 minus the spread it’s right around that level. But you can see what sent the US Canada higher. Once again, we put a bottom into the market here, the medium term crosses the longterm predicted difference.
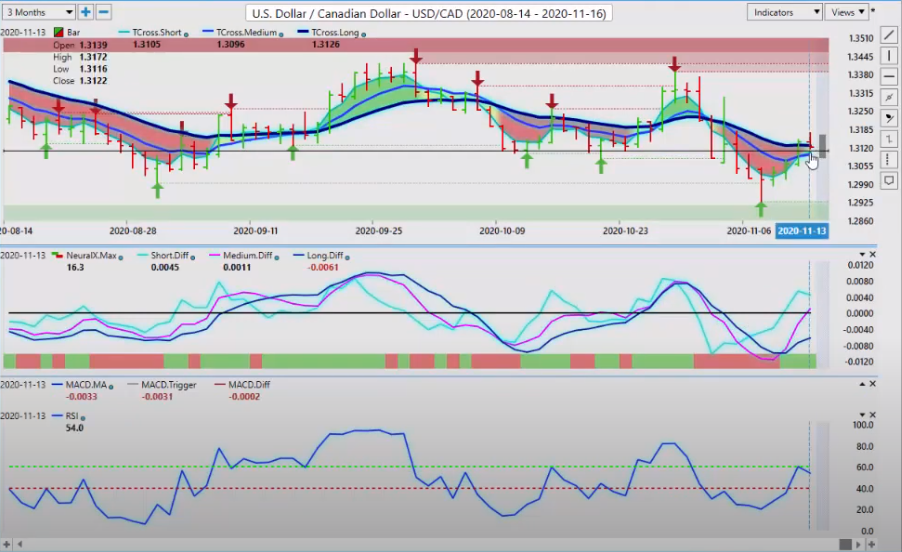
U.S. Dollar versus Canadian Dollar
And this is again, if nothing else guys, this is a warning sign. You should take this as a warning sign not to continue to sell down here at these levels down around 129, 12990. Right? So as the neural index goes from red to green and the medium term crossing the longterm predicted difference advances, you can see that the market starts to go with it. But we must clear this level at 13126. It’s still struggling. When we click on our F8 here, we can see that we actually do have somewhat of a two day rule here. That one there is debatable, but it’s very, very close. It’s closed above the blue line. So to start the week, our main pivot area, if we’re going to continue to buy from here is 13086, but we can assess also that vantage point has now added this red shading in here that warns us to be cautious about actually buying in that particular area.
Australian Dollar versus U.S. Dollar
But if we can hold above 13126 and hold above more importantly, 13086, then we are likely going to start advancing back over towards the 133 level as oil equities start to weaken into the end of the year. Now with the Aussie and the New Zealand, very much the similar trade. They’ve had a decent week, but here again is that very ominous signal. So when we talk about predictability in the vantage point software about what’s likely coming, you can see the medium term crossing the longterm predicted difference. And that is what sent this lower. Now in this particular setup, it’s sending it lower, but it’s not saying it’s a trend reversal. It’s important to understand how to interpret the indicators. What it’s telling us is that we’re going lower in the overall current uptrend. Now the uptrend is identified by the T cross long 7201.
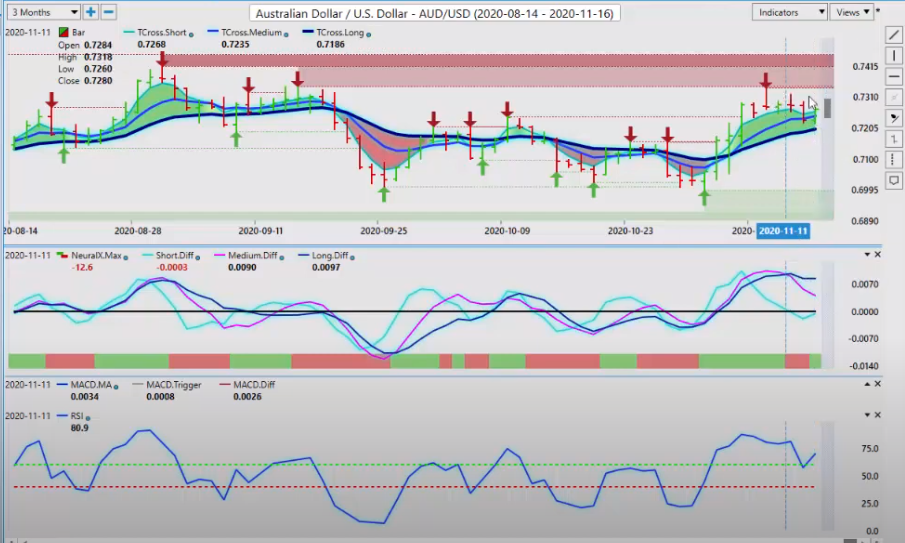
Australian Dollar versus U.S. Dollar
We’re above this particular level, but it’s warning us that we don’t have a lot of buyers. There isn’t a lot of momentum in the Aussie pair up at this 73 level. So we’re going to move lower. The medium term crossing the longterm predicted difference has accurately shown us that. But now we have to have some follow through. So again, when we click on our F8, you can see we closed below the blue line for one day, but then the very next day, which of course is Friday, we close back up above the market, right? So this is how it gets tricky. So watch the key level. 7259 is what we want to watch plus the T cross long. The exact same thing shows up here on New Zealand.
New Zealand Dollar versus U.S. Dollar
You can see New Zealand right now has made a big push up towards this verified, I’ll just back this up so everybody can see where vantage point is pulling that area from. It looks like I have to go a little further than I thought. Now, the verified support and resistance zones, they’ll go back as far as they need to define where that level is. And that’s where it’s picking it up from ,all the way back on the March 21st, 2019 high. That’s where that level came from. Just so you know, the AI goes in, it goes all the way back, years if it has to, to find a resistance zone up here. So it found one, the market then, the medium term crossing the longterm predicted difference is warning us that, okay, there isn’t a lot of momentum. Now with a signal like this, with the neural index, that is a huge warning sign that this pair is getting ready to move significantly lower.
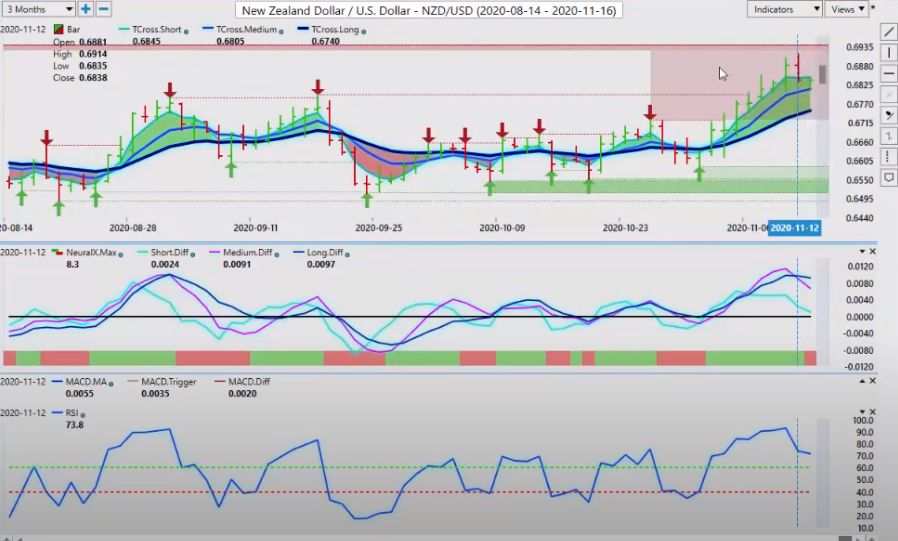
New Zealand Dollar versus U.S. Dollar
But the key thing within our market analysis here, guys, is to understand that this could be a signal for multiple other markets. Oil, the S&P 500, they will all follow this payer, or this pair will follow them. Whichever way you want to say it, as long as you identify that correlation. So if you’re trading the Aussie, the New Zealand and the CAD, you’re going to be keeping a very, very close eye on oil prices and more specifically the S&P 500. So with that said, this is the Vantage point AI Market Outlook for the week of November 16th, 2020.
Are you using A.I. yet?


