


VantagePoint AI Market Outlook for the Week of November 9, 2020
VIDEO TRANSCRIPT
U.S. Dollar Index
Hello everyone and welcome back. My name is Greg Firman and this is the VantagePoint AI Market Outlook for the week of November the 9th, 2020.
Now to get started this week we’re going to begin where we always do with that very important US-dollar index. Now it would appear, at hindsight, that the US election is resolved and Biden has been elected, so we’ll see if the dollar can now recover here after a very dramatic week. I’m not convinced that the election is completely resolved at this time. We’ll see what happens next week.
U.S. Dollar Index
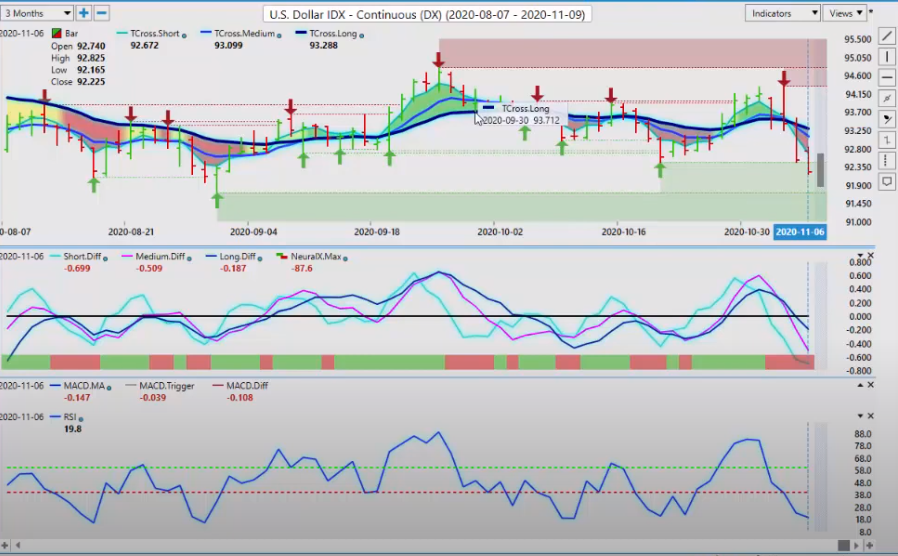
But, again, when we look at the dollar, the dollar has been in a relatively strong selloff here. Now, we’re coming into a critical VantagePoint verified support low, that low coming in at 91.71. We can see that our MA diff has crossed down, we’re continuing to move lower. Our RSI is hitting an oversold condition, but that doesn’t necessarily mean that the market’s going to bounce here. What we could see is more volatility with a contested election, a number of different things going on there.
But if we can hold the 91.71 level, then what we’ll be looking for is a reversal, a short-term reversal, corrective move… Excuse me. …if nothing else. So again, that corrective move would be back towards the 93.28 level. Now, if we can break through 93.28, then we could move lower. The first obstacle will be to get through and above the VantagePoint long predicted. That’s coming in at 93.01, so we can identify all of our resistance levels. So what we’ll be watching very closely to see is whether or not the neural index can turn from red to green and the MA diff
GOLD
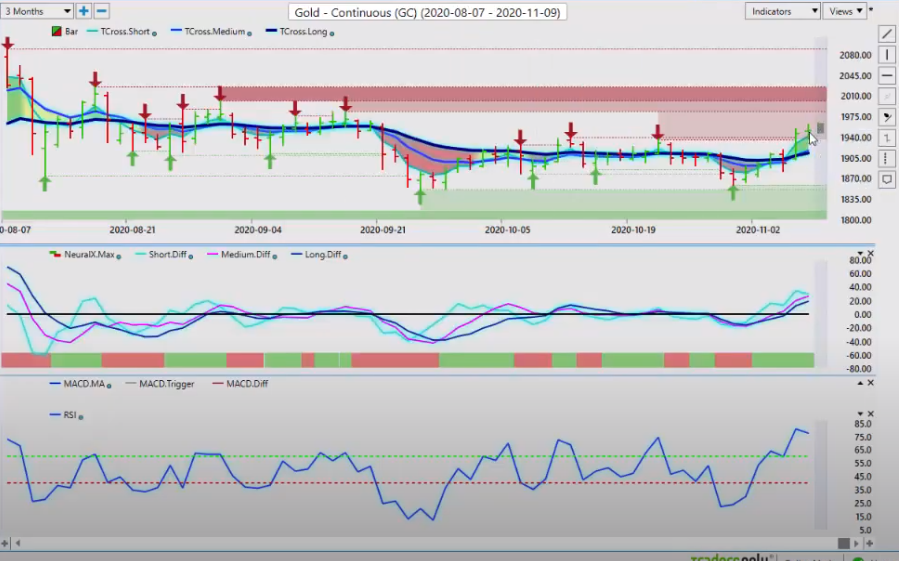
Now, with that, gold continues to advance. We’re pushing through a major resistance level yet again here at 1936.00. But again, if the political environment in the US starts to settle, then we could see gold back off a little bit here. But, again, the COVID is still moving forward, nothing has really changed. We also have to see whether the Democrats take control of the Senate as well as the House and if they do, that could change the dynamic of gold also.
Gold
So again, we’ll be watching these key levels, but for now we can assess that we’re holding clearly above the key VantagePoint level, the T cross long, at 9313.00. And again, even a bigger level that we’re holding is above the long predicted at 1926.00. But what I will be watching very closely will be to see if we can actually stay above this most recent high around 1936.00, 1939.00, and see if that level can now become the former resistance, will turn support. So we’ve come back down, kissed that on Friday. Now we’ll see where we go.
S&P 500 Index
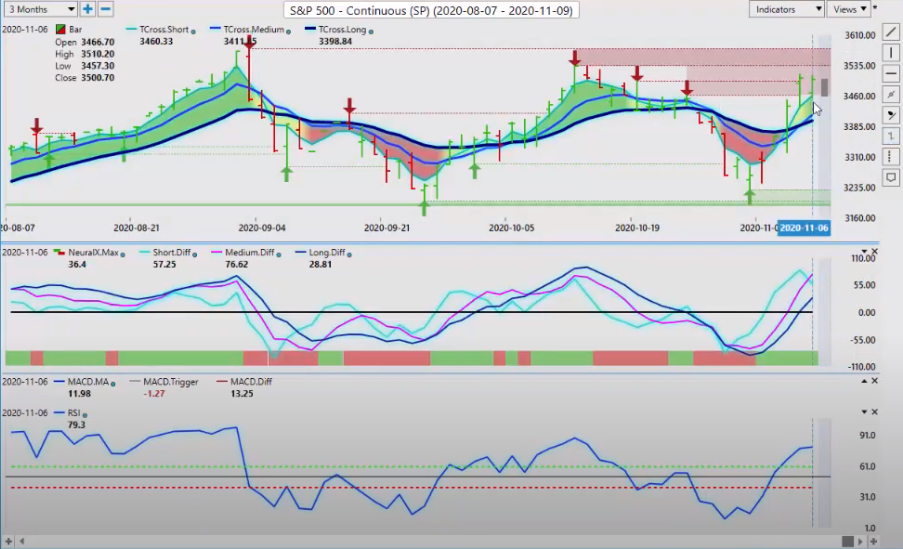
Now, with the change in the presidency, we’ll look and see how the S&P is going to be affected by that, but right now we’ve had a very strong rally off the yearly opening price, which coincides with a major verified-support low at the 3200.00 mark, so we have failed just above that 3200.00 mark, and we’re moving higher.
Now to see a turning point, using the VantagePoint software, this is what we look for: the MA diff, the medium term crossing the longterm predicted difference. The neural index we can assess, stays basically neutral or down for the next three or four days, but when the neural index turns green, what the MA diff, the market starts to rise. That led to a very, very significant rally.
S&P 500 Index
Now, when we click on our F8, you can see when the market came up it hit the predicted moving average and failed. But the very next day we advanced past that, closed above it, and the market’s been moving higher ever since. So to start the week, the level we’re going to be watching is the long predicted at 3422.00. I would imagine, right out of the gates, the equity should do pretty well, but expect a pull-back towards this area and then we can reassess from there.
Crude Oil
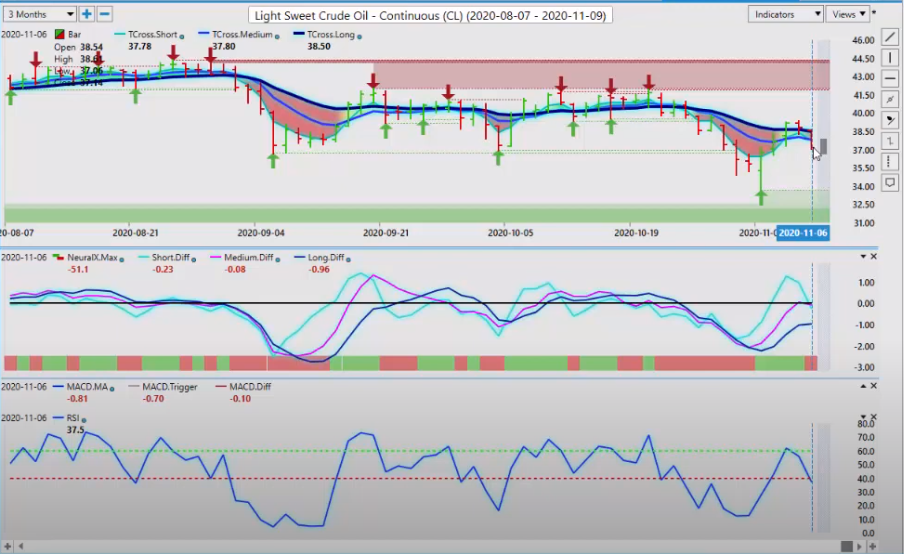
Light Sweet Crude Oil. Oil, of course, following the equity markets higher, but, once again, when we look at the equity markets closer, they’re nowhere near… or the oil markets, excuse me… in comparison to the equity, oil is nowhere near as strong. So what I would like to see is that the equity markets move on their own value and oil does. Demand is still low. Supply is very high in oil.
Crude Oil
So, once again, we’re failing into this key VantagePoint level. Our neural index is turned down yet again and our RSI is failing at the breakout point of 60.00, and now it’s trying to push lower. But, again, with this change of events, and at least temporarily we’ve got an election result here, then that may boost oil right out of the gates, but watch for a reversal on Thursday.
Bitcoin
Now, as we look at the additional markets here, one of the markets that I’ve been very, very pro for several years now, but more specifically over the last three or four months, I’ve been a very strong advocate for Bitcoin. And, once again, Bitcoin is just tearing higher here yet again. Now little bit of a concern here is using the predicted moving averages. We also want to make sure we’re identifying points of value in the market. So right now the T cross long 13603.00. I don’t know if we’ll pull back that far, but if we click on our F8 in the software, when you use that predicted moving average, you can see that all the way back here, when we first started crossing over the blue line, we’ve been in constant contact all the way up. We’ve been doing this in the VantagePoint live training room for months, using this blue line as an entry point.
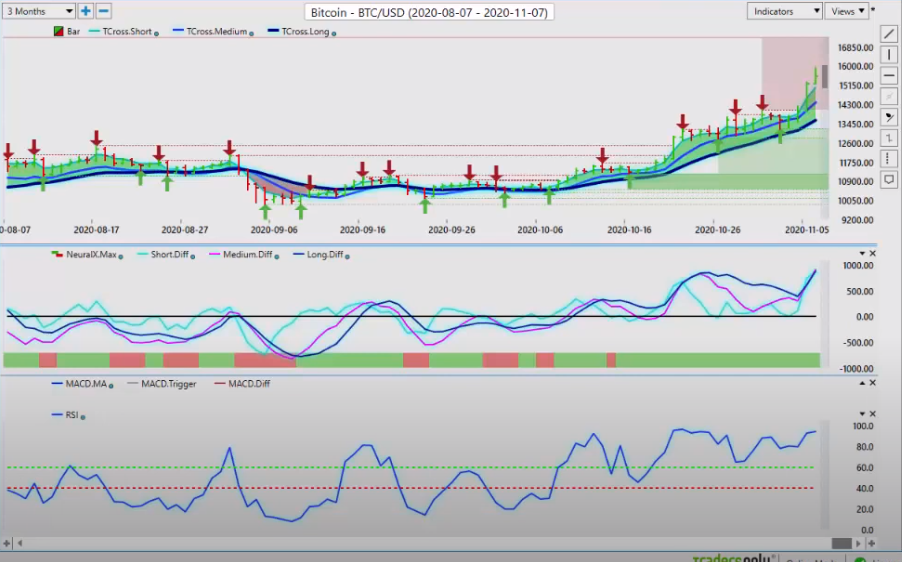
Bitcoin
Now, once again, our point of value to start the week will be 14606.00, so we should expect a pull back to that level, particularly if the US dollar does get a boost off that 91.75 area because, remember, Bitcoin is directly trading against the US dollar. That’s how we’re calculating its value. So, again, a little bit of dollar strength could cause a pullback, but I think the pullback will be relatively shallow.
Euro versus U.S. Dollar
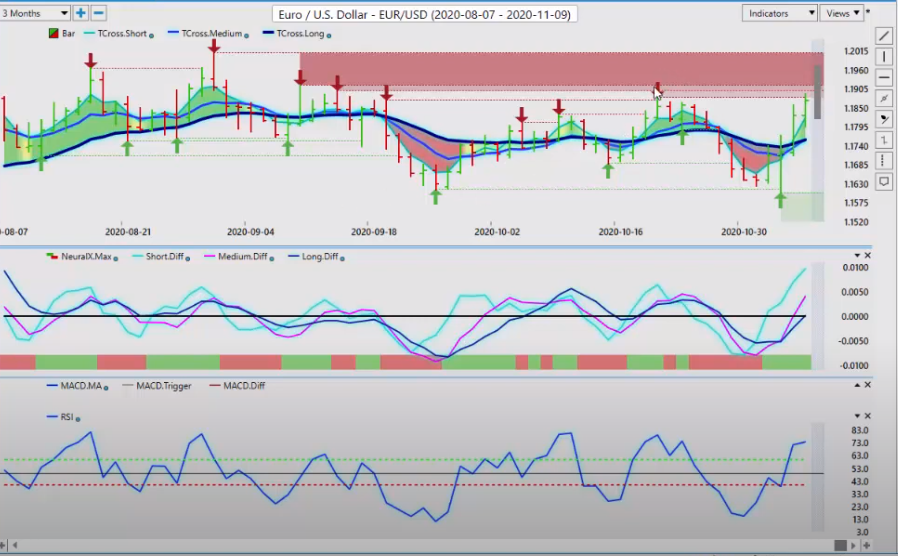
Now as we move into some of our main Forex payers, starting with the Euro here. Now the Euro coming up against a very stiff, verified resistance level at 1.1916. In my respectful opinion, we must get this thing above the 1.2000 mark within the next three or four weeks. If not, the Euro is going to be ripe for a very significant sell off. Things are not any better in Europe than they are anywhere else around the planet. With COVID, Germany is going back into a lockdown here. That is not overly positive, guys, for the Euro.
Euro versus U.S. Dollar
And then on top of that, maybe some of the issues in the US are getting resolved. That’s left to be seen, depending if there’s any court challenges on the election ballots and all that. We’ll have to wait and see how that one transpires. But, for now, we’ve got very, very strong resistance up here, so we’ll continue to monitor it. The indicators from VantagePoint are still saying it’s positive, we’re going higher. The neural index is positive. We’re above the 60 level on the RSI. But, again, watch your levels, your point of values.
Now, point of value is a place where the market feels that there’s value. So the T cross long 1.1758, long while above that level, our intra-day pivot level, that’s coming in at 1.1771. So, either way, if we’re going to look to go long on this, we would like to see the market pull back to this 1.1750 or 1.1771, and then monitor the neural index very, very closely. The neural index has been on fire. Ever since the COVID stuff started here, guys, the neural index has been incredibly accurate. So if it goes from green to red, then keep a close eye because it’s likely it is we’re getting ready to move lower.
British Pound versus U.S. Dollar
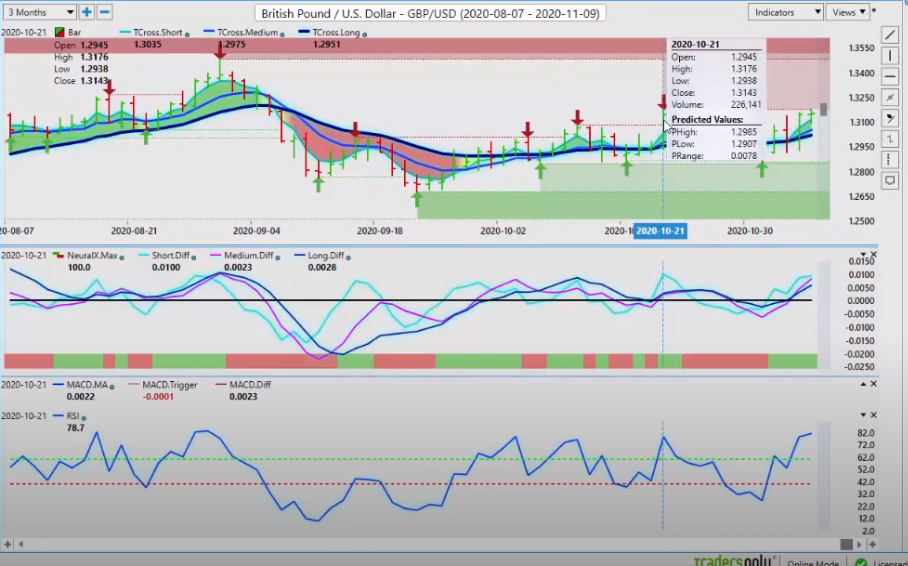
Now the pound/dollar. Once again, very stiff resistance here. At our most recent verified zone here, that high coming in at 1.3176. I would like to see the pound completely out of this 1.3200 area, and then I think we could see a bigger rally. But, once again, the dollar could bounce back here. May only be for a short term, so we want to keep an eye for… be very cautious of a bull trap up here, is what I’m saying, guys. Around the 1.3200, 1.3250, 1.3176, in this particular area. If there’s a bull trap setting up, this is where it’s going to be.
British Pound versus U.S. Dollar
But our MA diff cross is crossed to the upside. Our neural index is positive. But we are getting a little bit overbought on the RSI at 81.2, but don’t let that scare you. Trading off overbought/oversold conditions are very rarely profitable. We watch our key verified zones and we look for a confirmed break of 1.3176. If we can’t break above this level and stay above this level, then ultimately we are likely to retrace back into the 1.3017 level.
U.S. Dollar versus Japanese Yen
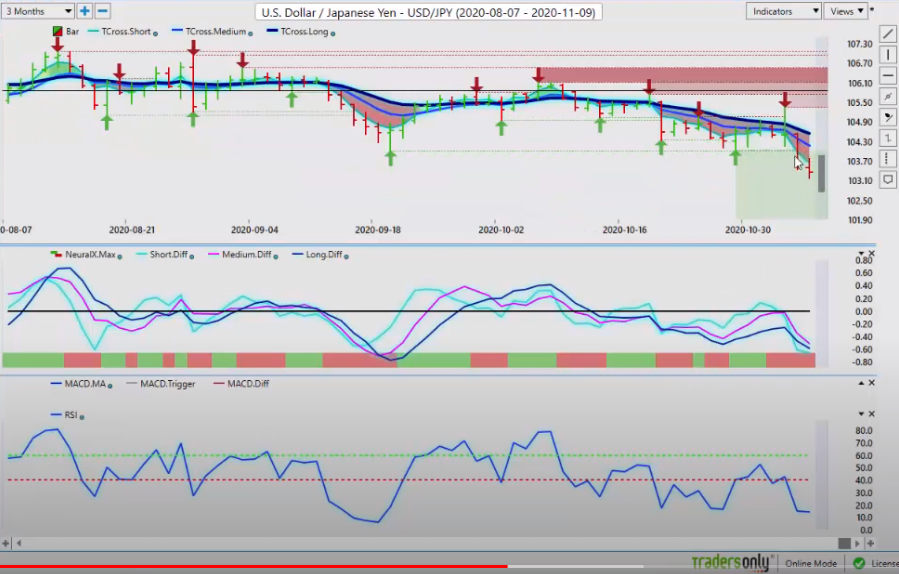
Now, with the dollar/yen, going into next week. The dollar/yen, fairly significant sell off. As you can see here, we’re moving lower. The key VantagePoint level, the T cross long 104.55. We’re looking for the market to continue to hold below this particular level. Now I believe as long as gold remains firm, then the dollar/yen will be pressured to the downside. So watch that inner market correlation.
U.S. Dollar versus Japanese Yen
Right now, that key level at 104.55. If we click on our F8, we look at our predicted moving average by itself, we can see 103.98. So the first hurdle that this payer will have to overtake is the 103.98 area. Still very stiff resistance, but we could see a relief rally in the dollar with the election, if the election is actually behind us, which I assume it is. Again, I’m in Canada, not in the US, so I’m just going by what I hear in the news. So I think it’s resolved, but I’m not sure. So we’ll see. But right now watch the 104.00 level very, very carefully.
U.S. Dollar versus Canadian Dollar
Now with the US/Canadian pair, we have our three main equity-based currencies that I talk about each week. When you’re trading the CAD, the Aussie, the New Zealand, you’re basically trading the S&P 500, guys. That’s the deal. So right now the Canadian dollar is coming into a very, very heavy support level, down in this 1.2990 area. Now, that’s also consistent with the yearly opening price, so be very cautious around this level with either shorts or longs. Okay?
Right now the VantagePoint software is still forecasting the neural index. We’re below the T cross long at the 1.3173 level. And we’re also below the key pivot level of 1.3115. So if we break 1.3115, we are likely heading to 1.3175. And if we break 1.3175, the sky’s the limit, potentially, if the dollar does rally here. But, again, I’m not convinced that there’s enough meat on the bone here for the dollar to rally to any real extent.
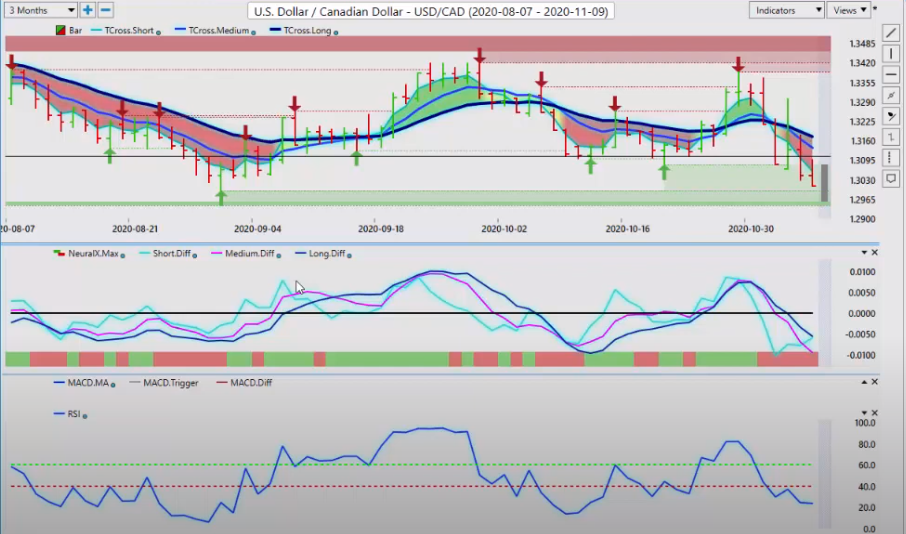
U.S. Dollar versus Canadian Dollar
But be aware that there could be a counter trend long setting up here. If you see that neural index going from red to green, then that is the likely trigger that this pair is going higher. That would mean equities lower and oil lower. I do see oil going lower, I’m just not convinced that the S&P… So, again, watch your key levels. The main thing I always say, “Know your levels,” and identifying those levels, because this is because this is an outlook, not a recap of something that already happened. Always remember that. Going into battle, so to speak, next week, you need to know your levels.
Australian Dollar versus U.S. Dollar
Now, the Aussie and the New Zealand, both moving above their yearly opening price. Both look to extend gains. If the S&P 500 continues to advance, so will the Aussie and the New Zealand, they will follow. The CAD is the weak link between these, and that’s because of oil. Oil does not affect the Aussie and the New Zealand quite as much, but it does still affect it. But for now here, guys, that key level, 0.7146, as long as we hold above that, longs are in play.
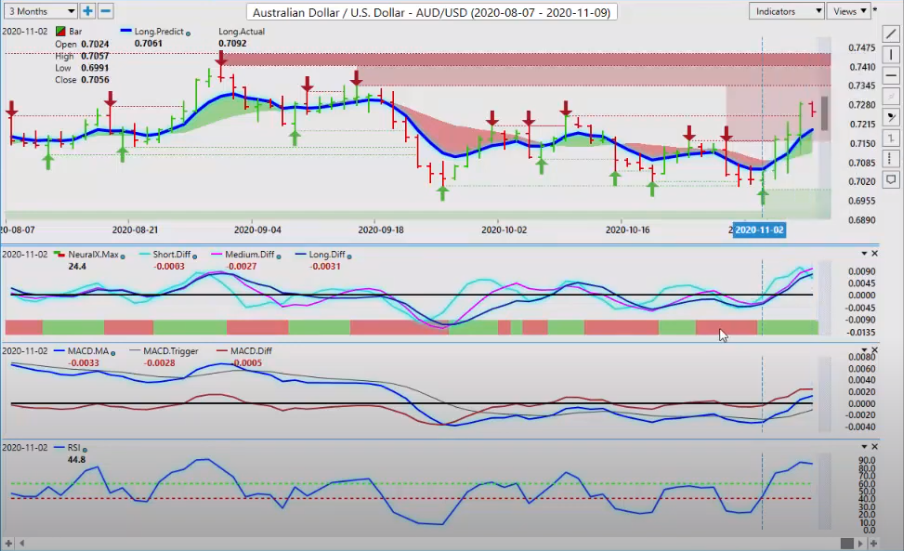
Australian Dollar versus U.S. Dollar
When we click on our F8 and we look at the blue line by itself, the predicted moving average, using that as a pivot area, we can see exactly when this turned. You can see the neural index going from red to green, and the second we closed above that blue line this led to a nice move up. So we’re looking to repeat that same thing this week, guys. Our point of value, 0.7195. We’re looking for the market to come down to that level. For Monday’s trade, you can see that the predicted low is also 0.7195, making this a very good entry point to start the week.
New Zealand Dollar versus U.S. Dollar
The same deal with New Zealand here, guys. New Zealand, it’s made a little bit bigger of a push. Bit of a concern I have up here is we’ve done a full retracement back to the high. But you’ll notice that the red arrow here, that the most recent high was slightly higher. So I would be looking for a move a little bit above this high at the 0.6798 mark.
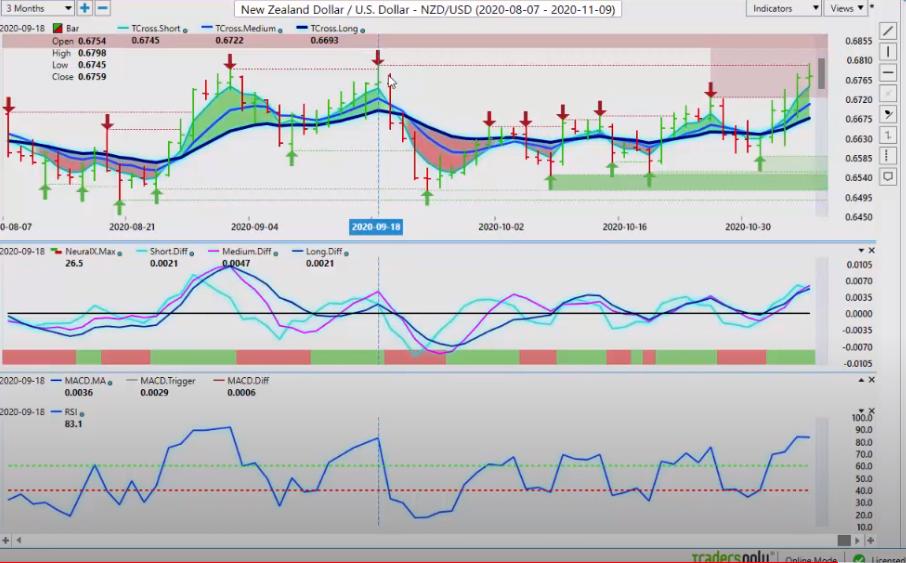
New Zealand Dollar versus U.S. Dollar
I think we can potentially extend. When we backed out our VantagePoint software, we can see that we’re moving in a sideways channel here, and we’re looking for this channel to break. The key thing you want to look for here, guys, is the S&P 500. If it’s advancing… and I could see maybe another 30, 40% upside, potentially, on the S&P 500… then that would be probably at least another 8, 9% on pairs like Aussie/US, New Zealand/US, maybe even US/Canada on the downside, if these two break higher. So there is, potentially, some very good value coming up here on a reversal on the dollar, whether that be back to the downside or the upside. I think there’s enough meat on the bone here for just about all of us.
So with that said, this is the VantagePoint AI Market Outlook for the week of November the 9th, 2020.
Are you using A.I. yet?


