


Welcome to the Artificial Intelligence Outlook for Forex trading.
VIDEO TRANSCRIPT
Hello, everyone. Welcome back. My name is Greg Firman, and this is the Vantage Point AI Market Outlook for the week of September 1st, 2021. Now, to get started this week, we’re going to begin with the U.S. dollar index. Once again, I will bring up the indicator list to show you what I’m using this week in the outlook. We’re using a 33-week look back. So the 52-week look back has been modified. We’re using bars, not candle, the predicted short, medium, and long-term difference, the neural index, the point in time used for the weekly opening price, the predicted RSI, the triple EMA cross, and of course, the very important verified support and resistance zones.
US Dollar Index
So when we get started here, looking at the dollar, we can see that the dollars had a very poor week. Now, the previous week, using that weekly opening price, we can see that the dollar had a very good week. This pattern goes back for weeks, if not months, and it seems to flip flop back and forth between a good week and a bad week. So last week was a very poor week for the dollar. We had a big sell off on Friday based around the fed comments. More likely than not, the dollar will recover. Now, what I’ve discussed over the many years doing this is dollar cycles, institutional money, real money that needs to buy U.S. dollars. This usually occurs the week of the non-farm payroll number.
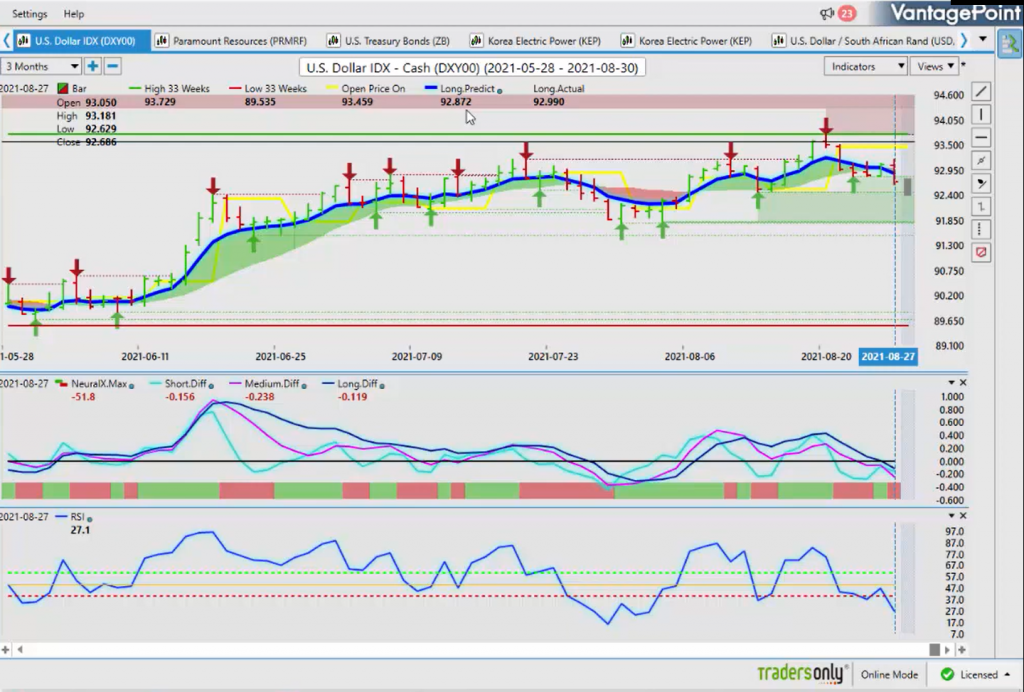
Now, this week is going to be particularly volatile because, again, we have a holiday. We’re going into the Labor Day weekend, a long weekend, so expect heightened volatility, but remember that there are institutions that are required to buy dollars. So if we look at this right now, again, the fed comments have what sent the dollar lower on Friday. In my respectful opinion, he really just said a lot of nothing on Friday. It was very noncommittal to really anything. So the markets overreacted, in my respectful opinion only, in thin illiquid markets. We have heavy support on the dollar index at 92.47. So it’s very important to monitor where the market opens on the week and whether the market can stay above it or below it just like the yearly opening price.
So again, we see our predicted differences moving. So what I suspect is the dollar will come under further pressure on Monday, but be very careful of a reversal on Tuesday, Wednesday on Thursday, back to the upside. Because again, using this point in time as the weekly opening price, we can actually see a pattern with the dollar and a number of other different markets. But for now, our key resistance level is 92.85. We’re looking for the market to get back up above this price. If we click on our F8, the predicted moving average by itself at 92.87. So once we get back up above that level, we should see the dollar extend higher back to about the 93.46 area, where we must break above that level. I’m not sure that we will, because again, the market is still digesting the comments from Jackson Hole.
We look at the overall range. The dollar is indisputably bullish on the year. The yearly opening price is way, way down in the 89.80 level, I believe. But when we look at our 32-week, we get an overall structure of the market. We don’t get caught up in day to day or even two or three weeks signals, where something is going up or down. We must look at the overall structure of this particular market. The dollar is getting very toppy up here, of course, but it seems that every time we make a new high, we have a significant pullback before we have our next big move up. So again, if that dollar recovers, then we could see pressure on oil this coming week. We could see pressure on the S&P 500 and gold, but again, that would be a shorter term move that we can manipulate. So again, watch these particular pivot levels. If the market closes back up above 92.87, that will confirm the institutions are again slipping in here and buying dollars because they are required to.
Gold
Now, if we cross-reference this to gold, now gold is making a push. Again, a lot of analysts are getting very bullish on gold, but gold remains trapped below this 1833 level. We must push through that particular level if gold has any chance of going higher. The medium term crossing the long-term predicted difference, in my respectful opinion, is accurate here, and it’s warning that this gold trade here, the gold long, is may not be as strong as what we think it is. But again, this big bar that is moved up on Friday was all based around the fed. The market is a very short memory here, guys. They’re more than likely going to disregard what the fed has stated and they’re going to focus on a strong payroll number this Friday. That is likely going to keep gold pinned below 1833. But if we can get above this verified resistance, then gold has a real shot of moving back up to the 1900 mark, which I believe it could do by year end, but I think it will be very difficult for that next week.
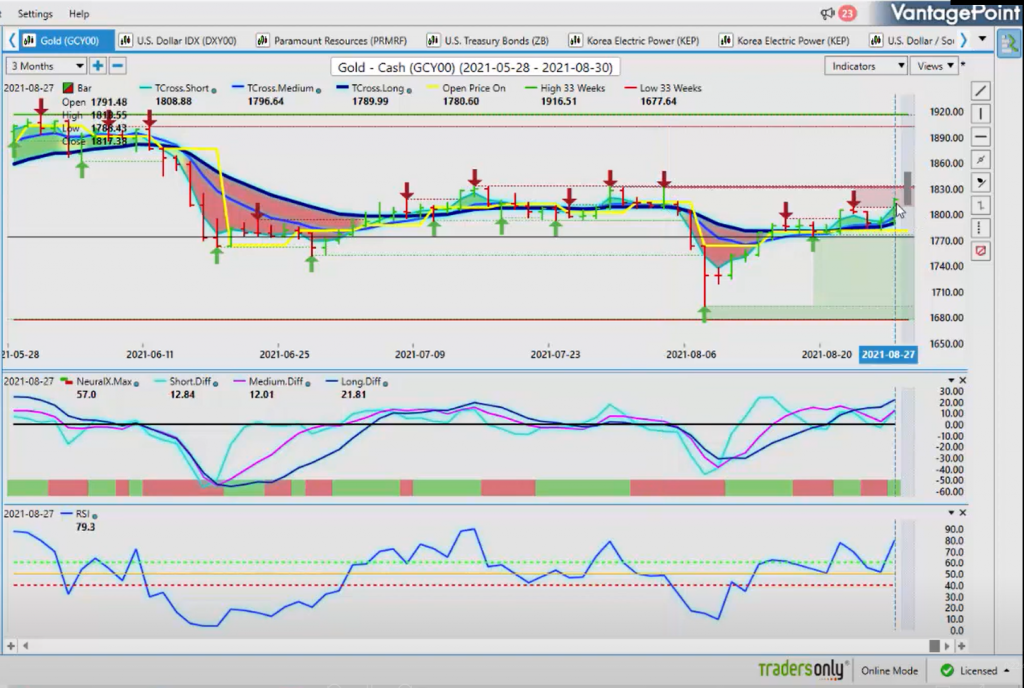
So we look at our support level. Our support level here is coming in at our T-cross long at 1789. So as long as gold can hold above that, it remains bullish. But again, my optimism on that remains heavily guarded because of the week that we’re going into. So I suspect we’ll get a push on Monday. Tuesday and Wednesday may not be very favorable, however, for gold. So as long as you know those key vantage points support levels, then you will know how to play this. The additional one, again, using that F8, we’ve got our long predicted at 1799. So we can clearly identify the area. If you’re still a gold buyer, then this is the area you’re looking to buy from. Now, again, if you are not a gold buyer and you’re a seller, then you would look for potentially a final push here to the upside by midday Tuesday, and then look to short this.
S&P 500
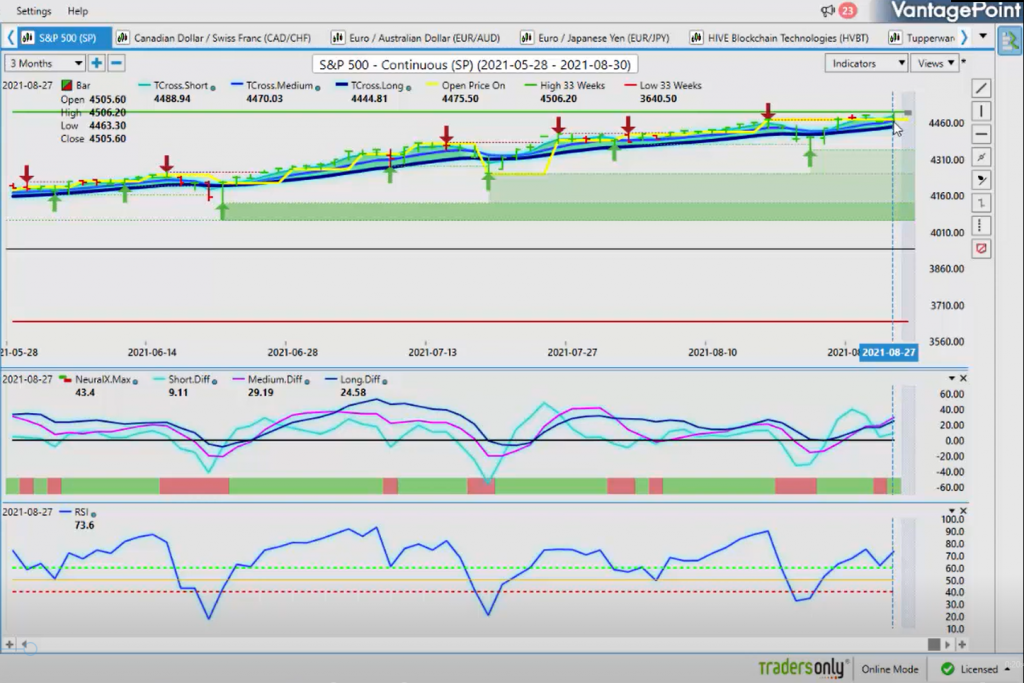
Now, as we look at the S&P 500, the S&P 500 is just basically unstoppable as it keeps moving higher, but if it was going to have a corrective move, it would be this coming week based around patterns, season, at monthly seasonalities, and again, those institutional demands around the U.S. dollars. So in most cases, when the dollar strengthens, we see the S&P 500 pull back. So if we’re looking for a pullback, obviously longs have been a clear better play here. But if we look at this right now, our T-cross long 4444, that’s our main level. If we click on our F8, we can see that we’ve got, again, that predicted moving average by itself at 4477, also a very strong area to watch. Our predicted RSI is saying we still have upside momentum. Our MA diff cross is moving to the upside. So everything is looking still pretty decent for equities, but we can’t rule out a pullback on dollar strength.
OIL
Now, when we look at one of the better trades and probably next to Bitcoin, oil has been a very, very strong buy and continues to be in 2021. So, what we really want to do here is not get caught up in short-term trading of one month, where oil is slid a little bit. Remember here, when we’ve hit our top in oil that is coming at the beginning of July, this is officially when summer trading starts, guys. And then we have the fed coming in, talking about maybe ending that the QE and stuff like that, which put a little bit of pressure, plus the Delta variant. But here is the thing, guys, this is where we’ve started the year and this is where a less experienced traders struggle with some of these charts is that when we look at the overall move from the beginning of the year, if we go back into January and if you’re a longer-term trader, then we can see that this move is significant.
So if we look at it from a one contract basis, and again, I’m not going to put up five contracts on that, just a single contract on oil futures, this has been one heck of a trade in 2021 and it still is. So when we look at this right now, even if you’re still long from the beginning of the year, this is perfectly normal to have these types of retracements in oil, but it’s been a very good buying opportunity on these dips. Now, if we look at it, some of the more recent ones, and we’re using the indicators in vantage point, now if we look at this and we match these indicators with the MA diff cross right here, as you can see, that leads to a very significant move. Again, where most traders are looking at potentially the very short-term indicators, then buying on dips is still extremely powerful.
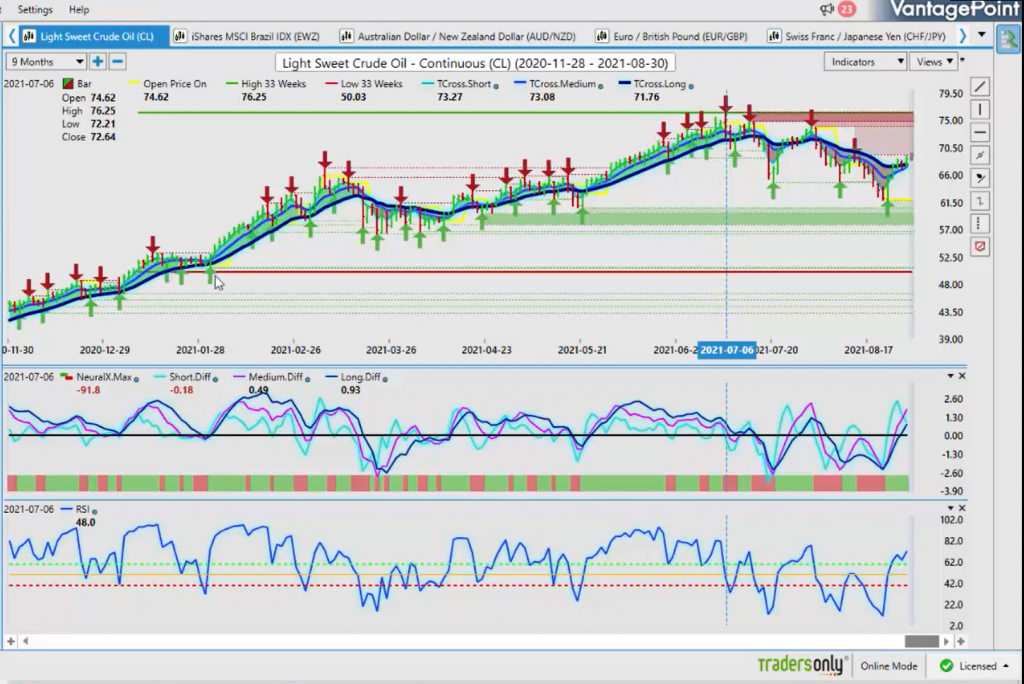
So again, if we look at it again right here, and I could do this repeatedly, I could play this game here all day, guys, if we look at this again with these oil contracts. This is the most recent one, just from last week that we were doing in the VP live room. Again, if we look at just a one contract basis just from this previous week is $7,200. Well, people are saying that oil is not the place to be yada, yada, yada. That’s not factual, not even remotely factual if you’re looking at these indicators in vantage point, these reversal points and staying with the primary dip. Now, the way we look at this is we’re going to look at the overall 33-week outlook, or excuse me, the 33-week look back, where we can identify where the highs and the lows are. So we’ve got a high up here. The 33-week high is 76.25. The 33-week low is 50.03.
So again, if we look at even a 50% retracement level of this particular move of this particular grid, you can see clear as day that the market is coming in here. Now, if I use the point in time indicator to use the weekly open and then match it to the MA diff cross, you can see that we were long on this particular trade from the very beginning of the start of the trading week. Now, when we look closer at this now, the same… You could have some analysts that will say, “Well, oil is not the place to be yada, yada, yada.” Again, there’s nothing factual in that particular statement. When we look closer at this, we can actually see that there’s been very good buying opportunities.
Now, you could take the same thing on the downside. There’s enough meat on the bone here for both buyers and sellers using that MA diff cross. So you can write it down and then write it back up and you can move with the market. But when we understand that oil is firmly above its yearly opening price, when it’s holding above its weekly opening price, we have the MA diff crossing with the neural index. This is how we get into trades early, guys. We ignore the noise in the market of the fed and all these other things. We can clearly see these trades, but when we understand this, how good of a long oil actually has been, we can pick up additional trades from this. Now, you’ll notice this date here. So I’m going to do things a little differently this week to show you guys intermarket correlations in real time from this past week.
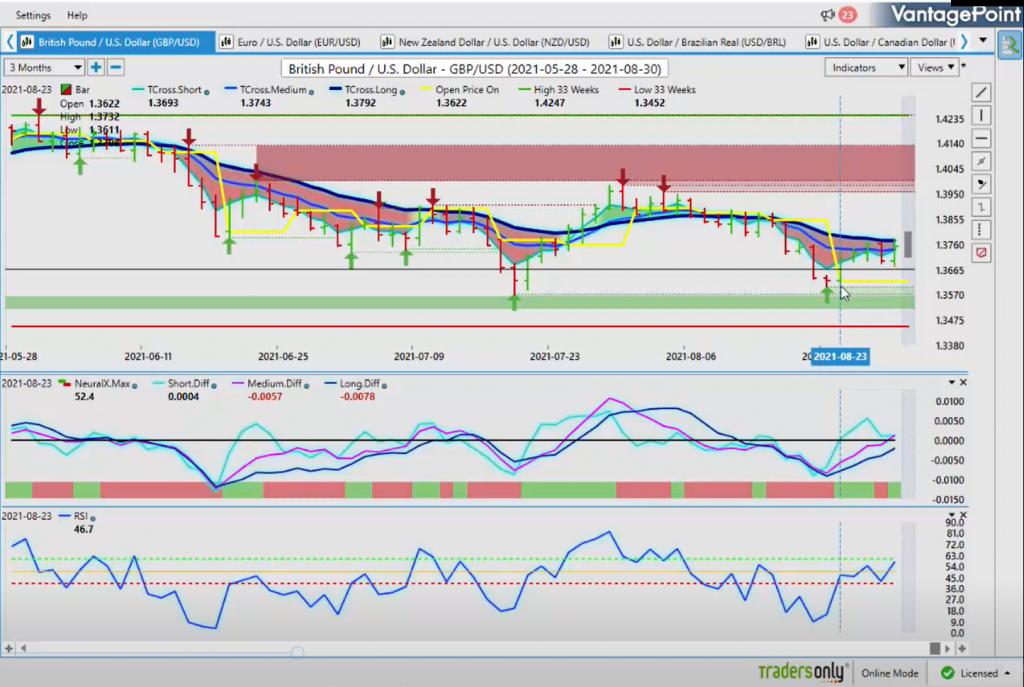
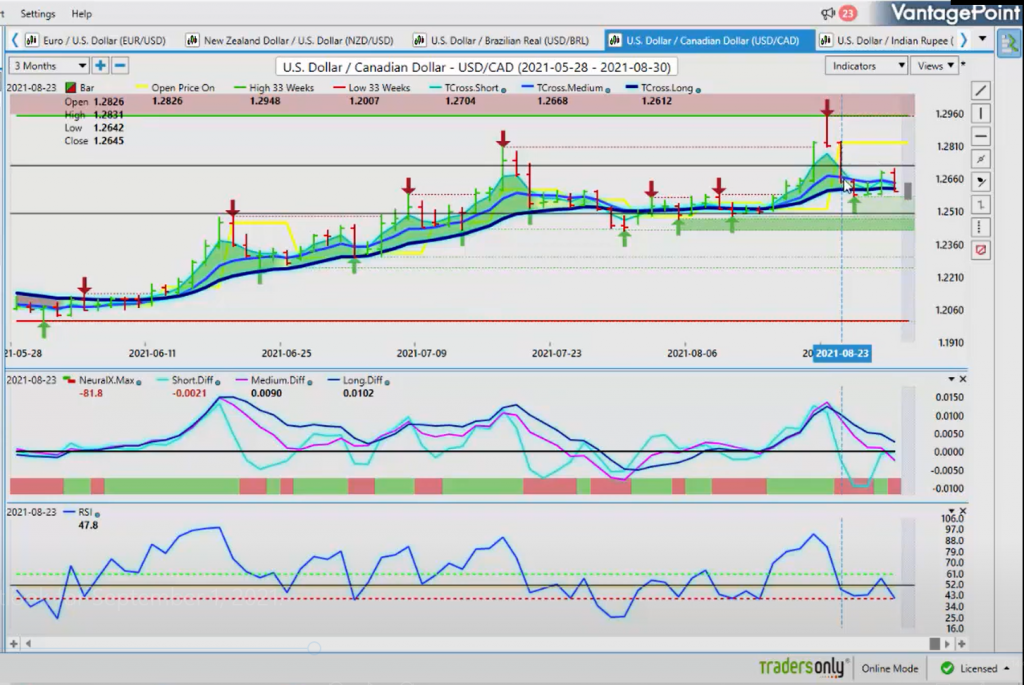
When we look at that MA diff cross and we’re using oil, as the buy signal on oil was strong from vantage point right off the start of the week, right? When we cross-referenced this to two pairs, then in the Vantage Point live training room, we’ve worked directly on this. We can see that we have an immediate buy signal on the pound dollar also. The British pound has a very high correlation to oil. This chart evidences that. We can see the MA diff cross is producing a very similar signal with the neural index. The other pair we look at is the U.S.-Canada. The same thing, the weekly opening price, the market immediately fell off the weekly opening price. We’ve got the medium term crossing the long-term predicted difference to the downside, but the real trigger here, guys, was oil long trade. The oil futures long let us to those other two trades.
If you understand those intermarket correlations, then you can do a form of naked trading, where you can use less indicators and just apply the intermarket correlation and saying, “Okay. We’ve got a buy on oil.” So if we have a buy on oil yet, again, because again, when we look closer at those oil contracts, we can see that there has been multiple, multiple long trades, even during a corrective move. It’s all you can call this, guys, is a corrective move lower. There has been all of these buy opportunities using that MA diff cross. So when we see this, we can immediately go to certain pairs, like the British pound, like the U.S.-Canada, and we can trade off of those. So again, if oil continues to advance past, we need to clear 69.38.
Now, that’s going to be difficult this week. So when a lot of people are just now starting to get long on oil, there actually could be a short here because of the dollar cycle and at this time of the month. So if the dollar cycle, if the dollar gets strong, then very often that will push oil back down for a week or two or a week and a half. Usually, the dollar, no matter how good that number is, the dollar weakens on the Tuesday or the Wednesday after the non-farm payroll numbers. So assuming all of that comes to fruition again, then it could be very unlikely that oil is going to clear the 69.25 mark. But again, if we use our point in time, at Monday night, this indicator will draw the weekly opening price, and we’ll put it to the screen. We use that with the bars to guide us through this.
Again, so if oil cannot hold above the weekly opening price, then likely it is the dollars going to strengthen, gold is going lower, oil is going lower. That could send U.S.-Canada higher, that could send Great Britain-U.S. lower, but we connect the dots to these very simple trades that actually all formed from the oil contract. So keep a close eye on oil this week, because it will be, again, a leading indicator as to which way the dollar and some of the other markets are going to go.
Now, when we look at Bitcoin, Bitcoin is taking a bit of a pause. But once again, understanding the Bitcoin trade and the many trades that come off that, that I’ve done in last week and the week before in the outlook, is you have blockchain stocks, you have ETFs, you have a lot of different ways. You don’t necessarily have to trade Bitcoin futures. You can just trade… Again, GBTC has been an excellent ETF. We’ve got high. We’ve got HUT.TO, Ethereum spinoffs, ETFs on Ethereum. All of these have done… These are the top performers guys. When you hear people saying, “Bitcoin is a scam. It’s this. It’s that,” just please ignore them. The annualized returns on Bitcoin are well-documented and they far, far outperform any individual stock, any commodity, any currency.
The NASDAQ is the second closest relative that is producing these kind of returns. Even the NASDAQ, on a 10-year annualized return, I believe is only about 20%, which is far under the 230% of Bitcoin. So always look for an opportunity to buy some of these ETFs and use Bitcoin versus the U.S. dollar to gauge the overall health of Bitcoin or Ethereum. Both of these two are the blue chips currently of digital currencies, so keep a close eye on that. But our levels to begin the week here, again, 47,000. If we click on our F8 in our Vantage Point software, we can see that Bitcoin is struggling here to hold above this predicted moving average at 48,550. So if we’re anticipating a little bit of dollar strength coming here, then obviously that could be a bit of a problem just for a week or so with Bitcoin. So if we get a good pullback, just remember, guys, that is a buying opportunity.
Euro Vs U.S. Dollar
So, if we now look at a few currencies with our… We’ve covered the major markets, understanding some of these intermarket correlations and different outside-the-box ways of trading and understanding what if something is really bullish or bearish. Much like those oil contracts, if they’re down for a month and a bit in summer trade, that doesn’t mean the rally is necessarily over. Again, oil is clearly bullish on the year. That’s a fact, a statistical fact. So, make sure you’re looking far enough back that you’re not putting all your eggs in a one month basket. Look past that, guys, outside of the box.
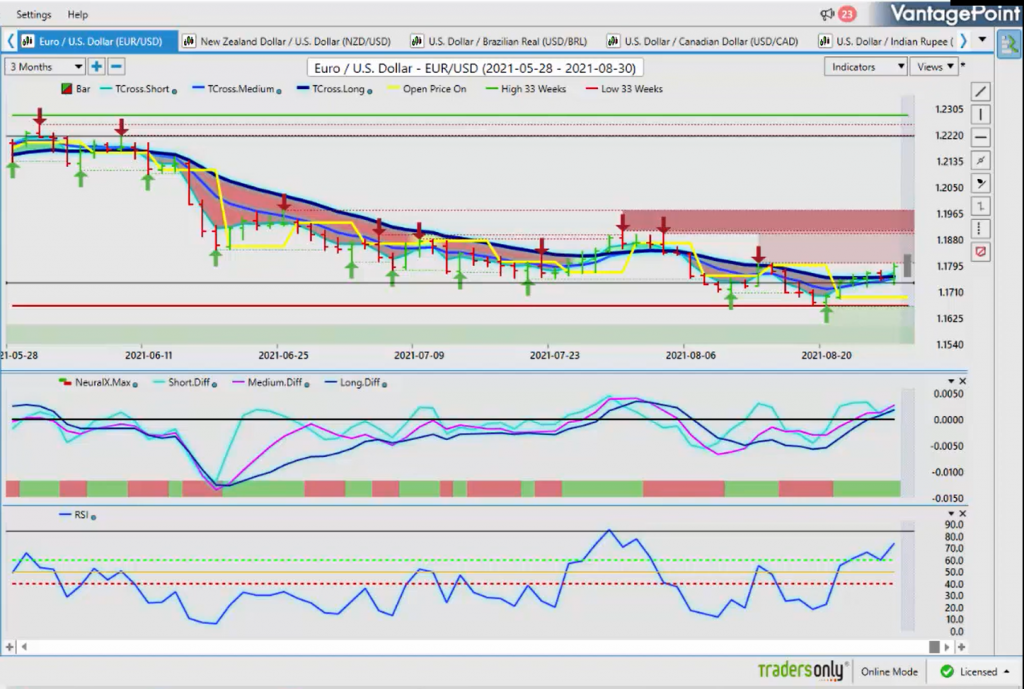
If we look at the euro, again, you can see using this weekly opening price, it shows a pattern in the euro. Again, a down week and up week, a down week, that’s kind of a sideways week, then an up week, then a down week. This is just going back and forth. But again, most traders, especially less experienced junior traders, they’re looking for these big, big moves in all of these different markets, where the more experienced traders, the hedge fund managers, the institutional players, they know that that’s not where the real big money is, where making money is a day-to-day job. Any of these markets are only trending 20% of the time. 80% of the time, low volatility, that’s what your fund managers like. They don’t want these choppy, wild swings, like we’ve seen with the fed over the last month and a half. So again, when we look at euro, the euro having an up week, in my respectful opinion, it’s not a coincidence that it stopped exactly on this verified high at 1.1804.
Be careful of a bull trap here, guys, that if this thing pops above there on Monday, chances are Tuesday or Wednesday, it’s going to crash. I’ve seen this movie before. I know who the players are. I know who the hero is, the villain, the love story, the comeback. I’ve seen it all before, but this little yellow line of this weekly opening price tells us a lot on a week-to-week basis. So the euro had a good strong up week last week. So the probability is that with the dollar cycle, that the euro is not going to fare that well this coming week.
We also have the ECB with the rate decision, and I’m willing to bet that there’s not going to be much hawkish rhetoric coming out of the ECB, the European Central Bank, so keep an eye on that. But with the non-farm payroll number, there will be no shortage of volatility this coming week. But again, we must clear this particular level, the intermarket correlations that you want to watch very closely with this is gold. If gold cannot break above 1833, then the euro will not extend higher. So again, another form of naked trading when you understand these very powerful intermarket correlations.
Our key support level 1.1759. If we click on our F8, this is where I believe that, again, the euro is going to struggle. We’ve got the long predicted at 1.1758, a breakdown below this, guys, and that’ll probably send the euro significantly lower, somewhere down or back down around the 1.1665. But if we can hold above the verified support high at 1.1804, then the euro has the opportunity or the possibility of targeting the 1.19 level. Now, again, that is unlikely based around statistical patterns when the dollar strengthens each month. I think it’s 85% of the time the dollar is strong in the first week of the new month. And then mysteriously, no matter how good that payroll number is, with the unemployment, the revisions up, we’ve still seen the dollar tank right afterwards. So again, be mindful of that.
British Pound Vs U.S. Dollar
We have discussed the British pound. Again, with the British pound, we must break through this verified T-cross long or the verified… It’s like a verified a resistance level here, but it’s a critical pivot level, 1.3775. Again, be careful of a false break around that area. We need these predicted differences moving above that zero line. But as you can see, using the predicted RSI, we’re stalling to break above the 60 level. It’s not currently showing momentum. Even after this big move up, after the fed statement on Friday, the predicted RSI that’s been modified to a nine period, the overbought and oversold is changed to 60-40 because we’re not ever wanting to trade off overbought, oversold. We’re looking to gauge whether there’s momentum in a trade. This indicator is saying there is not a lot of momentum until we break above 60. So we’re above 50. That’s a good thing. It’s slightly bullish, but we must push through this critical vantage point level.
U.S Dollar Vs Japanese Yen
Now, again, with the dollar-yen, normally, in this particular coming week, we see a very, very similar pattern using this weekly opening. So we have a down week, then we have an up week. Then we have a down week, then we have an up week. So with that indicator, leaving that yellow line behind simply showing us where that weekly opening price was. You actually see that it develops into a repeatable pattern. So in most cases, what I’ve always stated is be careful of Monday trade. If dollar-yen takes a big move lower on Monday, that, in my respectful opinion, would be a buy because the chances are the dollar-yen will then move higher on dollar strength for the rest of the week until we get that payroll number.
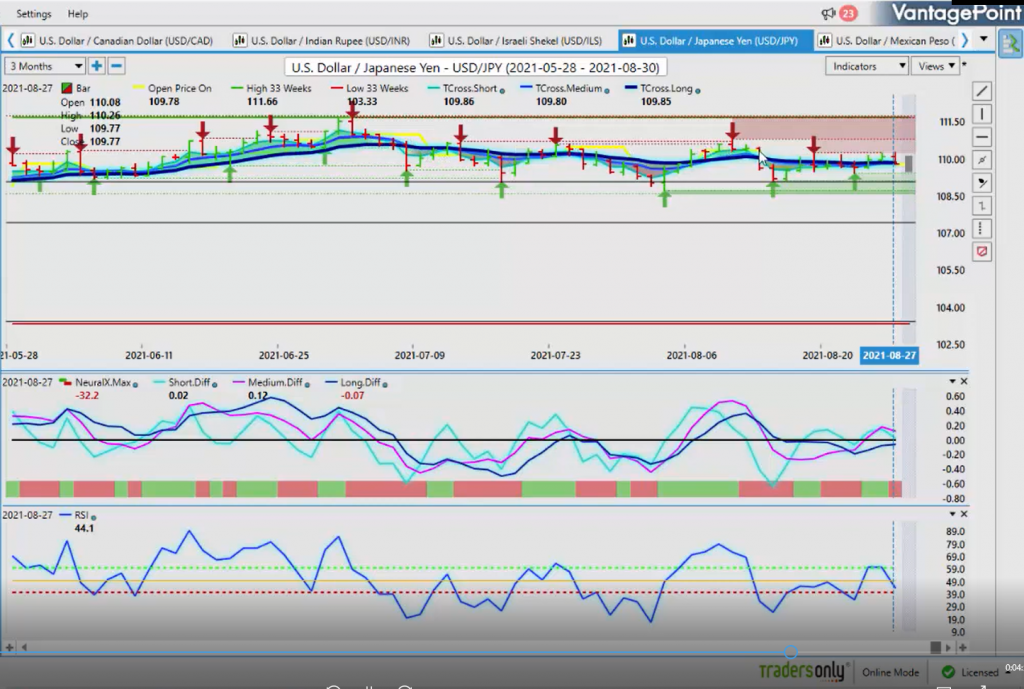
Right now, we are moving completely sideways here. There is no big… You’re in a very tight range between the high of about 1.1080 and we’ve got our low down at about the 1.0872. So if we move down towards that level on Monday, on Tuesday is, again, would likely be a decent buy. Our MA diff cross is still pointing higher, despite everything that’s been going on, right? The fed and everything else. So in my respectful opinion only, the price was correct prior to the fed speaking on Friday. By Tuesday, that will continue in that particular direction. So again, as long as you know the main levels, you will be fine. The T-cross long, 1.0985. If we can get above this thing and stay above that level, then we are likely going to move back towards the 1.11 mark.
U.S Dollar Vs Canadian Dollar
Once again, with the U.S.-Canada, I think I’ve already spoke to that, basically showing you guys the direct intermarket correlation. So when equities traders say that they don’t trade currencies, well, that’s not factual. They could be trading stocks, but trust me, you are trading currencies, you just don’t realize it, or you are trading commodities and you just don’t realize it. Now, again, oil futures will always be more stable than oil stocks. Oil stocks can drop 20, 30, 40%, while oil futures drop four or 5%, very similar to the S&P 500, moving 1% of its value per day, like a forex pair, or one of the individual stocks inside that could be moving 10 or 15 or 20% of its value per day. So a lot of volatility when you go to the individual stock versus the index.
Australian Dollar Vs U.S Dollar
So with oil contracts here, U.S.-Canada is holding the line here, but this pair is notorious for the Tuesday reversals. So if oil is very strong on Monday and U.S.-Canada breaks down, the chances are you’ve got to buy here. Now, heavy support has built up along this verified support low at 1.2579. That would be your focal point to keep a very, very close eye on that particular level. So again, by midday Monday, if we’re still above 1.2579, then that doesn’t bode well for oil or for U.S.-Canada or indirectly Great Britain-U.S., but you can see a very similar pattern, a big move up on U.S.-Canada in the previous week, only to be followed by a big down move. So the next course of action would likely be up if we look at the dollar cycle. So once again, oil and equities are a driving factor of the U.S.-Canadian pair, of Great Britain-U.S., and of course of the Aussie and the New Zealand.
New Zealand Dollar Vs U.S Dollar
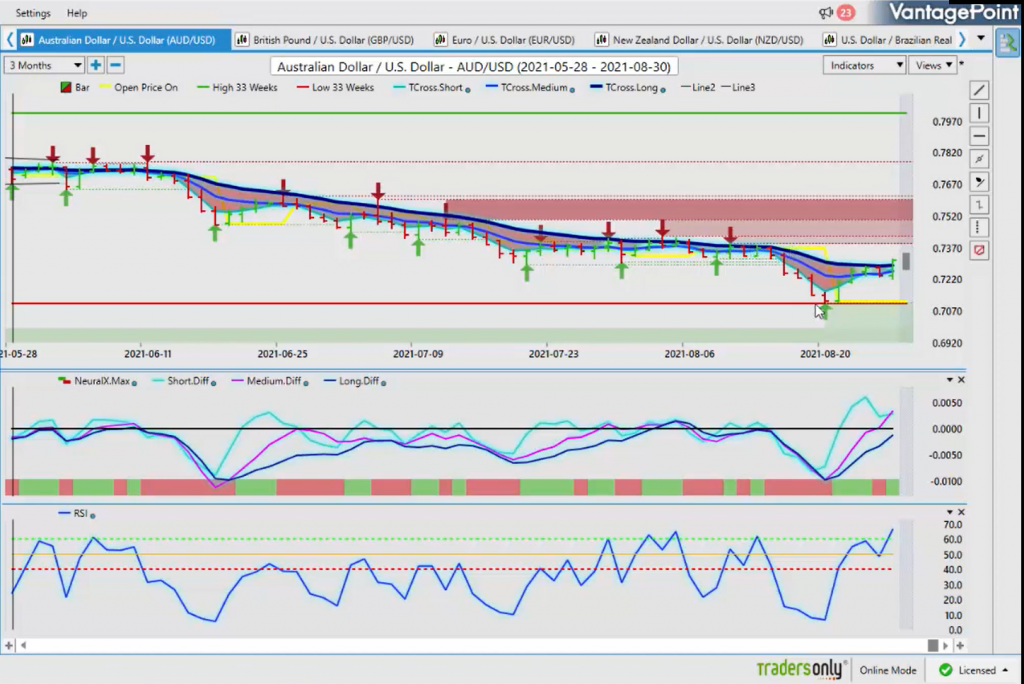
I think that the Aussie and the New Zealand have been the odd man out lately, but you see a very similar pattern using the point in time set to the weekly opening price. We get a big down move one week, only to be followed by a big up move the very next week, right? So Aussie is struggling along this T-cross long. That area is coming in at 72.60. I think it will be very difficult for the Aussie to extend this coming week. We could see the same thing with New Zealand. Now, New Zealand remains the stronger between the two, but again, the divergence between the two central banks, between Australia and New Zealand, I still feel is the driving factor. COVID cases, yes, that’s a factor for sure, but they’re increasing in both New Zealand and Australia now. So New Zealand is handling it better indisputably.
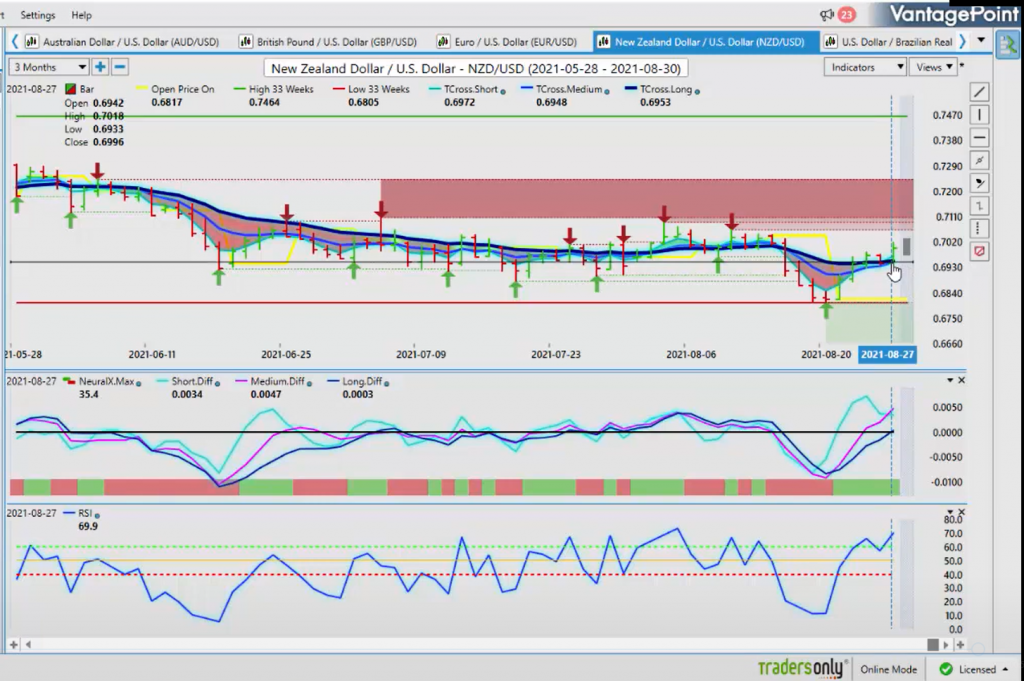
But regardless of all this guys, you can see the pattern using that weekly opening. You have a big down week, then you have a big up week. So, what’s next? Likely in this week is likely a down week. That coincides with that dollar cycle. We are going to have a very choppy end of the summer here. So our focus will shift into September, but I believe that there still will be some very good trading opportunity going into next week if you know your levels and you know your intermarket correlations. So with that said, this is the Vantage Point AI Market Outlook for the week of September 1st-


