


Welcome to the Artificial Intelligence Outlook for Forex trading.
VIDEO TRANSCRIPT
Hello, everyone. Welcome back. My name is Greg Firman, and this is the Vantage Point AI Market Outlook for the week of September, the 13th, 2021.
U.S. Dollar Index
Now to get started this week, we’re going to begin where we always do with that very important US Dollar index. But first we’re going to review the indicators we’ll be using in this week’s presentation. We’ll be using bars, our longterm difference, our medium term difference, our Neural Index, of course. The point in time where we’re setting to the weekly opening price, the predicted high and predicted low, short term predicted difference, triple cross and of course the very, very important verified support and resistance zones. So, to look at this presentation, to simplify this and to try and provide additional trading strategies for everybody using the VantagePoint software, what we’re looking at here is utilizing the medium term crossing the longterm predicted difference with the neural index and the additional predicted moving averages from VantagePoint.
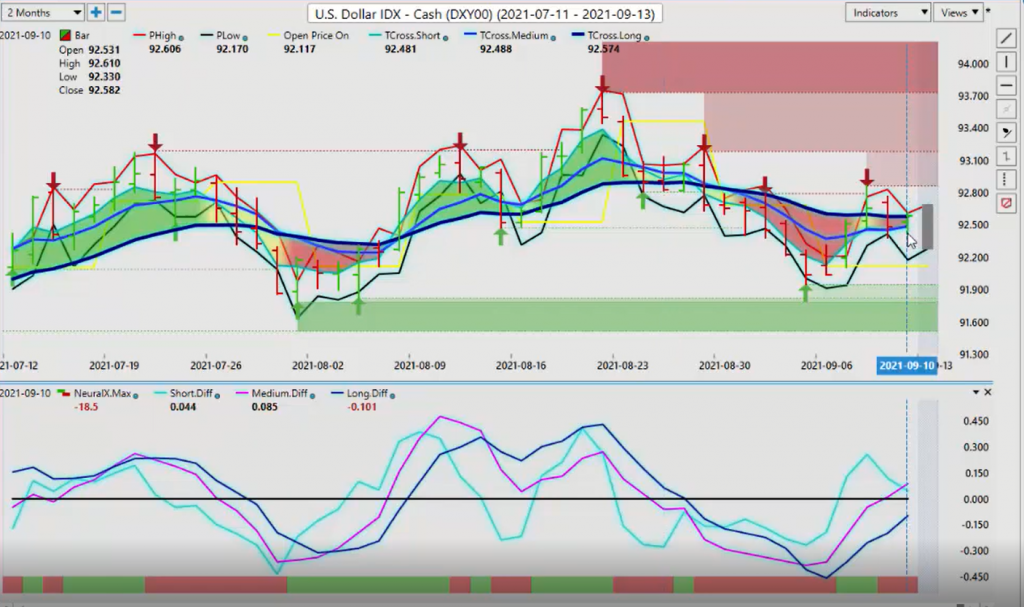
So, in last week’s presentation, despite market pundits and everything else, I had made it very clear that there was a broad US Dollar buy signal and that labor report was nowhere near as bad as what they suggested. That did come to fruition. Now this week looks a little bit different. When we’re using our VantagePoint software, you can see that our weekly opening, which is this yellow line right here, and it tells us price on open that’s 92.11, basically the dollar rallied the entire week, but we are not getting above the T cross long at 92.57. This is the level we need to overtake. So, the medium term crossing the longterm predicted difference tells us that if nothing else, we are going to correct higher to this pivot level, but we must break free and clear of that. And again, by minimizing these indicators, and again, what we can do starting the week is we can just draw a basic line off of this closing price from Friday. That closing price on Friday is 92.58.
So, we would be looking for the Dollar Index to hold above 92.58. But that level is also, is coinciding with the T cross long. So, it’s a very, very important level to start the week. In my respectful opinion, if we cannot hold above this, then the dollar will sell off probably by Tuesday or Wednesday. But if it does close above this on Monday and Tuesday, then the dollar could extend its rallies. We look at the predicted difference and we also utilize the zero line. We’ve got good separation between the pink line and the blue line, but this blue line which represents the longterm crossover, the pink line represents the medium term crossover. So, we’re looking for both of these to clear that zero line for the dollar to make a bigger move. But if the pink line starts turning back down, the slope of that starts turning back down, then basically that dollar cycle that we’ve talked about for many, many years on Trader Planet here on the VantagePoint AI YouTube channel is that there is a dollar cycle and 80% of the time the dollar sells off the week after the non-farm payroll.
Now we’re a little bit late this month because of the holiday with labor day, but it certainly does look because this trend line is now going to shift. You can see that we’ve got this big red arrow that represents a verified resistance high. So, this trend line will shift from this arrow to this arrow, making this level at 92.58 very, very important. Now, when we look at gold from the previous week, once again, we pretty much know that the dollars going, if we have a broad US dollar buy signal, then there’s going to be a broad, basically your commodities are going to suffer, oil, gold, some of these even Bitcoin and Ethereum.
Gold
But when we look at gold to start the week again, you can see that on the Tuesday, when real money came back into the market, using that weekly opening price, and then connecting the dot to this pink line crossing over the blue line. But in this particular case, gold looks like it’s getting ready for a much bigger move to the downside. We’re breaking below that zero line, but we do have very heavy verified support at 1781. If we lose 1781, there really is very little support until we’re down into the 1693 area. I believe it’s very likely before in the next four to six weeks that we will slowly start grinding down to that level. But again, when you’re starting the week, you can draw a line and put a line right on the closing price from Friday if you don’t have the point and time indicator so that closing price is 1729 on gold.
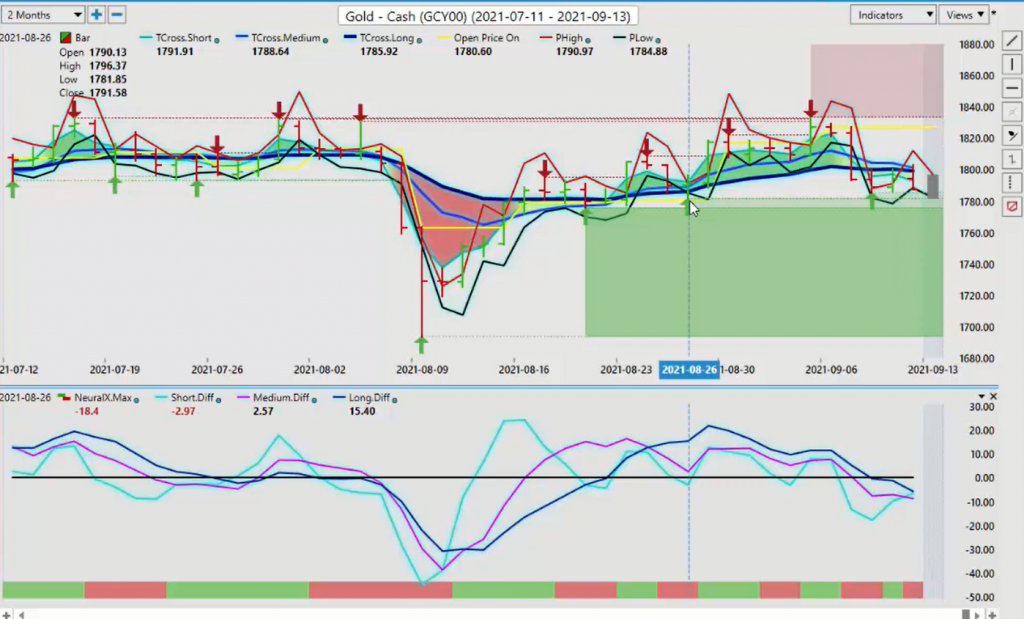
So again, excuse me, that’s not 17. It’s the closing price is 1787. So, we’re looking for the market to either stay above that level for the week or below that level. So, if we’re expecting a little bit of dollar weakness this week, then gold would likely rebound back towards the T cross long at this 17 or the 1800 mark, but it really does need to break out of this area very soon. But again, we watch our predicted differences with our Neural Index and at least for now, it’s saying that gold has further downside. Now, when we apply the same methodology to the S&P 500, we see that the signal that warned us as I had stated in last week’s presentation, that if the dollar is getting a little bit stronger, probability is it’s not going to be great for equities.
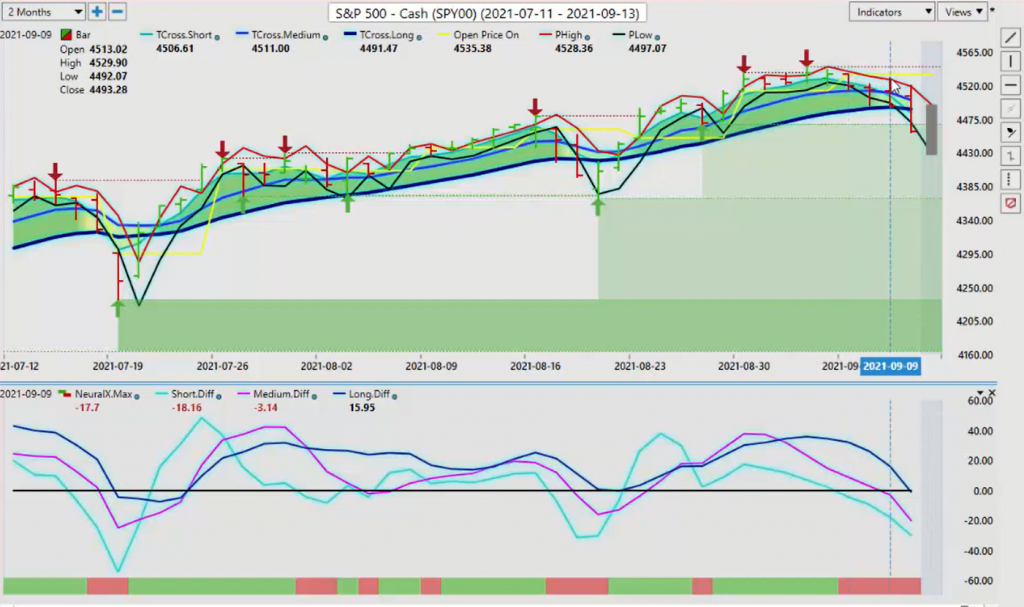
And sure enough, we’re basically struggling here. So, we’ve got this resistance building, but you’ll notice with that medium term crossing the longterm predicted difference when you match it, the second the Neural Index went from a long green period to red, that’s when the sell offs started. So, there’s virtually zero lag in a trade setup like this. And again, we also take this point in time. There is our weekly opening price rate on Mondays bar. And as you can see that the market came up to the weekly bar on Wednesday and went down even harder on Thursday and Fridays. So, once again, you combining that weekly opening price to gauge for that particular trading week, with everything that’s going on in the market guys, it’s very, very important to stay current with price. We all tend to pile indicators onto our charts and looking for that holy grail, but looking at the inner market correlations and understanding that the market is only actually trending 20% of the time, 80% of the time, we’re just going back and forth on these corrective moves.
S&P 500 Index
So, right now with the S&P 500, we could in this part of the month, start moving slowly towards 4369, but watch the verified support zone right there at 4468, because very often what happens here guys is you get bear traps being set up down here. We know that the equity markets are strong, but again, these levels, the market needs to stay either above it or below it. So, this could be just Friday trading, but the equities have been strong. My concern is, again, looking at the slope of these predicted differences, the pink line firmly below the zero line and the dark colored blue line, which represents the strength of the longterm crossover, this is pointing towards what would likely be further weakness on the global equity markets. Now, again, when we look at that and we apply the same methodology to the other commodities like oil, as I had stated last week in the presentation, that it’s very unlikely that oil is going to have any break above the OPEC high, that OPEC statement at 7061.
Crude Oil
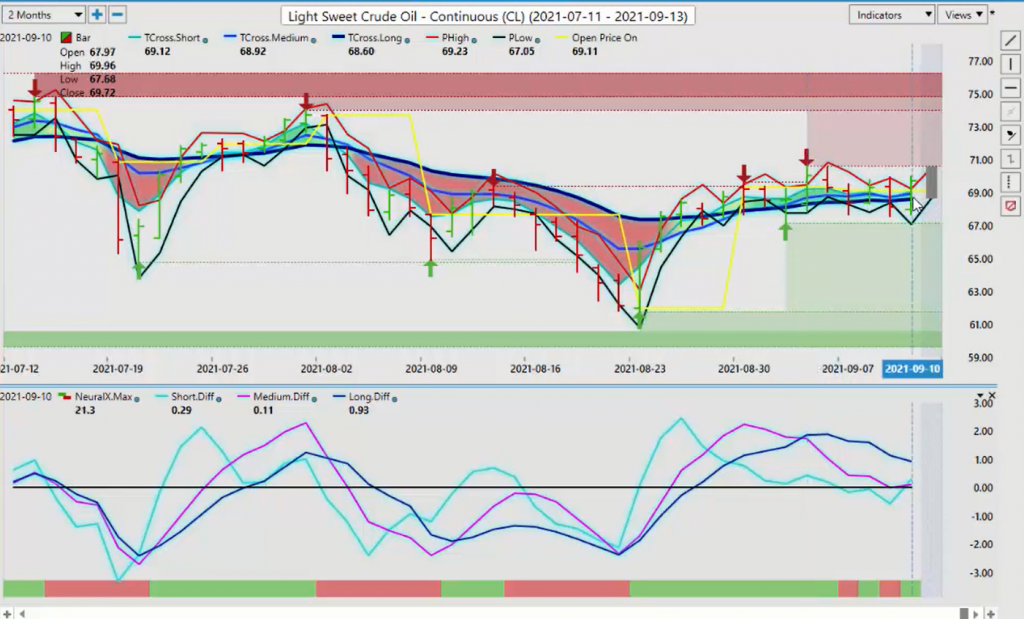
And again, you can see this yellow line running through, which is the point in time. So, there’s good selling towards 6950, but we’ve also got buyers off the verified support low that’s coming in at 6712. As you can see the buyers coming in, every time we come in, they’re buying down here and the bears are selling up here. That’s what I’ve been doing. But again, there’s a rationale how this works. We look at that MA Diff cross over here. So, we’re looking at again, at the medium term crossover and the longterm crossover at the exact same time, measuring the strength difference. So, right now, this, at least at the beginning of last week, it’s a warning sign. But now this week, you can see why this zero line is very important because the market’s come down. The medium term crossover, the strength of that crossover is flattening out.
It’s not able to break below that zero line. So, this could be a warning sign that we’re going to go a little bit higher on oil before we make our descent. So again, watch our verified zones, but until such time as this pink line crosses back over this blue line, there’s still a downward bias with oil. Now, with Bitcoin and Ethereum, I’ve added both this week just for us to look at. Once again, you can see that the market here, and VantagePoint is updating this by the way, over the course of the weekend, because the Coinbase Exchange is still open. But once again, you get a big sell off. And we expected this because we saw that in the dollar, in the buy signal or the corrective buy signal, I’ll phrase that is on the US Dollar Index, that pushed both Bitcoin and Ethereum down.
Bitcoin/Ethereum
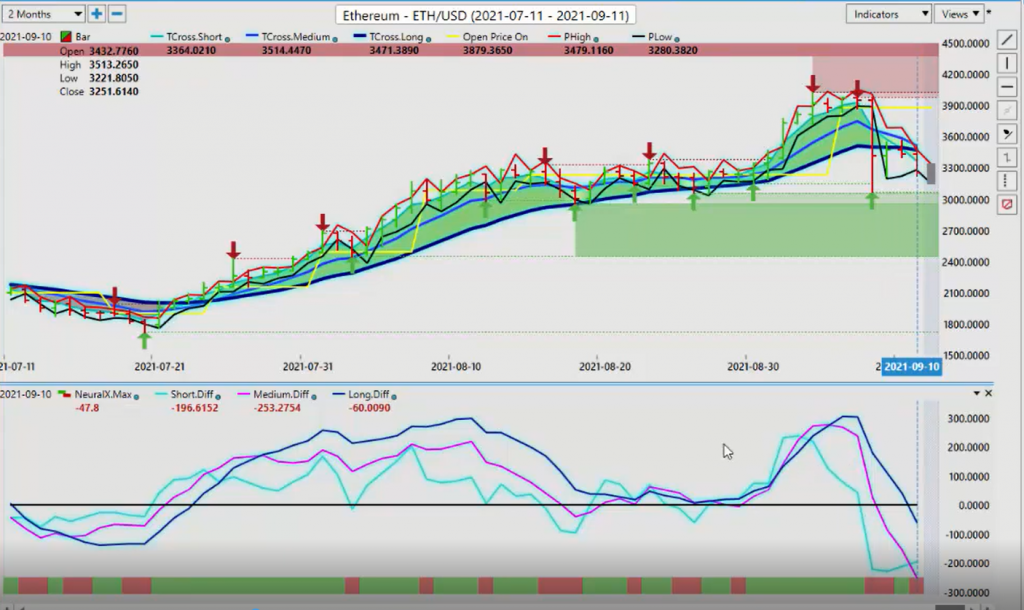
But when we look at Bitcoin right now, once again, we’re getting very overextended here. The medium term predicted difference struggling is likely going to struggle here to get going. But if we have another week of dollar strength, I still, my view is that Bitcoin is still going to recover to some degree and Ethereum is likely to follow. These are your two blue-chip digital currencies guys. I’m not trading a lot of the other ones, but I am trading these two via ETF, via CFDs, via futures. So, right now, again, we had that big sell off, but just remember here, guys, we never sell a bar that looks like this, or if you have the same thing but it’s a big bull move up, we never ever touch a bar like that. There has been absolutely no follow-through from that particular sell off.
So again, this is pointing towards that both Bitcoin and Ethereum are overdone and they’re getting ready to flip back to the upside. Looking for potential longs here, we look at the verified support low that’s coming in at 3057. So, watch that level very closely for it to hold. If it does, then we will likely see these two, both of these two digital currencies begin to reverse.
Euro versus U.S. Dollar
Now, when we look at our main Forex trading, once again, this week is, as I had stated in last week’s AI Weekly Outlook, that we have a sell signal on the Euro/US, a buy signal on the Dollar Index, a sell on gold and a sell on oil. That basically is three strikes out for the Euro. And the ECB of course didn’t help it either. But once again, we have to look at these VantagePoint key pivot levels.
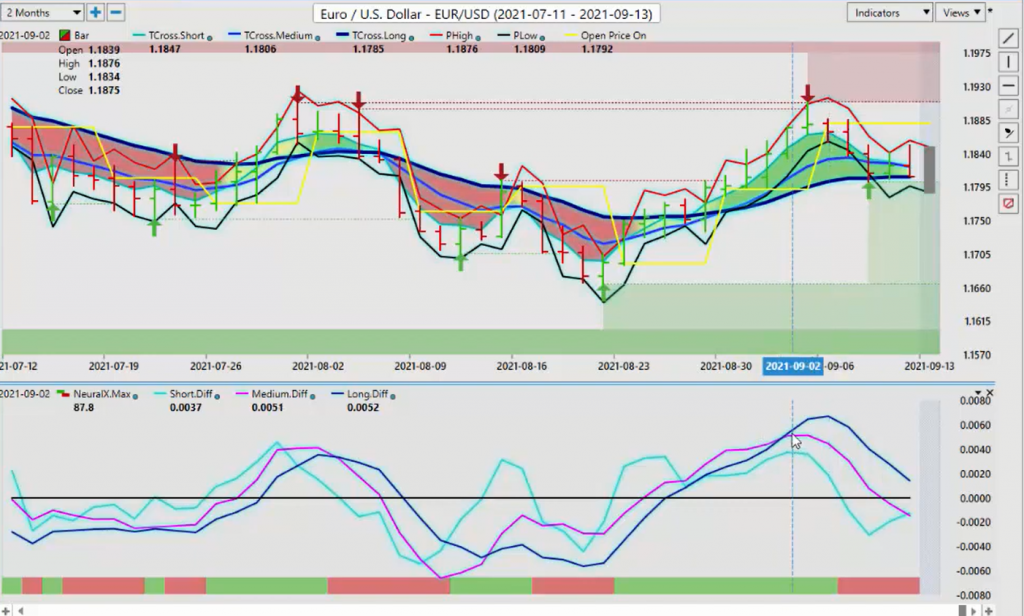
Now that T cross long is 1.1809. If gold can recover even a little bit, and the Dollar Index sells off this week, then that will push the Euro higher, but it must break down below 1.1809. We’re closing right on that T cross long. But again, looking at the trade set up from this previous week, we were well out in front of this Euro sell off very much so. In fact, we’re using the weekly opening priced as a pivot and we’re matching it to the medium-term crossing the long-term predicted difference. Once the Neural Index comes on board on Tuesday and Wednesday, the Euro tanks. So once again, we’re watching the zero line and the slope of these two predicted differences and if there’s any kind of fluctuation in the Neural Index to warn us, the predicted high and predicted low, you can see that the red line is the predicted high, the black line is the predicted low.
The predicted low has been steadily predicting, VantagePoint is predicting the Euro lower every single day. The only real-up day it had was on Thursday, but always remember here, guys, that Thursday is always a fake price, it’s profit-taking. And then on Friday, it very often goes back to what the original trend was when people are looking to get back in at a discount. So, always be careful with the predictions from VantagePoint or any other indicators you’re using on Thursday, because often they can be a little bit off, okay?
U.S. Dollar versus Swiss Franc
Now, the US/Swiss Franc, if we’re going into this week, once again, we look at the same thing. Now on the US/Swiss Franc, we have the medium-term crossing the long-term predicted difference here, but we have held above the weekly opening price. So, once again, if you just draw a line on that closing price right there, and you can put that line right onto your VantagePoint software that predicted, or that closing price is 9166, that is the main pivot level to start the week for us.
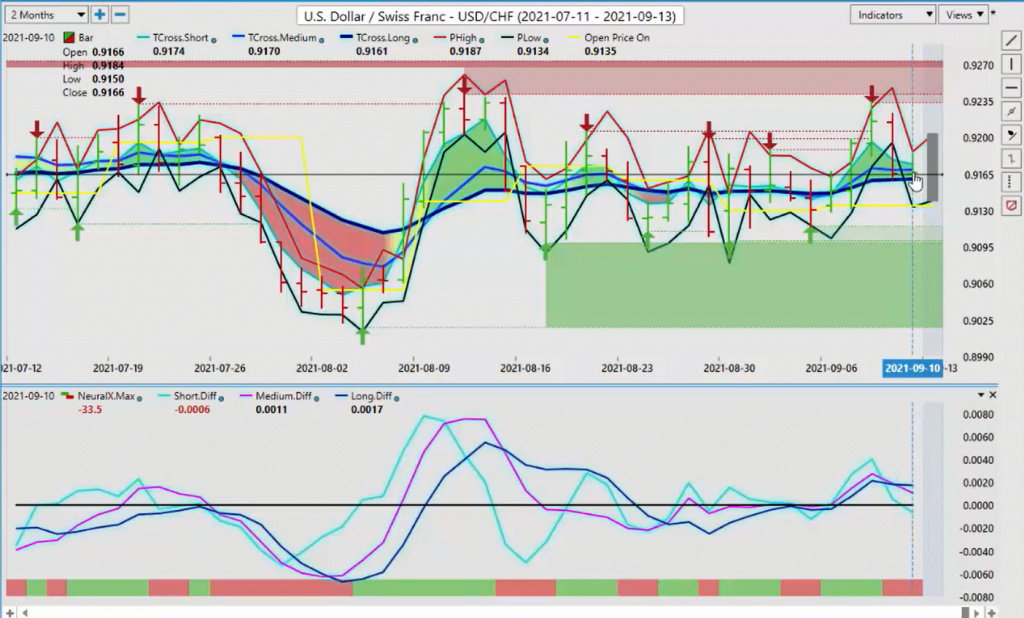
So, we would look at that, combine it with this particular indicator and the Neural Index, but again, we must look at that T cross long. The T cross long is at 9166. So, this is not that difficult of a trade here, guys. It’s going to break one way or the other here. A straddle play can be used around this. You’re going to have short orders ready to go down below the breakout point of 9160, or you can have buy orders ready to go a little bit higher and stay with the primary trend now. But again, we need to hold 9166 and the core VantagePoint indicators, the MA Diff cross, the Neural Index, they are not in agreement. So, we’ve got a bit of a conflicted signal here, but if anything, that’s warning that we could actually go lower in stocks and gold could be getting ready to stage a rebound.
British Pound versus U.S. Dollar
Now, again, with the Pound/Dollar, we apply the same strategy. You can see that the MA Diff cross from last week, we combine that with our point in time, look at our weekly opening price and any rally toward back towards that weekly opening price is met with strong selling except for Thursday. And I want to stress this a lot because I get this a lot in the VP live training room with my own client, direct client base and I always warn them, Thursday is the new Friday. The volatility when the indicators are wrong and things like this nature, it’s usually on Thursday because you’d have profit-taking from the primary move. So, you can see them selling this thing hard, the Pound/Dollar selling it very hard. They take profit on Thursday. Then on Friday, the bulls get caught up here and they’re saying, “Whoops, oh, that’s not actually a turnaround.”
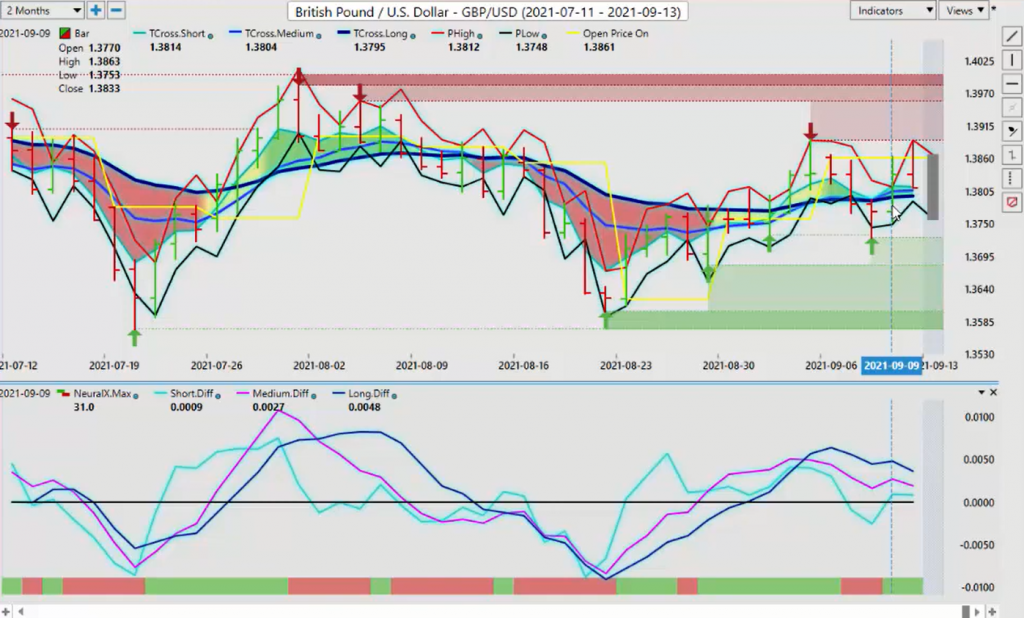
So, but again, we would stay in line with the MA Diff cross and try and again, this MA Diff cross is telling me to sell rallies. That’s what it’s telling me until such time as the pink line crosses backup over the blue line. But again, heavy resistance up at the high of 1.3891 and we must break through that. So, when you’re beginning the week with the pioneer a Pound/Dollar trader, then you can do your own point in time. Put it right on there, the closing price, 1.3809. That’s our line in the sand guys to begin the week and then we look at the Neural Index with the MA Diff, and then you can start adding in additional indicators.
U.S. Dollar versus Japanese Yen
Now with the Dollar/Yen, again, the Dollar/Yen, you can see the dollar strength holding above that weekly opening price. The only day we were able to close below the weekly opening price was again on Thursday.
So again, this is just, I’m just having an open discussion here, sharing some information with you guys that look okay. Be careful on Thursday, because as you can see anybody that sold that thing on Thursday, they’re probably turned around and got stopped out on Friday as the market reversed on them. But again, these verified support zones warn us that we don’t want to be selling in this lower 1.0959 area, at least not yet. But as you can see, the MA Diff cross actually took place way back here. So, the argument could be made. Okay, well, this is where the predicted high and predicted low come into play also. So, if that MA Diff has crossed to the downside, then we can also use the predicted high of the day from VantagePoint to set our shorts daily. Now, I often make this statement. You may agree with me or disagree with me, but in my respectful opinion, buying and holding in currencies and a lot of other markets, you’re not getting the potential that you could be.
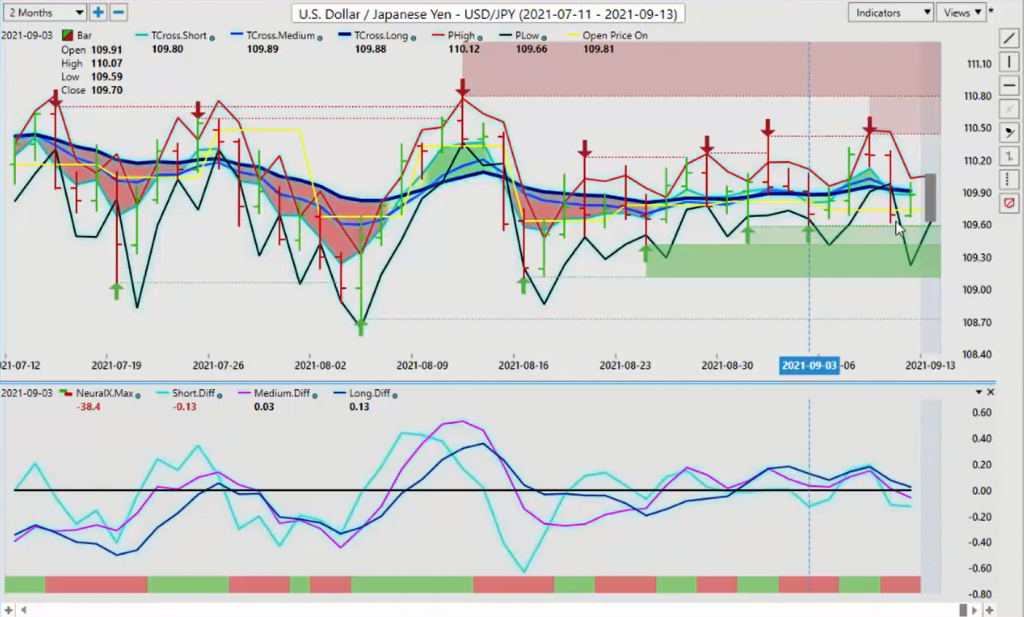
So, if we utilize these VantagePoint daily ranges like an ADR, like an Average Daily Range, then we would take profit on a daily basis. We look at the predicted high, the predicted low and say, “Okay, well the range for on starting on Monday is between 110.06 and 109.63. So, I’ve got about 40, little over 40 pips to deal with. So, if I can pick up 20 or 30 of those pips, that’s successful trading day, then I will look to wash, rinse, and repeat and do the exact same thing the next day. The beauty of the currency market is it’s misinterpreted that it’s the Wild West, it’s volatile, none of that’s true. Currencies move on average, 1% of their value per day. Most stocks, they can move 10, 15% of their value every day. They are extremely volatile, right?
So, the currencies just kind of move back and forth with an underlying theory you’re either buying or selling US Dollar. So, this particular week, our view is that the dollar is going to strengthen based around that the apprehension signal on the Dollar Index. We then apply that to the Dollar/Yen and say, “Okay, well, no, I think I would prefer to buy this particular week so I can utilize the predicted low and continue to buy that, but match it to the weekly opening price and say, okay, I’m above the week.” And by the way, I would also strongly encourage that you use the yearly opening price also. So, we’re using the yearly opening price and the weekly opening price. The Dollar/Yen is above both of those levels. It’s not strong. I understand that, but at the same time, we’re sticking with the primary biased in the marketplace.
And then we’re applying in our market correlations like gold, like stocks like oil, all of these will have an effect on the Japanese currency, right? So, to begin the week, we must clear and get above 109.92. If we can get back up above 109.92, then we have a real shot of extending back towards the most recent top. But you can see, we have heavy resistance on this pair at 110.45 currently. And we have very, very heavy verified support at 109.59. In my respectful opinion, guys, you buy the bottom and you sell the top, but you keep a very close eye on these two, the slope of the MA Diff cross because if they both break down below zero, the Neural Index stays red, then that will be likely the trigger that the Dollar/Yen is going to break through the 109.59 level. Now with the US/Canadian pair, once again, Canada’s in an unexpected election this month.
So, I’m warning people to be very, very cautious. I suspect we could have a change in government, very possible at this particular stage. So again, we will continue to monitor this, but the predicted difference once again, is what put us into this long trade way back here at the beginning of the week. In last week’s presentation, I warned everybody and said, “Okay, I know what the media is saying about dollar weakness, how bad that labor report was out of the US.” I was on the exact opposite end of that view. The labor report, the U-Six was good. My view is the average hourly earnings were decent. Things are improving. No, it’s not that bad. Oh, and of course the unemployment rate went down to 5.2. So yes, we can split hairs and pick on the report and say how bad it is.
U.S. Dollar versus Canadian Dollar
But at the end of the day, it really was not that bad. So, the dollar took on the Canadian dollar and it won and it pushed it considerably higher. But again, very important that I point this out, the only down day that US/Canada had was again on Thursday. So, anybody who was buying dollars all week, then again, they’re taking profit on Thursday. So, let’s do a hypothetical for the group here and say, “Okay, let’s say the dollar is really bad.” And the dollar cycle is still in place. And the dollar sells off Monday, Tuesday, Wednesday, and then part of Thursday, you’re likely to see the dollar strengthen again, based around profit taking or vice versa. The dollar is really strong, Monday, Tuesday, Wednesday, Thursday, then it sells off. These are the things we want to watch for. That’s the rhythm of the market guys.
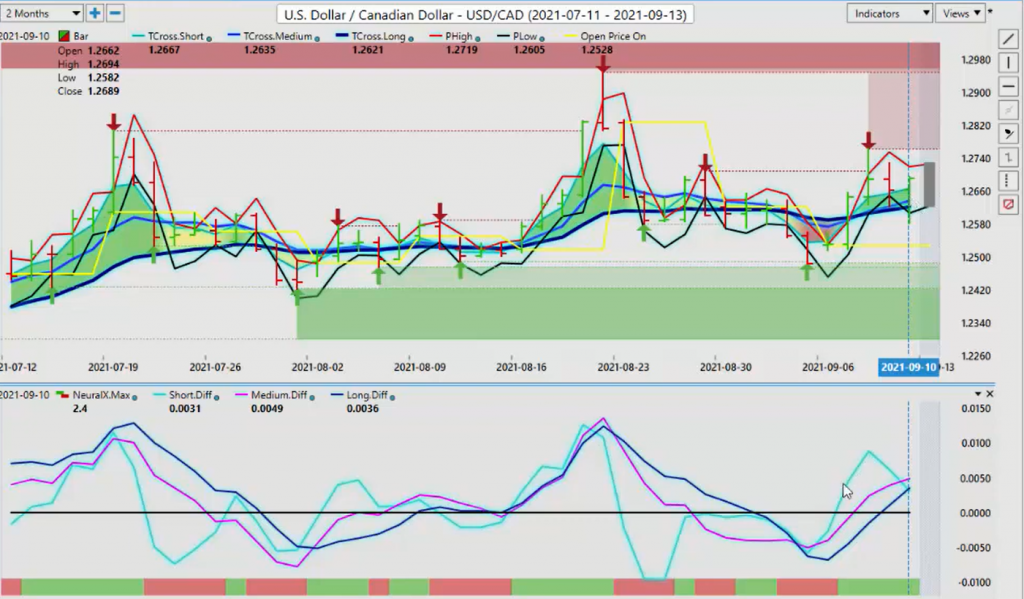
That’s just a little bit of free advice just to keep an eye on price on Thursday, because it can be very, very misleading. So, with the US/Canadian pair, we’re utilizing that T cross long at 1.2621. That is the line in the sand for us this week. US/Canada has set the bar a little bit high. Once again, if we put our point and time, are we just draw up an approximate closing price, that closing price is coming in at 1.2689. So, to begin the week we use that weekly opening price, which I’m assuming there won’t be much of a gap in US/Canada. It’s going to be approximately 1.2689. If the market can’t get back up above that level and stay above that level, then the US/Canada is likely to take out the T cross long and push down below 1.2621.
So, we will be monitoring this pink line crossing over this blue line, the medium-term predicted difference to see if the market can actually make a reversal here. If the Canadian dollar can overpower the US dollar. But that’s going to be difficult in an election month, you’re going to need strong equities. You’re going to need strong oil prices for the Canadian dollar to accomplish this. I believe that it’s likely going to struggle. It’s a very, very tall order, but just watch your levels. You can also click on the F8 and use that key predicted moving average by itself as a pivot, that’s coming in at 1.2649. So, we know where these levels are.
New Zealand Dollar versus U.S. Dollar
Now, Aussie and New Zealand for next week. Once again as we discussed in last week’s presentation, that sell signal that had formed prior to the market even opening. And even this presentation, I always do the presentation while the markets are closed.
This is an outlook guys, not a recap of something that already happened. So, we’re building a strategy to start the trading week. So again, apply your weekly opening price and then look at these key levels. The MA Diff told us that last week was not the week to be buying the Kiwi against the dollar. It’s a week where we’re selling US dollars or selling this pair. Now it’s starting, you can see it’s getting all tangled up in these predicted moving average and it’s starting to rebound. The slope of the predicted differences are starting to flatten out. The medium-term will always go first. Keep an eye on that pink line as it starts to turn back up. If the Neural Index turns green, that tells me we’re likely going to hold. So, the T cross long, 7046. If we click on our F8, you can see that we tried to push down below the predicted moving average and we’re struggling.
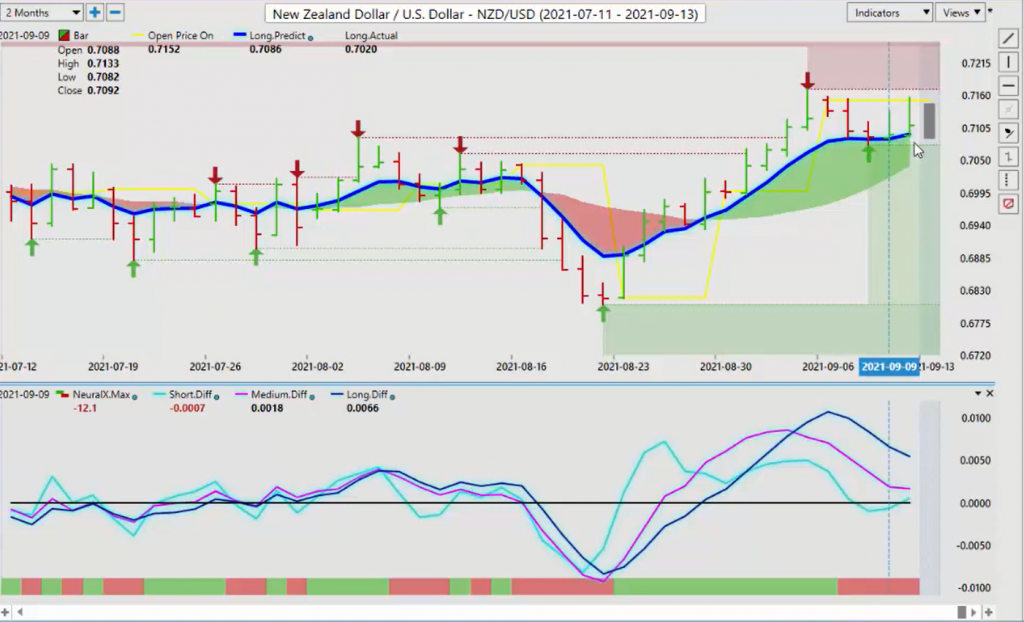
So, this is telling me that we’re likely corrective. So again, there’s enough meat on the bone for everybody. There’s no reason why we should be arguing with each other is I’m a buyer. I’m a seller. I’m this, I’m that. Guys again, there’s enough meat on the bone for everybody here. If you want to buy, you buy out this blue line and you wouldn’t be wrong to do so because we’re still above the T cross long, right? But this is warning us again, that this it’s pretty shaky up here. We can’t get above the weekly opening price and even on Friday, we came right up, back up to the weekly opening price, and it was just pounded lower. The same thing happened with the Aussie, but clearly the Aussie is the weaker out of these two. But once again, these were very, very easy trades to begin the week without MA Diff cross combining it with that weekly opening price.
Australian Dollar versus U.S. Dollar
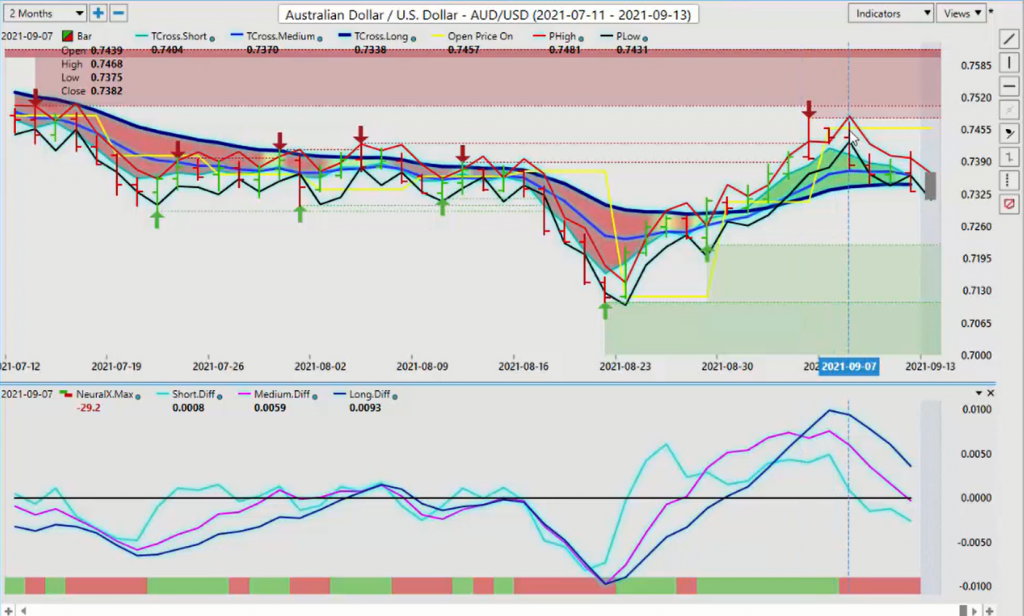
And again, with the Aussie, we’re actually closing below the T cross long at 7343. So, this one’s a little concerning to say the least, and we didn’t even test the weekly opening price. Only one day, did we test it and that was at the beginning of the week, and then it just absolutely got pounded lower, but you can see the market support building off of that T cross long at 7343. So, watch that level very closely. But again, you can draw, do the same thing I’m doing with that yellow line and do it right now before the market opens and say, “Okay, I’m going to put my weekly open on the close of that bar from Friday. That price is going to come in that close 7329.” So, if we’re holding above 7329 by Tuesday guys, then you’ve got a, probably a pretty easy long trade here. And that is entirely possible because again, after you have that period of dollar buying at the beginning of the month, the dollar usually softens. So, with that said, this is the VantagePoint AI Market Outlook for the week of September the 13th-


