


VantagePoint AI Market Outlook for the Week of September 14, 2020
VIDEO TRANSCRIPT
U.S. Dollar Index
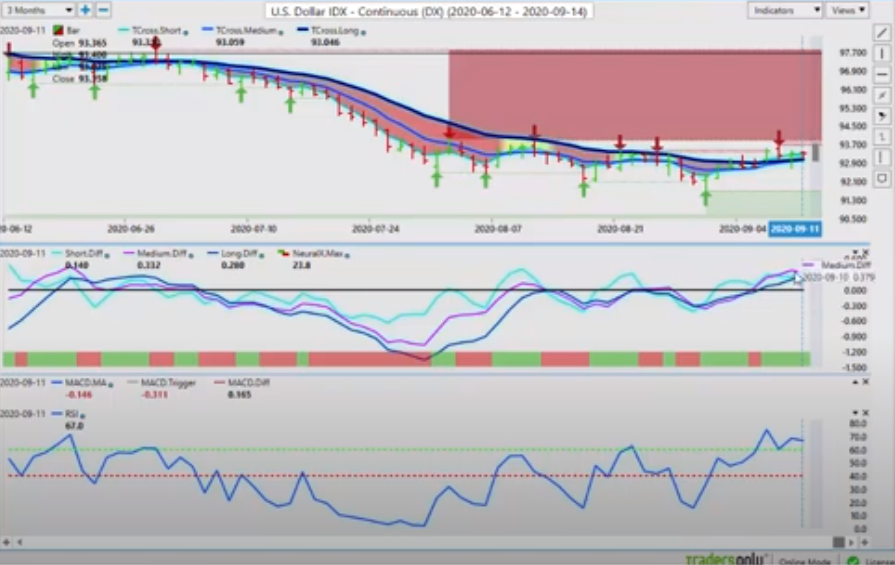
Hello, everyone. Welcome back. My name is Greg Fermin, and this is the VantagePoint AI Market Outlook for the week of September the 14th, 2020. Now, to get started this week, we’re going to begin again where we always do, with that very important U.S. dollar index. Now, what we can see here is we have our short-term crossing over our medium-term and longterm predicted difference. We’ve got our key pivot level now, which is 9304, however, as we can see, the medium-term trend is starting to weaken against the longer-term trend using those proprietary predicted differences, looking for a crossover back to the downside. We’ve had multiple failures in this 93.50 area, and we were unable to break through this very, very significant resistance. So when we look at this going forward next week, our T-cross long 93.04, when we click on our F8 on our software, our key pivot area coming in at 93.16.
U.S. Dollar Index
So we know what that we have significant resistance between 93.50 and the 94 level. But support is building down in this 93 areas suggesting the dollar could extend it’s gains. However, once again, we have the fed coming up this week, so the fed could derail any kind of dollar rally here. So we’ll have to wait and see what we get from the fed, but for now the dollar is carrying a moderately bullish tone.
Gold
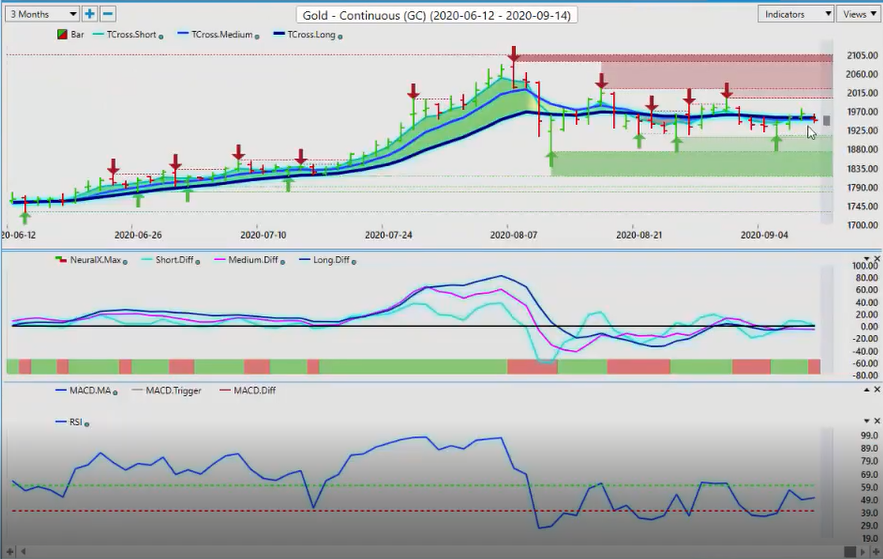
Now this is keeping gold in a sideways formation. We can see we’re just moving back and forth here within a very well-defined range. The most recent low here coming in at 18.74 and our swing high at 2,089 has not been retested since that high I might add and we’ve been consolidating since. So if the dollar does start to sell off again based around potential comments from the fed, then that would trigger a significant rally in gold but right now we’re just not there yet.
GOLD
We can see that our predicted RSI is holding the 50 level, moderately bullish, our medium-term crossing our longterm predicted difference with the neural index, that is cause for concern. Now our key resistance is now coming in at 1954. Again, when we click on our F8 on our VantagePoint software, and we use that predicted moving average by itself with the correlation to 31 other markets we get a very solid pivot area here. Now, the market’s been challenging this area most of the week, unfortunately, to finish the week, we ended up closing below it again. So not exactly the most bullish set up at the current time, but I’m sure that gold will make a move this week, either slightly before or slightly after the fed’s announcement.
S&P 500 Index
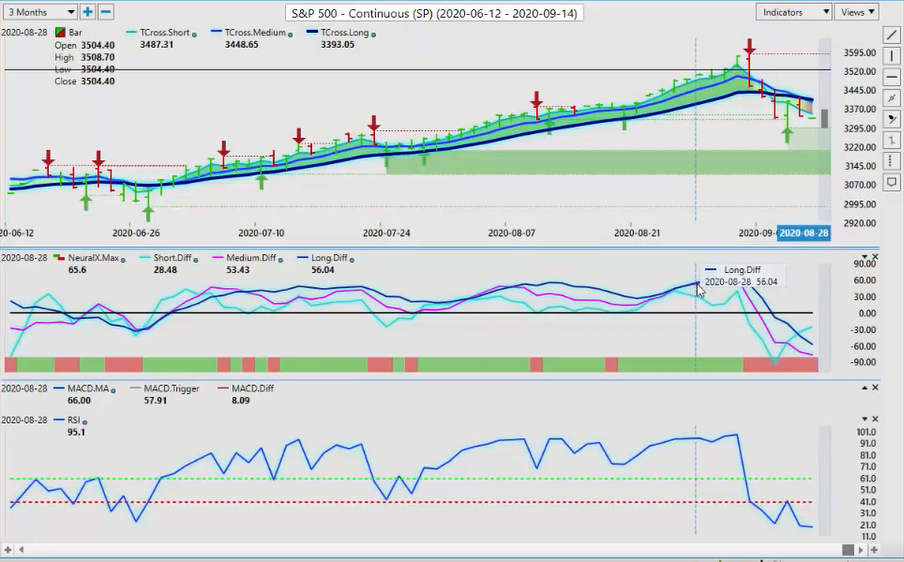
Now, the equity market’s taking another big move to the downside here. We can assess that the leading indicator for this move to go lower was once again, the medium-term crossing the longterm predicted difference.
S&P 500 Index
This pink line tells us the strength of the medium-term crossover. The blue line, darker colored blue line tells us the longterm crossover. So when we look at this, it’s another form of again, using multiple timeframe analysis to see this. Now, as the market was moving up, this classic indicator crossed to the downside and then started pointing down, which led to the sell off. But once again here guys, we have very, very strong support in actually a couple of levels I will point out here. Number one, the major swing low area of 32.05 but we’ve got a fair bit of support sitting down here at 33.27, so we want to watch that 33.27 area very closely. When we look at our predicted RSI, we’re at 18.7, still have room to extend to the downside, but this medium-term, this pink line, when it starts to turn back up and cross this blue line, we are likely to see the equity markets recover.
Crude Oil
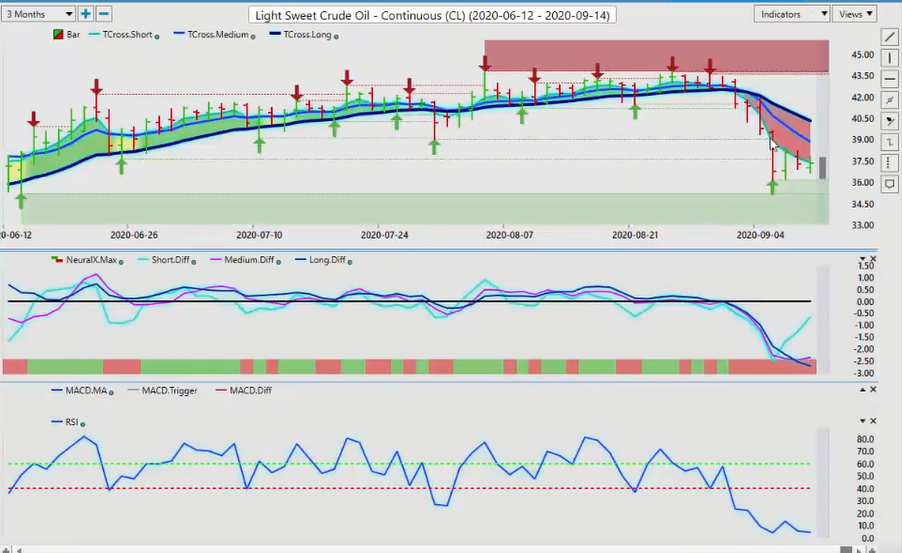
Now, as we look at, again, Light Sweet Crude Oil for this coming week with the commodity side of our trading here, pretty much following the equity markets. Now we’ve had a big push down. A lot of times here, guys, what happens is when we get this crossover, we have several days of good trading and then we get a big push like this bar right here, but you can see that we had absolutely no sellers in oil at the $36 a barrel mark, so we’re starting to rise up off of this level. So we’re likely going to see a mean revision here where we start retracing back towards the 40.31 area. Once again, if we click on our F8 we can see the blue line by itself. If we can overtake 38.29, then that would tell me that the oil markets are going to recover and so are the equity markets.
Crude Oil
We’ve got our medium-term crossing our longterm predicted difference but we’re not quite there yet, we need that neural index on board but again, we can see that we’re sitting at 4.8 on the predicted RSI, grossly, grossly oversold. That does not mean, however, it cannot go lower. To start the week we want to watch this support level. If this low point at 36.13 continues to hold, then we should see oil turnaround by probably Tuesday or Wednesday of the coming week.
Bitcoin
Now, when we look at the additional markets that we would look for in the weekly outlook, I think that Bitcoin is worthy of a look here from us guys. When we look at Bitcoin also we can see heavy support forming down here yet again, and this is coming in at about 98.58. Bitcoin appears to be getting ready to make its next move up here, or at least a retracement. We simply have to overtake this 10,579 mark.
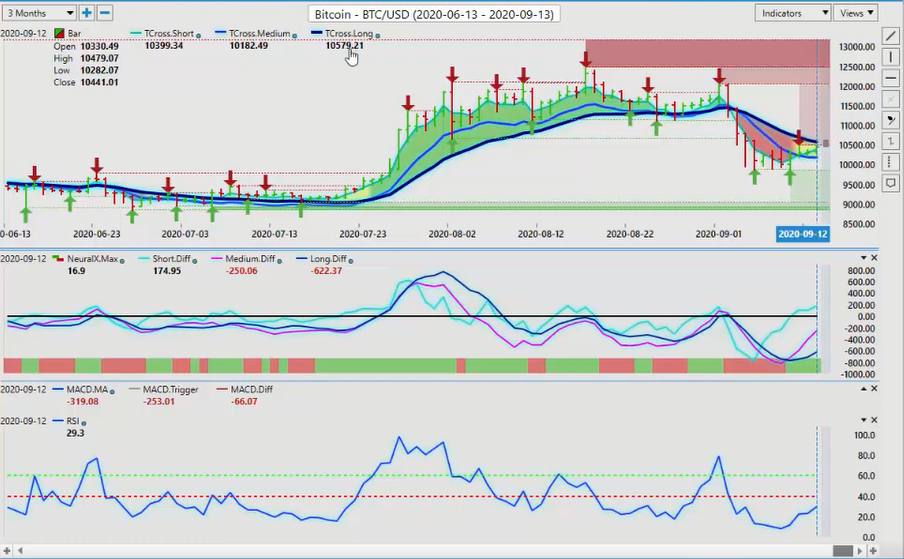
Bitcoin
But once again, if we click on our F8 we can see that there is our actual signal to start buying this thing. We’re banging up against the vantage point blue line, the predicted moving average by itself without the black line, we cross above the blue line and then you can see how the market uses this as a pivot area to continue to move higher. So if we can take out this very small verified resistance at this high at 10,487 then we should see Bitcoin extend its gains and I’m sure that the fed is going to help that along.
Euro versus U.S. Dollar
Now, when we look at some of our main Forex payers here starting with the main Forex pair, which is Euro U.S. most heavily traded pair in the Forex market. Once again here guys, we want to look for the key levels and whether we’re buyers or sellers, we have a clear buy signal forming here, the pink line crossing over the blue line, that’s the medium-term crossing the longterm predicted difference.
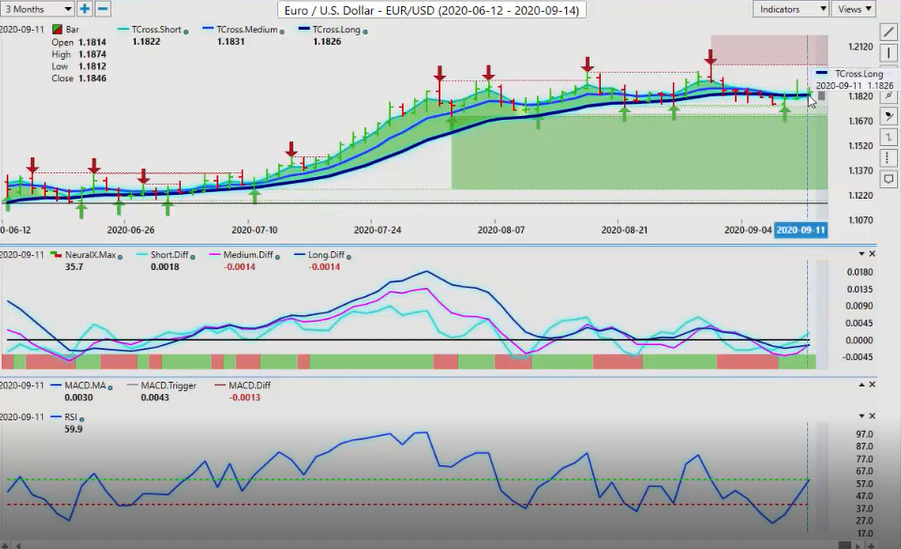
Euro
The neural index is in support and we’ve got our RSI at 59.9 suggesting that the Euro is getting ready to move up again, that indirectly supports gold I might add, tier two, so we’ll continue to monitor that. But 18.26 is the main level when we click on our blue line, once again, this is the signal we look for. We close above the blue line at one 118.18. Then the very next day we use that same blue line as a pivot level to extend higher, that level one 118.27. If we can hold that level into the fed announcement, we should see the Euro extend it’s gains. Now the Pound dollar should start to find some support, mainly on dollar weakness, a lot of things going on in the U.K. right now but right now what we should be looking at is the 130.20 area, that’s probably where this is going to stall out. The RSI at 9.7, heavily oversold, we’re just looking for this pink line across the blue line.
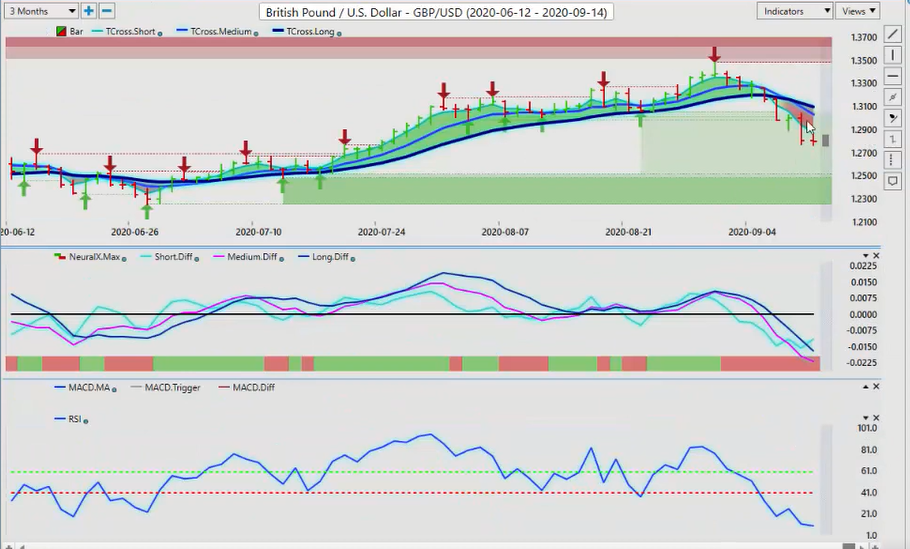
But usually the key thing to understand here is using the predicted moving averages with a mean revision theory is that the further we move away from the blue line, the more likely it is we’re going to trace back to it. So that key level 130.95, again, if we click on our F8 in our VantagePoint software, that main pivot area now is 129.87.
British Pound versus U.S. Dollar
In my respectful opinion, regardless of which direction the Pound goes this coming week, it will come back and touch that blue line and then we can reassess if we want to continue to buy, or if we want to use that area for a sell point. Again, you can see when the market breaks down below the blue line and closes below the blue line and the key thing to understand that we then have multiple days where the market comes back to the blue line, kisses it and then extends lower. So this has been going on for about 7 or 8 days now, which tells me that we’re either going to have a bigger move down or we’re going to retrace and reverse.
British Pound
U.S. Dollar versus Japanese Yen
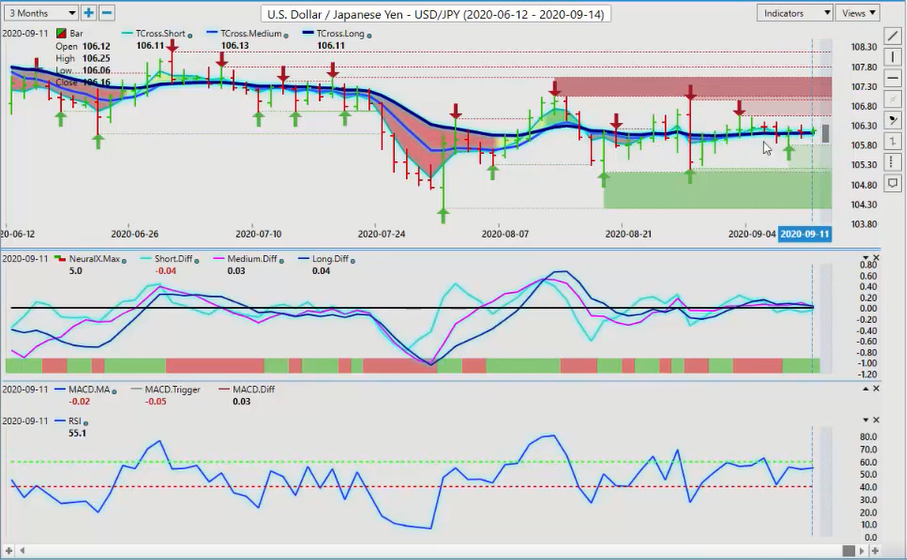
The latter is more likely than not in this particular case. Now, with the dollar Yen again, next week with the dollar Yen, this pair is simply moving in this sideways channel while we wait for the next move on gold. A lot of traders do not care for this particular payer, they find it very difficult to call. But what I can tell you is that we would be looking for gold to move higher or lower and that will determine whether we buy or sell dollar Yen. If gold moves higher, we want to sell dollar Yen immediately. If gold moves lower, we want to buy dollar Yen immediately. So again, it’s a buy sell here based around what happens with the commodity markets, mainly gold, but where we’re sitting at right now we’re dead flat, so we want to look for a break of the most recent high, which is coming in at 106.55 or a breakdown below a 105.79. Either one of those will likely trigger a bigger move, but in my respectful opinion, gold is the market to watch if you’re trading this pair.
Japanese Yen
U.S. Dollar versus Canadian Dollar
Now with U.S. Canada. Again, U.S. Canada is trying desperately to turn bullish here, but this will be determined by oil prices and equity prices. If oil, Light Sweet Crude Oil and the S&P 500 recover, then U.S. Canada will start moving lower again. The toughest thing I think with traders to understand we use conventional indicators, predictive indicators, but most people don’t take into consideration the actual inner market correlation. So what I’m giving you here is two markets to watch, Light Sweet Crude Oil and again, the S&P 500. If those two turn higher, than U.S. Canada will pause here and start moving lower probably by Tuesday. If the equity markets do not recover, and oil does not recover, then U.S. Canada will absolutely challenge this high point around 132.59 and will likely break through it. So again, don’t just know your levels here guys, also know your inner mind correlations, because I often get this.
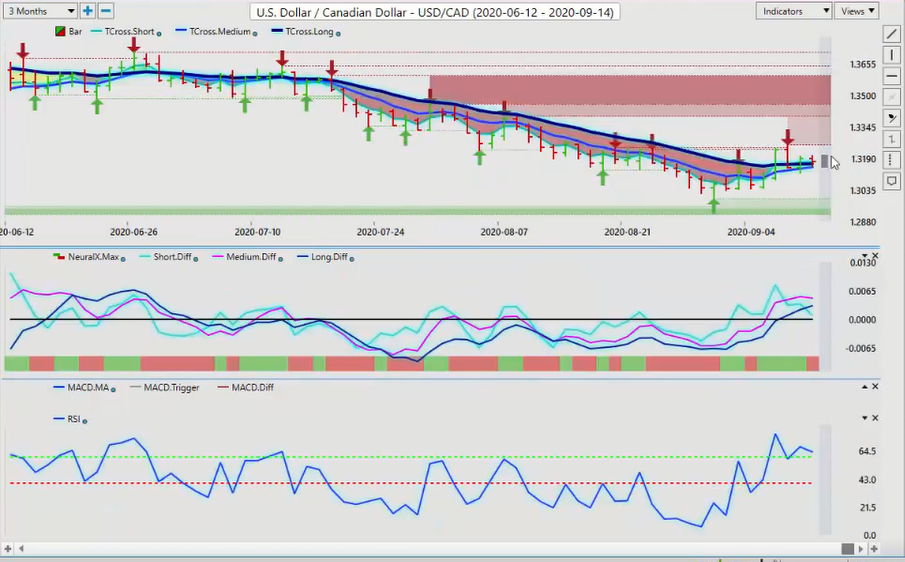
Canadian Dollar
Many, many times people will say, “Well, I trade the U.S. Canada, I don’t trade stocks or commodities,” well you’re trading stocks and commodities whether you like it or not. And you people that are trading stocks and oil you are trading U.S. Canada you just don’t realize it, so again, watch those key levels. To begin the week right now, our F8 here, 131.60, all the action is around this area guys. If we hold above this, we go higher. If we don’t, we start extending lower.
Australian Dollar versus U.S. Dollar
The same will apply for Aussie U.S and New Zealand U.S. Aussie and New Zealand used to be commodity currencies, now I refer to them as equity-based currencies, they follow the S&P 500. So the Aussie, just like the S&P 500 at the exact same time has turned lower, but you can see that we’re getting all tangled up around this vantage point key pivot level, 72.54, the T cross long.
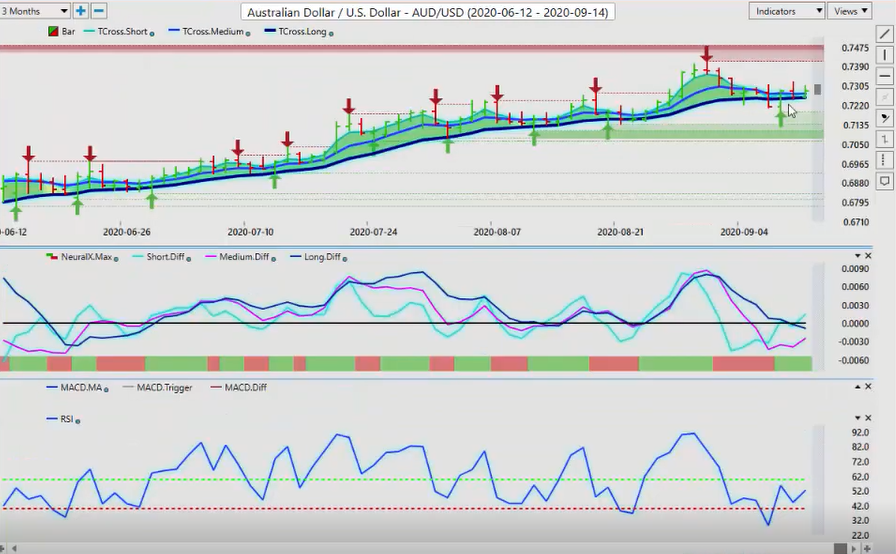
Australian Dollar
When we click on our F8 here, we can see an additional level of support, which is 72.70. We want to hold above this level guys. Right now, our predicted difference is starting to turn higher suggesting that the Aussie currency is getting ready to reverse and start moving higher again. If that’s the case that will confirm our trade in oil, and it will further confirm a reversal back to the upside on the S&P 500. And of course the same thing applies to New Zealand.
New Zealand Dollar versus U.S. Dollar
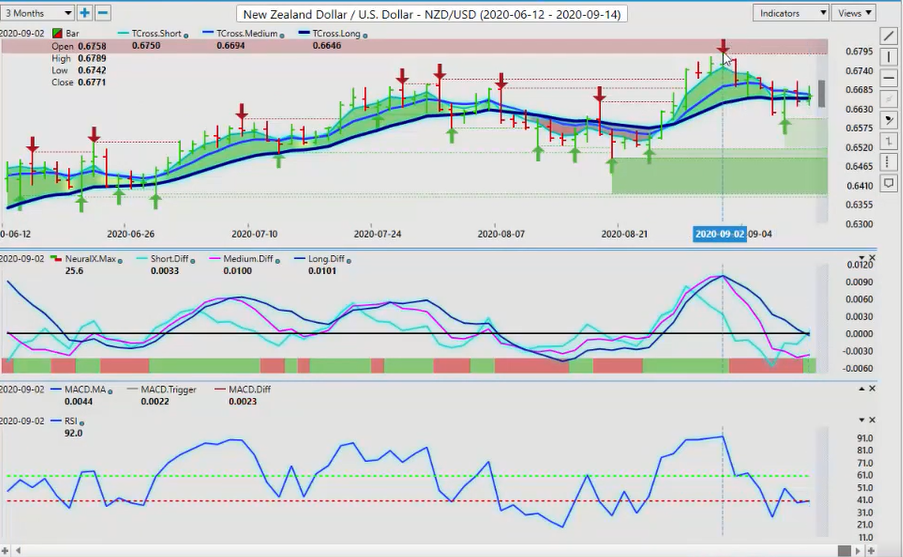
New Zealand Dollar
We’ve had a pretty big sell off on the New Zealand U.S. pair with the S&P 500, but it’s stalling here. And currencies, guys, can be a fantastic leading indicator for your stocks. And basically right now, most of your individual stocks are following the S&P 500. So if these currencies are leading indicators, they would warn us that we could potentially be getting ready to reverse on a number of markets, maybe even gold. So with that said, this is the VantagePoint AI Market Outlook for the week of September the 14th, 2020.
Are you using A.I. yet?


