


Vantagepoint Forex Weekly Outlook for the Week of June 17th, 2019
The Vantagepoint Forex Weekly Outlook is designed to help traders. It’s important to remain aware of correlations in the global markets. Traders can become more profitable if they know how to get ahead of the trends. Utilizing the predictive indicators in VantagePoint Software can help traders find the right trades and the right times. Above all, traders know when to enter and exit those trades for maximum profit. Let’s look at the charts for the U.S. Dollar, Gold, Crude Oil The Stock Market and the Major Pairs.
Hello, everyone and welcome back. My name is Greg Firman and this is the Forex Weekly Outlook for the week of June the 17, 2019.
Now, to get started this week, we’re going to begin where we always do, with that very important US dollar index. We are going into Fed week; we’ve got the FOMC on Wednesday, and it is going to be a big one. The reason I say this, guys, is there’s a heated debate over whether the Fed should hike, or whether they should cut. In my respectful opinion only, they should do absolutely nothing. But we know that the Fed is unlikely to do that. The Fed is going to send the markets into a tailspin like they normally do. We don’t want to try and predict what the Fed is going to do, because they’re extremely unpredictable.
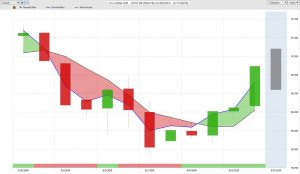
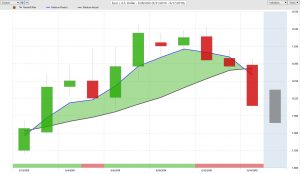
Now, right now, surprisingly, money is going back into the U.S. dollar, not out of the dollar. That is very, very strange. But the main thing we want to understand here, is that we are still well within the overall range of the dollar index. Now, the lower part of this particular range, is 9584 on the downside, and on the upside, we’re looking at about 9774. Any substantial break of this particular area, I believe we will get that after the FOMC, once we know what their game plan is. So, I would trade very, very lightly up until Wednesday, until we see what this Fed is going to do.
But right now, despite this strange move of the dollar getting stronger, VantagePoint once again was clearly ahead of this move. The medium term crossing the long-term predicted difference, combining that with the neural index, in a rising RSI, clearly told us that the dollar was strengthening. Now, we have closed above our T-cross long 9669, that is the area we want to watch to see if we can hold above that going into the Fed announcement.
The Gold Market
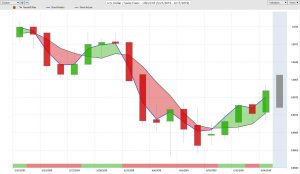
Now, the Fed also is wreaking havoc with gold. Gold looked like we had an easy bull market forming with the predicted rate cut and everything else, and just like that, we got a false break above our key verified resistance zone; that coming in at, at or about the 1352/1356 level. We poked above here and then we were slammed lower on that very strong US retail sales number on Friday.
Now again, as I had stated last week, I believe that a number of the analysts and the pundits got the US unemployment numbers wrong. The U6 was very strong at 7.1, so when we look at 7.1 and we combine that with the retail sales and some of the other data, I think it’s going to be very difficult for the Fed to make an argument to cut rates on Wednesday.
So therefore, we could actually see extended dollar strength, or at the same time, extended weakness in gold. So we could have a premium short on gold. Now, I think we will have a good long once we break above 1360, stay above 1360, then we can make a run higher. But right now, any move lower in gold to be clear, is corrective, while above 1323.
S&P 500
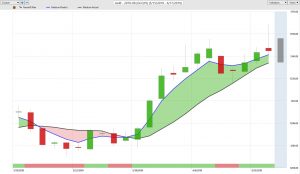
Now, with the global stock markets, they’ve also paused too. We can see, again, the benefit of using the verified zones, combining that with the VantagePoint software, very powerful indicators in the VantagePoint software. We can see that at this verified zone high at 2915, shortly thereafter we had the medium term crossing the long term predicted difference. Now, this is providing somewhat of a safety net for short sellers so we’re going to continue to monitor, but right now, we are still holding above that critical T-cross long at 2862. While we are above that area, guys, longs still are slightly favored. A number of analysts, also last week, have thrown the towel in with conventional indicators and they’re basically stating that the path of least resistance is to the upside.
That, in my respectful opinion, is not analysis. That is not taking into consideration all of these other factors. So, when we do this, right now we’ve had rather a steep increase on the S&P, but that’s largely because everybody is convinced that the Fed is going to cut on Wednesday, or they’re going to cut two or three times in 2019. I am not in that camp at all at the current time, based on the data that I’m seeing, I will concede that there isn’t a lot of inflation, but there is still some. It’s below the target, but that doesn’t necessarily mean we have to run in and start cutting rates all over the place. So, we’ll see how this one plays out. But right now, I feel we’re going to trade between 2862 and the top of the verified zone at 2915 until after the Fed.
If there’s any significant spike in equities, gold, or the dollar index, that would tell me that basically somebody’s leaking the announcement or somebody knows exactly what the Fed is going to say on Wednesday. And I suspect that that could be in play right now, and that would be a very good example as to why the dollar is actually rallying because somebody knows the Fed is not actually going to cut, and they’re not even going to hint at a rate cut on Wednesday. But again we’ll, we’ll see.
Crude Oil
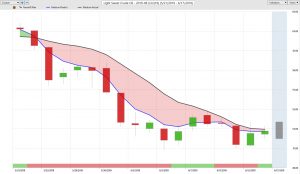
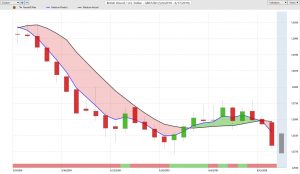
Now, with light sweet crude oil, clearly following oil, not as strong, and oil is staying lower, we’re hugging this vantage point, the T-cross medium level; the medium predicted moving average, we’ve been banging into it all week, guys, and we have not been able to break above it. So for now, oil still remains … it still remains bearish while under 5532, but I’m pretty confident that oil is going to rise in the next two to four weeks with summer driving season.
Forex Weekly Outlook for Major Pairs
Euro/U.S. Dollar (EUR/USD)
Now, as we move into our main Forex pairs, starting with, of course, the most heavily traded pair in the Forex market, which again, is the Euro/US pair. The Euro remains locked in a very long, sideways market here … excuse me, I’m just moving along here so we can find this.
Now, when we’re looking at the Euro/US pair, again, we can see another verified top, which is again what I warned everybody last week that we’ve got to be careful around this 1348; we’ve actually made a slightly lower high here and down we go again. But again, when we look at the medium term crossing, the long term predicted difference, combining that with the neural index, we have a very powerful signal here to the downside.
Now once again, our T-cross long has been breached, but we can also assess, we’ve got a good support level here, coming in about the 112 area. So, if we lose 112, we’re probably going to go to a 111 fairly quickly, but I still do not think that will be until after the Fed. So right now, we’re still moving lower. We want to see if we can hold below 11241 going into next week. If we’re holding below 11241, then the biased is clearly lower. The Euro, still very much negative on the year based around the yearly opening price. So we’ll continue to monitor this, but right now, the euro still has a bearish tone to it despite all of this talk of rate cuts.
U.S. Dollar/Swiss Franc (USD/CHF)
Now, with the US/Swiss Franc, we are moving higher but we’ve stopped dead in its tracked at … this pair has been stopped dead in its tracks, excuse me, at the 9995 level; our T-cross long, our key vantage point, long term pivot area. Theory is, we’re below it, we’re short; we’re above it, we’re long.
Now, we play these counter-trend positions when we have confirmation from VantagePoint, and we did with the verified zones, and we can even assess here that our short term crossover taking place off of this verified support has caused it to rise. But going into next week, guys, we must clear the parity level on this pair. If we can’t, then that would signal that the equity markets are going lower, the dollar’s getting stronger, and ultimately this pair moving lower. So, very much dependent on the Fed.
British Pound/U.S. Dollar (GBP/USD)
Now, with the pound/dollar for next week, guys, we had a very, very good discussion about this, this past week in the VantagePoint live training room, using the yearly opening price and the verified zones in this 12750 area. That led to a very, very good short trade here. Once again, the market unable to breach this critical vantage point T-cross long; the T-cross long, a very, very powerful short, medium, and long term pivot area.
The theory is, we’ve got to break through this. If we can break through 12701 and stay above it this week, probably if that’s going to happen, it’s going to be after the Fed, then longs will be very good. But right now, shorts are still heavily biased.
Now, we must watch this area at 12559. You can see we’ve got a verified zone here, so don’t be too quick to pull the trigger on shorts here guys. Watch this support level very closely and be very mindful of the neural index and the predicted differences or a rising RSI. If the RSI turns and starts to rise, that’s likely it on the downside, and meaning the dollar is going to … you know, is going to be … it will be weaker across the board. If that’s the case, even with Brexit and everything else, Great Britain, US, will still be a decent long. So, 12559, and again, be very mindful of that neural index.
U.S. Dollar/Japanese Yen (USD/JPY)
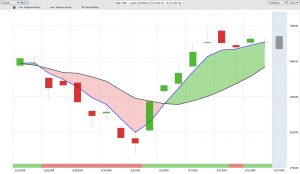
Now, with the dollar/yen, despite the equity rally this week, the dollar/yen is simply not interested. It’s not willing to take the carrot here and the carrot being higher stocks. This here, tells me that the stock markets are going to continue to struggle unless the dollar/yen can get above 10886, and stay above 10886.
Now, the predicted differences are telling us here, our medium term crossing our long, telling us we’ve got a shot at this, our [inaudible 00:10:25] is turning higher, and we’ve got a rising RSI, but we’ve got to get above 50, and more importantly, get above 60 on the RSI to take the pressure off the downside. But the catalyst here, guys, will absolutely be the Fed and the global stock markets. If the global stock markets continue to move lower, dollar/yen will do so also.
So, our first level of resistance, 10850, 10850 on the medium, and 10886 on the long, T-cross long. That’s the one we want to watch. We also, again, have a verified zone sitting just below that, right here at 10880. So, everything is about the 10880 area. Guys, if we can break through that, fantastic. If we can’t, shorts will clearly be in favor.
The Commodities Currencies
U.S. Dollar/Canadian Dollar (USD/CAD)
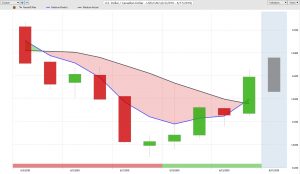
Now, with US/Canada responding again to lower oil prices, gold failing to break out of the overall range. When gold failed to break above 1360, as I had discussed in last week’s Forex Weekly Outlook, the Aussie, the New Zealand, and the CAD reversed all of their gains. What I can tell you over the 17+ years that I’ve been using the VantagePoint software, that a direct inner market correlation will trump the best of the best indicators out there. That includes Fibonacci, Elliott wave, any other types of systems out there. If real money pours out of one market, they’ll pour out of another one also.
So very quickly, the CAD, the Aussie, and the New Zealand, as soon as gold failed, these currencies started to reverse. So right now, US/CAD appears to be set to move back towards our range top, that coming in at currently about 13565. But we must hold above this T-cross long at 13390. 13390 would be the area to look at longs, this was confirmed yet again, guys, by the medium term crossing the long term predicted difference in combination with that very powerful neural index. So, if we’ve got all these indicators lined up, we can even cheat a little bit and come down to our short term crossover from vantage point, combine these three indicators in this particular setup, guys, and you’ve got a winner.
Australian Dollar/U.S. Dollar (AUD/USD)
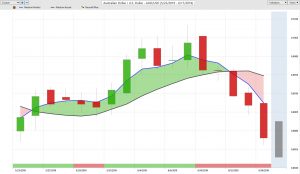
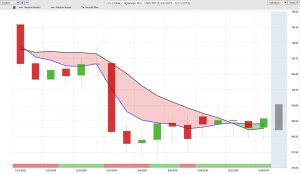
Now with Aussie/US and New Zealand/US, a little bit of concern that I have here, the newest indicator that’s been added to the VantagePoint software, that I’ve worked directly with them in collaboration, are these verified zones. We do not want to take these zones lightly. Right now, major support between 6865 and 6820. If gold continues to advance higher, the Aussie is likely to reverse with it. So, we’re going to watch gold very closely. Right now, appears to be further downside, but the RSI at 16.4, we’re in a heavily oversold condition in a verified support level. Watch this level closely. If price stalls here and starts to slowly rise, longs definitely will work. Okay, guys? So just watch the levels that I’ve discussed.
New Zealand Dollar/U.S. Dollar (NZD/USD)
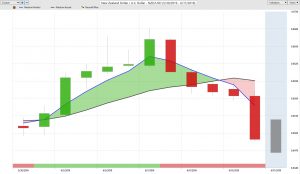
The same thing applies to New Zealand and bear in mind, it’s almost the exact same trade as the Aussie, but the New Zealand’s been under a little bit more pressure than the Aussie this past month, so far this month. So, we’re going to watch this support zone here, that’s coming in at 6481. If we can hold here and we don’t advance lower, this pair also will follow Aussie/US higher and US/CAD potentially lower, but that is going to be determined again probably after the Fed, not before.
The key thing, guys, watch, know your levels. If you know your levels, then you’ll always be taking a trade on your terms, not the broker’s terms, not on some of the other pundit’s terms, or on some other trading system. If you know your levels, then again, you will always get the trade on your terms.
So with that said, this is the Forex Weekly Outlook for the week of June the 17th, 2019.


