


Vantagepoint Forex Weekly Outlook for the Week of May 13th, 2019
The Vantagepoint Forex Weekly Outlook is designed to help traders. It’s important to remain aware of correlations in the global markets. Traders can become more profitable if they know how to get ahead of the trends. Utilizing the predictive indicators in VantagePoint Software can help traders find the right trades and the right times. Above all, traders know when to enter and exit those trades for maximum profit. Let’s look at the charts for the U.S. Dollar, Gold, Crude Oil The Stock Market and the Major Pairs.
Hello everyone and welcome back. My name is Greg Firman and this is the Forex Weekly Outlook for the week of May the 13th, 2019. Now to get started this week, we’re going to begin where we always do with that very, very important US Dollar Index. We’re also going to review our major commodity futures, but more specifically the S&P500 oil and gold, and of course our major Forex pairs.
The US Dollar Index
Now, we haven’t got any kind of trade deal here so of course this is likely going to put pressure on the US dollar, potentially even equities.
We’ll look at that in a minute. But for now, the Dollar Index is under pressure as forecasted by VantagePoint. But we have a very mixed signal here sitting on this verified support zone. That’s coming in at or about the 96.87 area. Now, a breakdown below that area could trigger a bigger move lower in the dollar. The dollar is usually weaker around the middle of the month. So right now it’s perfectly normal for the dollar to sell off at around the middle of the month. No reason to panic just yet.
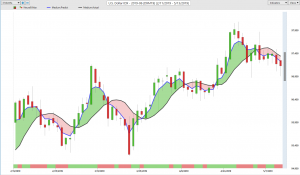
We’re still, again, well within these ranges, but if we’re starting to break down below the 96.81 area. That would be a significant problem potentially. That could lead to a full reversal on the dollar. But again, we’re not seeing that just yet. The dollar should, under normal circumstances, begin to strengthen again towards the end of the month. So we’ll continue to monitor this. But for now, only one of the VantagePoint indicators is suggesting we could reverse higher.
That is the medium-term crossing the long-term predicted difference. But that is not supported by the neural index or the breakdown below our key VantagePoint pivot area at 97.22 with a close of 97.12.
S&P 500
Now this is basically breathing a little bit of life back into the equity markets, but the equity’s under significant pressure after yet another significant sell off in this verified resistance zone up around this 2950 area.
Now, once again, the equity markets don’t look like they’re completely down and out yet. But we can only fail so many times above 2900, guys, before we see a much, much deeper corrective move lower, if not a complete and utter trend reversal. Now, we want to remember that fundamentals didn’t really take stocks higher, the Fed did. So, the Fed is still… Now, with the trade war with China, if this continues, that could fuel a rate cut.
If it does, that may actually help stocks. So, little bit of fundamental analysis right now. Two, we can also use the VIX to help gauge the volatility. Again, when we’re looking at the
VIX, we’re not using it any differently than we use our other VantagePoint indicators. We’ve got our medium term crossing our long term predicted difference to the downside with the neural index. That suggests that the VIX may turn around and move lower.
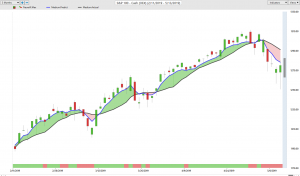
When we look at this, we have failed exactly on the T-cross long at 15.94. So, once again, if we break down below that area, that could trigger the VIX. The pressure could come off the equity markets. When we look at our long predicted, we are closing below 16.83. If we combine this signal, breaking down below the predicted moving average, we’re crossing using our medium term predicted difference, crossing down. This suggests that equities will potentially recover next week.
But again, guys, we’ve got to remember here that we’ve never been in a trade war, at least not recently, with China. So, we’re in a very speculative time. We need to see how the market is now going to react. And more importantly, we need to see who’s going to blink first, either Trump or China. I feel Trump is the one that’s already blinked by saying, “Maybe the tariffs will stay, maybe they won’t. We’re still negotiating.”
Secretary Mnuchin, that’s not what he said. What he said very clearly was, “There is no planned negotiations in the next X amount of days.” So, I’m going to take that as the tariffs are going to stay in place for now, and now, we have to see how the market reacts to this.
Crude Oil
Now, looking at Light sweet crude Oil, oil has been following equities lower. So, it stands to reason that if stocks reverse, oil will reverse with it.
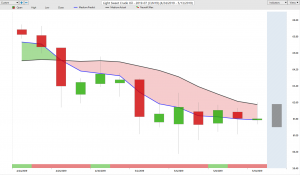
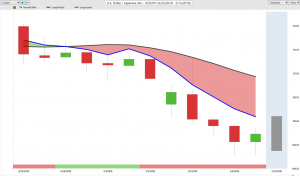
We’ve got our medium term crossing our long term predicted difference, but our neural index is still down. On our side it’s recovering, but not yet above the 50 area. So, still in bearish territory for now. Now, when we look at gold for next week, gold is obviously benefiting from the conflict between China and the US but again, that’s a global… That trade war is not necessarily just between the US and China. That’s going to affect the euro zone, Mexico, Canada, pretty much everybody.
The Gold Market
So, we’ve got to think of it that way, right? Think globally here, guys. Not just where you’re particularly domiciled in. You want to look at, again, globally. So, right now, we have significant resistance on these verified zones coming in at or about the 1292 area. If we can break above 1292 on gold, I sense that we should be able to break above that. We’re likely then going to target these additional zones starting at 1314. Then we would move to 1319. And then, ultimately, if things really turn ugly in the markets next week, gold could very easily, next week, revisit the 1356 area.So, again, it’s about understanding what’s going to happen. The last thing we want to do is talk about past trades here. We want to look forward, always be forward-thinking in our analysis.
Forex Weekly Outlook for Major Pairs
Euro/U.S. Dollar (EUR/USD)
Now, when we look at Euro/US, Euro/US coming off an identifiable, verified zone, 111.15. We’ve got a fresh triple EMA cross. To begin the week here guys RSI is saying we’ve got momentum building to the upside. Gold continues to move higher. That is absolutely going to benefit the euro here. We however, really need to break through this resistance. We need to be very cautious next week around 112.64. If we can break through that, we should have an easy run here guys, back to 113.23. But again, we’ve got to get past this first verified zone where we’ve come up and kissed it two days in a row and then it’s backed away each time. But the indicators from VantagePoint are suggesting we are likely to move higher. But again, that is also largely based on the inverse correlation to the dollar index.
As long as the dollar index is moving lower here guys, keep your trading simple. We don’t need to throw 50 indicators at this thing. All we have to do is understand the direct inner market correlation, which is the dollar index. If the dollar index is moving lower, Euro/US is absolutely going to be moving higher.
U.S. Dollar/Swiss Franc (USD/CHF)
Now with US/Swiss franc coming into next week, we’ve given up a fairly significant verified support level. That’s coming in at 101.28 we are closing below this, but here’s the thing, we have to be very cautious of a bear trap down here. What I mean by a bear trap specifically is that if the equities do turn around and start moving back up above 29.00 towards 29.50, two pairs will likely follow; US/Swiss franc and US/Japan. Right now, we’re not oversold yet, so we’ve probably got a little bit more downside based around the VantagePoint indicators, but again, watch that direct inter-market correlation.
British Pound/U.S. Dollar (GBP/USD)
Now as we move into the pound/dollar for next week, we’re actually doing this trade this week in the live training room. We’re basically buying off this 129.60, 129.80 area, but the trade is struggling here. Pound dollar, there’s a lot of rumors going around with Brexit, that they may be ousting Theresa May. I don’t know if that’s true or not. If they do, then Brexit is probably out the window and things go back to normal. So if things go back to normal in the UK, Brexit is no longer on the table, then the pound/dollar is grossly undervalued at an exchange rate of a dollar to 30 compared to the US dollar. So the upside theoretically could be wide open. So we’ll be watching this one very closely, but for now guys, we’re sitting below 130.31. What I’ll suggest here is that if we break above 130.31, we are buyers.
We’ve got two good verified support zones going down to 128.66. We’re likely, again, if we go back into our risk-on situation in the global markets, then pound/dollar will rally. And again, if Brexit is off the table, which I can’t say for sure at this time that it is, that will also benefit the pound. So longs definitely, potentially could be in play here. Just watch these two levels. Right now, 129.88, 129.60, that’s the area we want to watch. If that area continues to hold, then we would look to buy again down around that area.
U.S. Dollar/Japanese Yen (USD/JPY)
Now as we look at the dollar/yen, obviously dollar/yen following the crash in the equity market also represents a crash on dollar/yen. So a recovery in the equity markets, meaning specifically the S&P 500 the Dow, et cetera, if they recover then dollar/yen will recover. What we’ll take notice here is we have moved a considerable distance away from the critical VantagePoint levels between 110.49 and 110.97. The probability that we’re going to retrace back to that area is better than 50%. Counter trend longs may work here guys. The low area down here, that’s going to come in at 109/47. If we continue to hold above 109.47, a corrective move, a corrective long trade is more than reasonable, guys. Nothing goes straight up and nothing goes straight down. The markets are only trending; any market is only trending 20% of the time, which means there’s an 80% probability we are going to retrace higher. So always keep that in mind guys.
The Commodities Currencies
U.S. Dollar/Canadian Dollar (USD/CAD)
Now as we move into our three main commodity currencies starting with the US/CAD, very strong unemployment numbers coming out of Canada on Friday that’s pushed the US/Canadian pair down.
But I’ll also say that it came right to an area identified in the VantagePoint software using these verified zones. We came down exactly to that number in the 133.75 area, kissed it and then bounced off of that area. So this is the area we want to see if we can hold the beginning of the week. Right now the indicators from VantagePoint are saying we are further downside. So when we look at our upside pivot areas, we’ve got 134.39, 134.56 and 134.46. As long as we’re holding around this area, then US/Canada should move lower. But to be clear, we need oil moving higher, and we need equities moving higher if US/CAD has any chance of movies moving lower. But right now the indicators from VantagePoint are suggesting we continue to sell a rally anywhere towards 135 just like we’ve been doing for the last several weeks.
Australian Dollar/U.S. Dollar (AUD/USD)
Now with Australia/US and New Zealand/US, both of these pairs in my respectful opinion are nothing special here guys. They are likely to remain under pressure with rate cuts coming out of the RVA and the RV. So right now a corrective move higher is likely towards 70.39, our T-cross long. We have additional verified resistance coming on these two bars here, we’ve got 70.47, and of course the critical level in my respectful opinion at 70.68. Selling up to 70.68 is a reasonable play, provided if we have a complete reversal and the equity start moving higher than that should indirectly help the Aussie. But again, my optimism on that remains heavily guarded until we can see how the market’s going to respond to this US, no US-China trade deal.
New Zealand Dollar/U.S. Dollar (NZD/USD)
Now again, New Zealand’s taken a beating this past week on one single day only. New Zealand Dollar/U.S. Dollar (NZD/USD)This is what I want to point out here, guys, that I do with my own direct clients. When we look at this here and identify it as verified resistance or support zone right here, after the Bank of New Zealand cut, we had a big spike lower. But again, when we talk about these economic announcements, they’re just noise. After the market realized that it really wasn’t that big a deal, New Zealand recovers and comes back up to above where it was prior to the rate cut. Buy the rumor, sell the fact. We could have the same situation with the global equity markets, they could fully recover next week guys, or they could crash lower. But we want to watch them very closely because anything that’s happening in the stock market, in the commodity market will absolutely affect our forex trading.
So with that said, this is The Forex Weekly, Outlook for the week of May the 13th, 2019.


