


Hot Stocks Outlook for the Week of
August 16, 2019
The Hot Stocks Outlook uses VantagePoint’s market forecasts that are up to 87.4% accurate, demonstrating how traders can improve their timing and direction. In this week’s video, VantagePoint Software reviews forecasts for Ameriprise Financial(AMP), Facebook(FB), Amazon(AMZN), Vale S.A.(VALE), Xerox Holdings Corp(XRX).
This Week’s Hot Stocks Outlook
Good afternoon traders, and welcome back to the Hot Stocks Outlook for August 16th, 2019 hope you’re all having a great week in the financial markets and plenty to cover. We’re going to start here within the financials, we’ve got Ameriprise Financial, we’ve got Facebook, Amazon, Vail, and also Xerox, which we covered a couple of weeks ago along with actually Amazon here. What we really need to highlight is that we are getting a lot of lockstep in a very wide swath of different types of markets and really all across the S&P 500, moving into a pretty significant downtrend here.
Ameriprise Financial, Inc.(AMP)
Looking here at Ameriprise Financial, we can see going all the way back towards the mid-point in July, and the same thing with things like Amazon, Xerox, a lot of stock started to turn lower, but what we have here with Ameriprise are daily bars and candles, and so this really works the same way regardless of which market that you’re trading. But against those bars and candles, you see you have a black line and also way blue line against the chart.
Now, the black line is a regular, what we call the actual simple moving average. It’s a very common technical indicator, right? It’s just going to plot the last series of closed prices, adds them together, divides by a particular number, but the problem with that is it’s really a lagging gauge of where average prices have been over time, and of course we want to understand is is that average price going to move higher or lower? What we’re able to do is compare that value to this blue value that you see against the chart.
For that number to be generated, VantagePoint is doing, really, its daily task of doing what’s called intermarket analysis with the help of artificial intelligence, specifically neural networks. What it’s doing is it’s looking at Ameriprise Financial, along with up to 30 to 35 related markets that are known to influence and affect future prices moving forward. A lot of those big macro markets like the S&P 500 dollar index interest rates up, but also important correlations within things like ETFs, also related stocks, other banking stocks, other financial institutions. What it does is it looks at those relationships, some of them being positive, some of them being negative, and weighs them and actually incorporates that into generating the value of this blue line and anticipating moving forward where average prices are expected to move in relation to where they’ve already been.
So, we can see that all across the market, we’re seeing these downtrends, really over the past couple of weeks. I can think back to Wednesday of two weeks ago, the S&P went into a downtrend, and we see here with Ameriprise Financial the same thing, getting this crossover to the downside. Then we look at these other indicators.
Now, the neural index, this is an extremely accurate indicator. It’s upwards of 85% accurate day after day after day moving forward. What’s important understand is that it’s a 48-hour indicator, so it’s very short term. It’s not the overall trend direction, but it’s going to let you know, as far as over the next 48 hours, should you expect some strength or weakness in the marketplace. To really round out the entirety of these forecasts, you’re actually also intraday levels, so actually specific levels that you can go ahead and look to take positions over those subsequent 48 hour periods based on directionally how you want to trade the market. Right?
What we have here is, again, this crossover to the downside in Ameriprise signaling the only direction you’d want to trade this is to the downside. And of course, use the help of things like the neural index as well as the predicted highs and lows. And so, you see what happens here is you’ll get these movements higher in the neural index, which often helps you anticipate short term price movements higher in the market, right? Essentially volatility that moves to the upside. But if you know that the trend is down and there’s going to be short term strength over the next 48 hours, well that’s telling you to go ahead and short on the rallies, and that’s really been the case. Going forward here, we see a couple of days here.
This is where things get really tricky. You see the market trades up on this day, you want to go ahead and get short because it’s getting ready to immediately start trading lower once again. You see how this volatility comes in over these periods, but you only want to be taking opportunities to go ahead and short the market.
We’ve seen just this acceleration of many stocks to the downside here. If we go ahead and look at over the course of this entire move, even taking away the periods where you can add to your position, this market’s down over 18% in just the past 20 trading days along with, you know, we looked at Ben Franklin, some of these other stocks, especially the financial is doing very poorly along with that S&P.
Facebook(FB)
So, you go ahead and look at, you know the FAANG stocks, right? We’ve got Facebook, Amazon here, and it’s really the exact same thing. We’re at strong crossover to the downside here, and you get these periods whereas a trend moves lower and lower, right, it begins at sort of acceleration to the downside, volatility is going to increase, and you want those tools to let you know that there’s going to be that short term strength or weakness in the marketplace, but overall here you want that guidance that says, “Okay, well if I’m looking to short Facebook shares, where do I want to be taking those positions?”
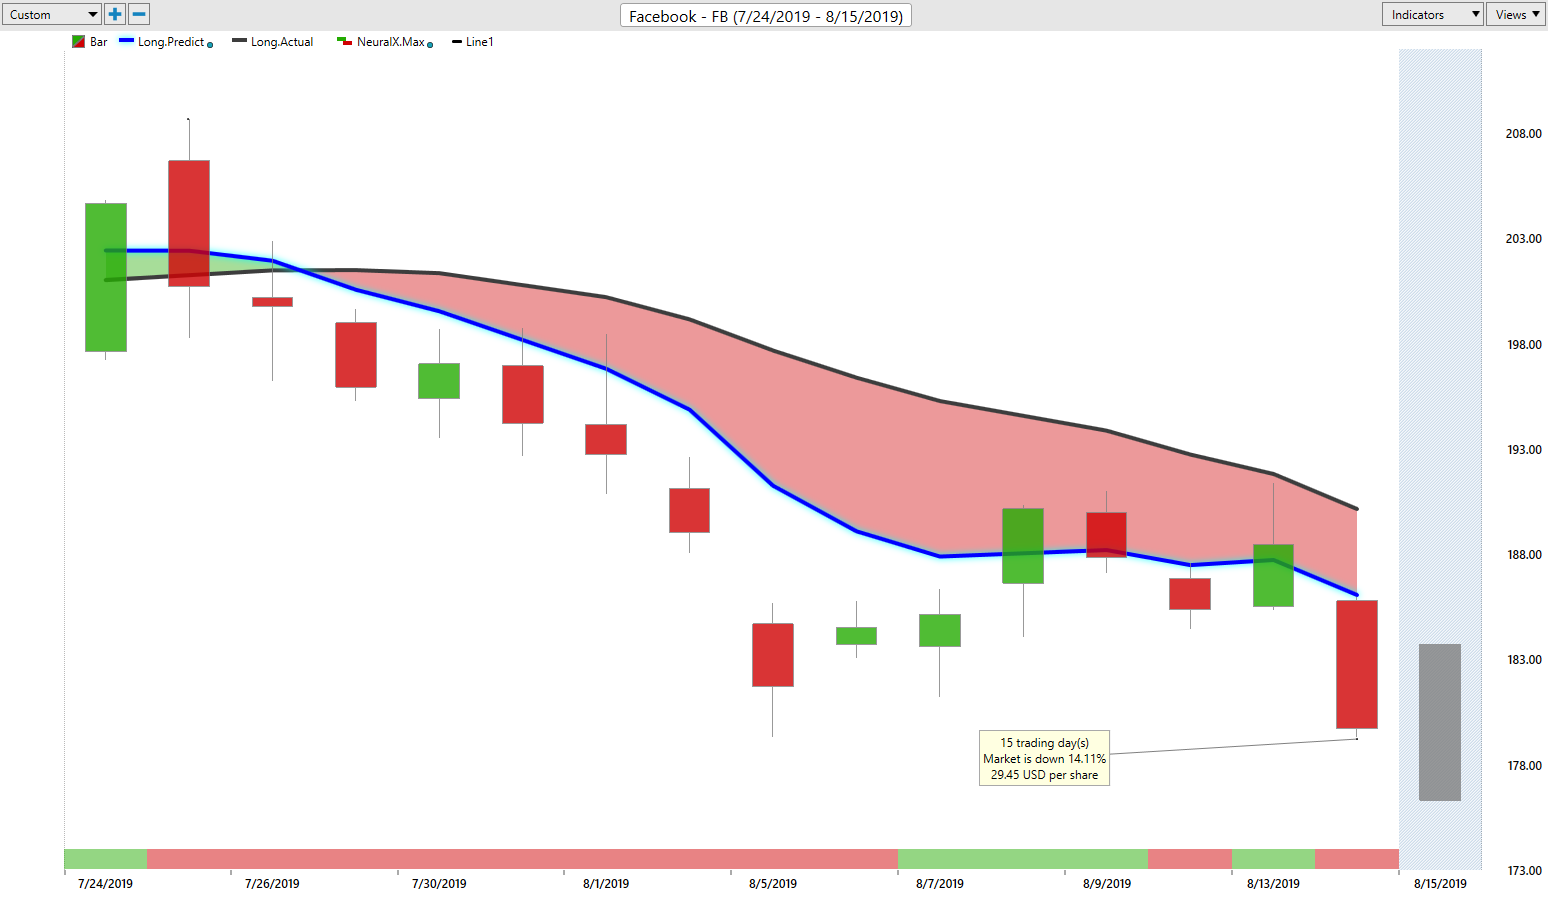
And you see on days like this where you get this neural index saying, “Expect some higher prices,” slanting of those predicted highs and lows moving higher, and within a couple of days, these stocks are moving in that desired direction as far as seeing those declines. But you just see how chippy these things can get, a huge gap up here, a little bit of gap down here, a big gap down here, and then things really accelerating to the downside. But as far as the overall trend, you can just see the amount of separation going on here between that predicted moving average and the actual moving average, and at no point signaling that this is a market you want to go ahead and get long in, so a really great opportunity to go ahead and buy some put options, get very defensive there.
Amazon(AMZN)
Revisiting Amazon, the same thing. This has been going on for a while here, all the way back to the midpoint in July. Here’s your crossover to the downside. Get a little bit of this retracement, but still that blue line below the black line, and you’ve just seen the amount of separation coming as these markets accelerate downward. You definitely want to go ahead and have these tools that help you understand that, okay, well if intraday I want to be short and I’m looking for areas to go ahead and add to an existing position, well, where do you want to go ahead and do that? You just see that the range as far as volatility really starts to expand, but the bigger picture still signaling that you want to go ahead and be short, add to your short positions.
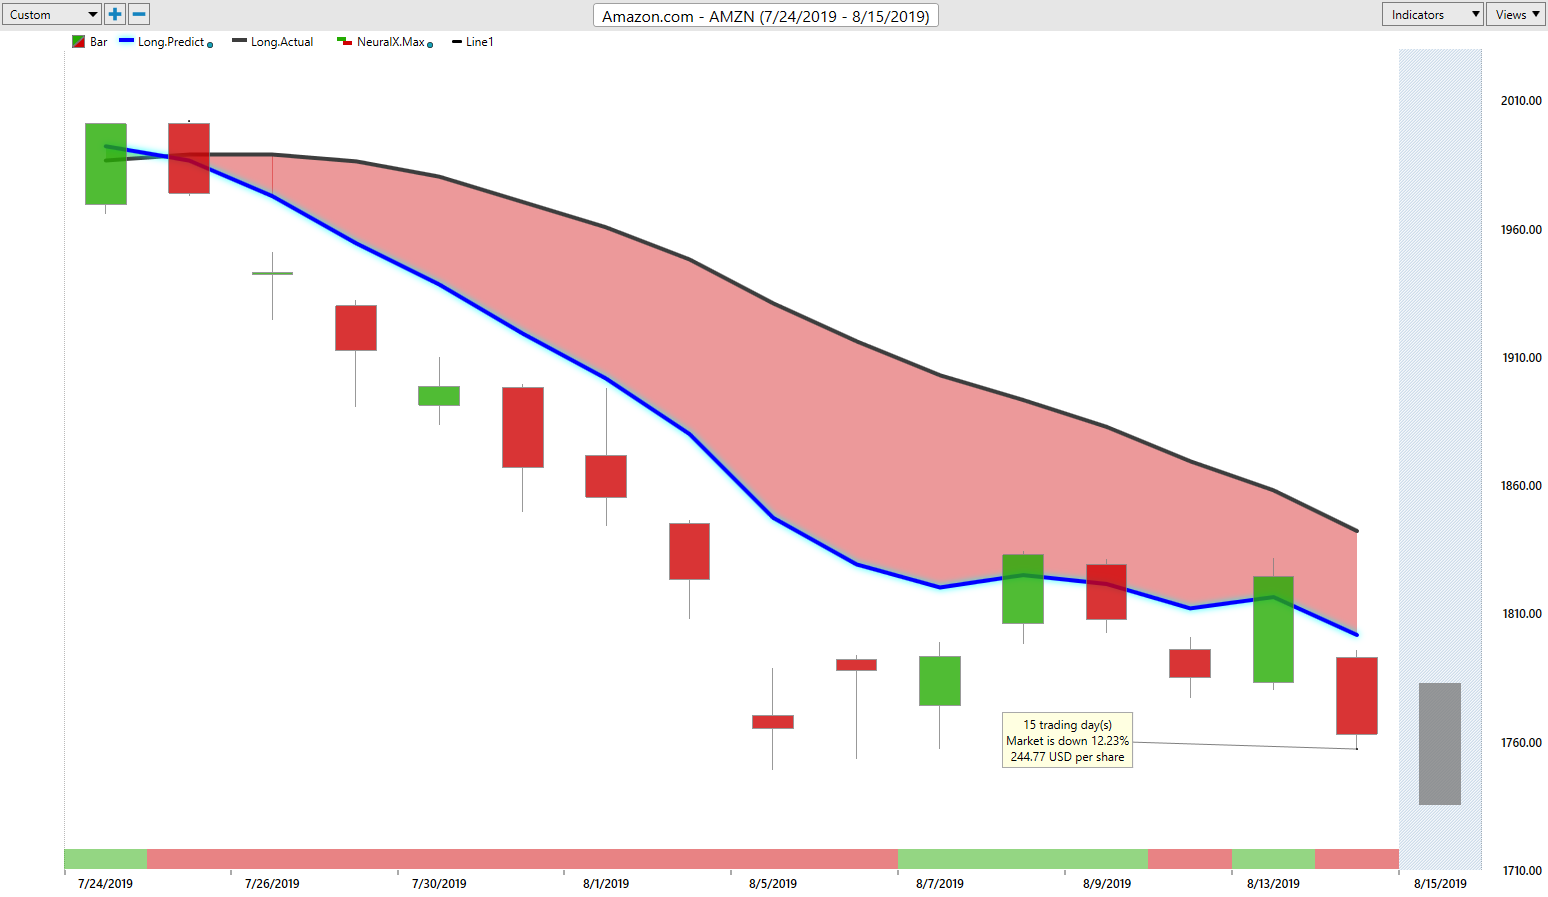
Of course, recognizing this at the beginning of the move, right? When things originally start, you know, these crossovers start to emerge, that’s going to help you deal with the volatility as the trend continues, and of course, always looking for that opportunity to where things actually reverse and start to move higher. But we’re not quite there yet. You see the market down over 11% just in about 18 trading days.
Vale S.A.(VALE)
Here in more of the basic materials space, really outside things like gold. We looked at AUY, a nice proxy to get long of the gold market. That’s a market that’s moving considerably higher. But here we have a trend to the downside, and you just see the incredible amount of weakness in here and how this volatility sorts of comes in, right? You get a neural index up and you’re see these shares an of bounce around, but the separation between the predicted moving average is still quite substantial here.
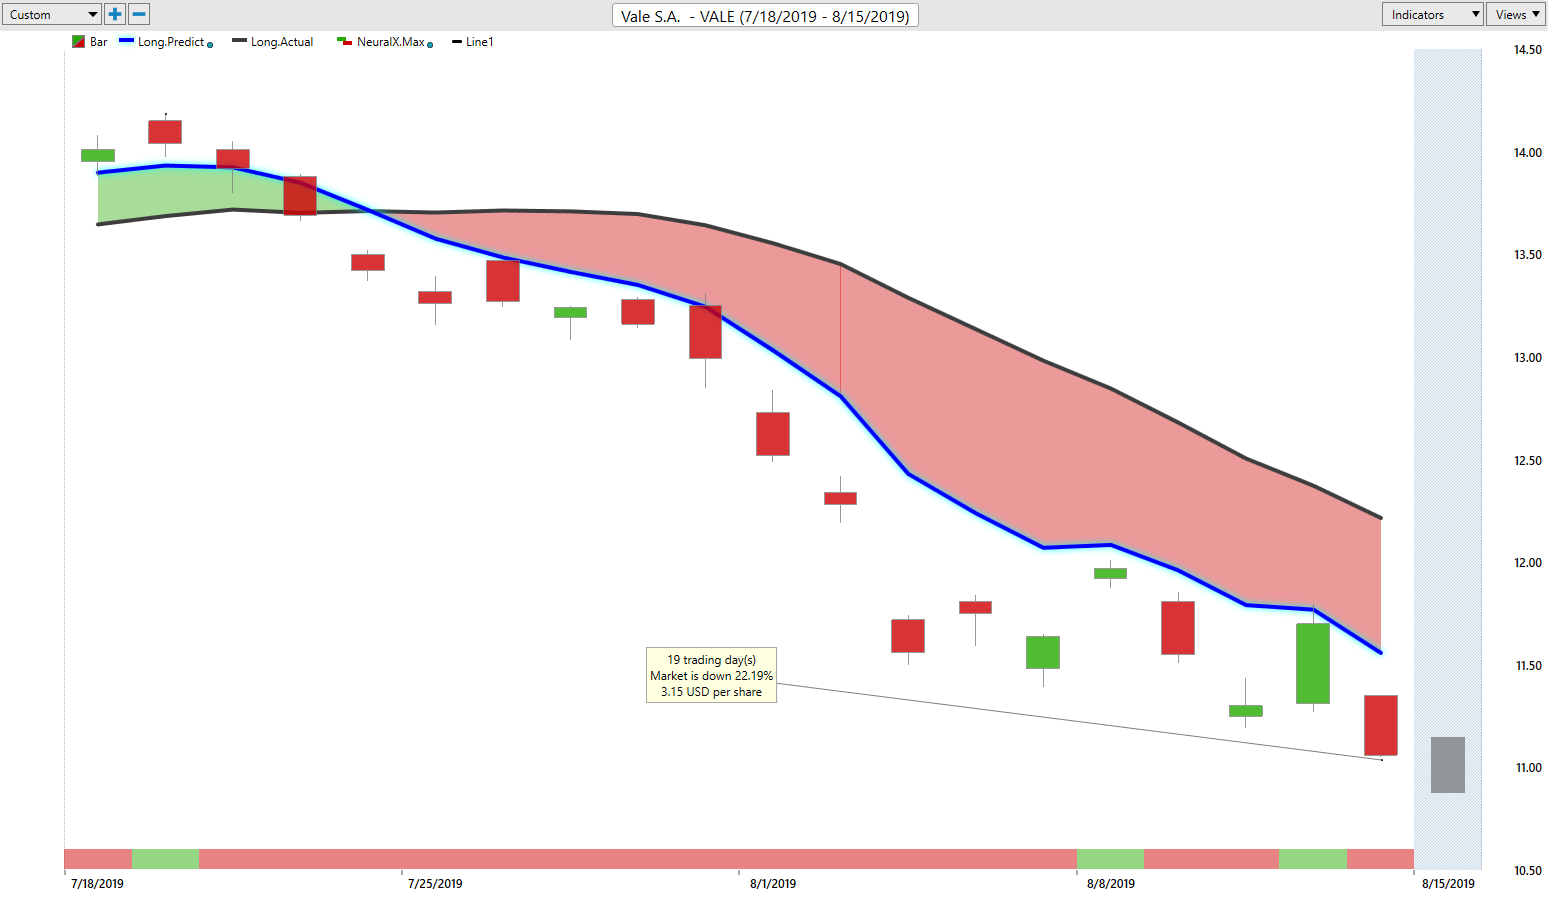
And so, prices are going to want to drift above and below that predicted average, but don’t lose track of that bigger picture. Understand, okay, well where can I hedge my portfolio, actually look to go ahead and get short? If you’re a shorter-term trader, where intraday should I be looking to add to a particular position here? So on these sort of gabby days, you end up getting filled at the open when the market wants to go ahead and gap like this, should you have a stop or something or a limit waiting in the market over those periods of time.
Really substantial opportunities all throughout the market, but you want to be short. It’s become very clear over the past two weeks here that it makes sense to have some of your portfolio exposed to the short side. If you have a retirement portfolio, great time that hedge your positions. We forecast here for inverse ETFs, buying put options on the stocks that you currently have that are going into these down trends, but you just see how nasty this can get very, very quickly.
Xerox Holdings Corp(XRX)
And when you have a tool like this you can get in a really nice entry and trail your stops, so should this a weakness persists for a considerable amount of time, which it seems like we may have an issue here for the while moving forward. You see things just really accelerating to the downside. Here are shares a Xerox crossover to the downside. You see you get this up and down nature of the neural index, and you get this flat and sideways period. But it doesn’t change the big picture as far as directionally, where is this market going, and should you be shorting on those rallies? So when you can anticipate, hey, there’s going to be some higher prices over the next 48 hours, and I should be looking to directionally short the market with those rallies coming through, you can get a great intraday or short term price to participate or add to an existing position.
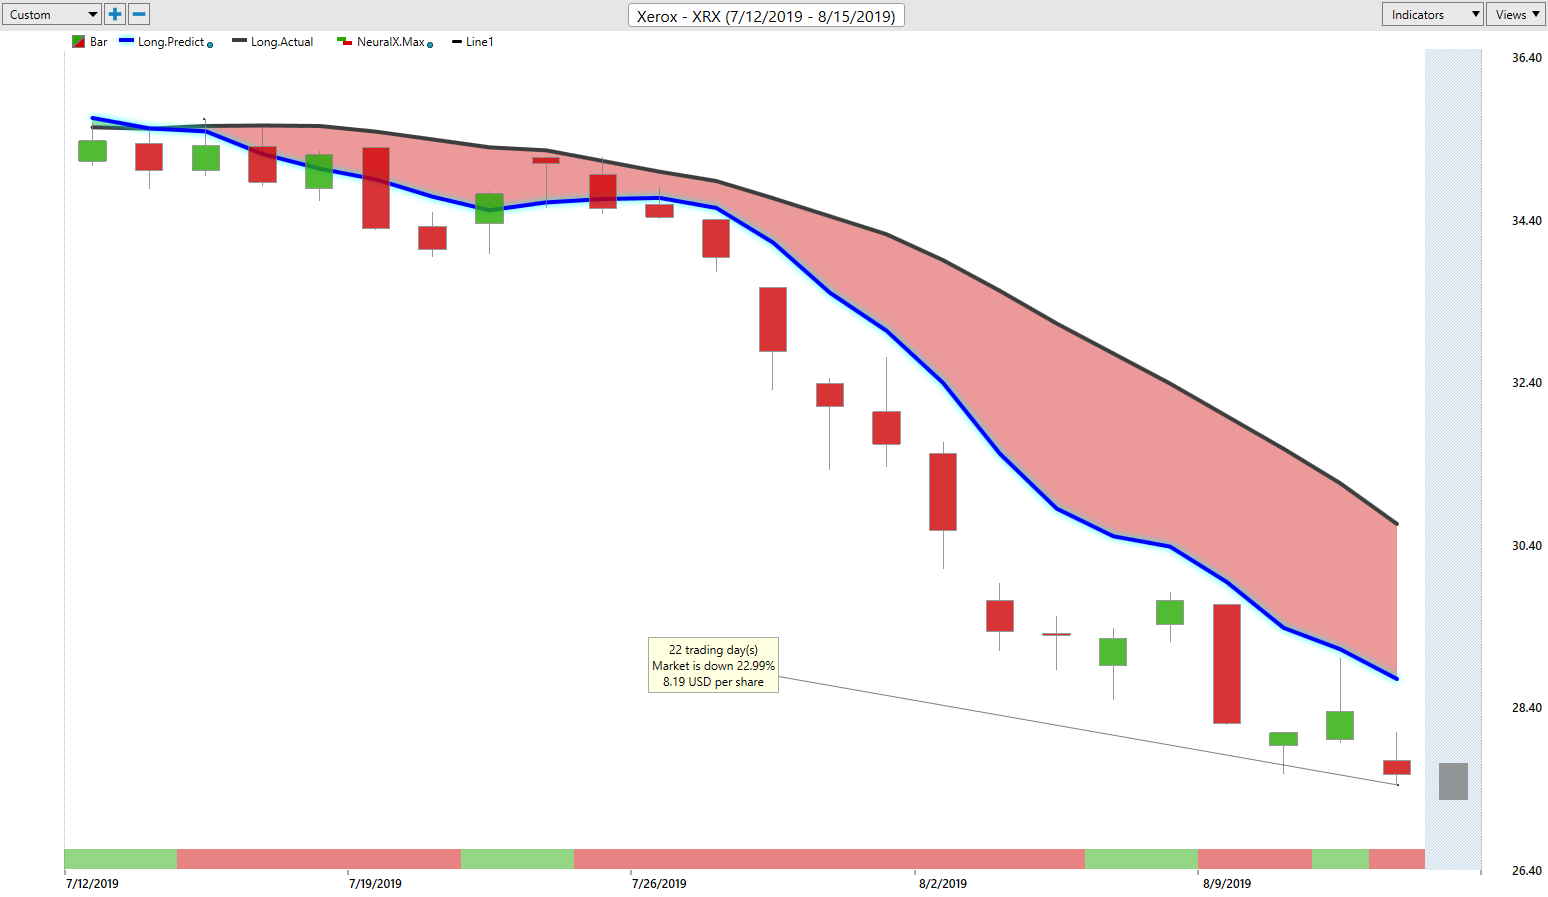
As you see, these things have persisted for quite a while here. Another seven and a half percent decline there.
So, really great opportunities throughout the marketplace, but of course you really need the tools to really get the best of this and understand where it’s appropriate to go ahead and be adding to a particular position. Again, you see August 1st here, a pretty clear signal here. The trend’s down. The neural index down, you hit that predicted high, another 15% drop from there with a couple more entries, shorter-term to go ahead and short the market there.
When you have that guidance and those tools to really help you moving forward, it definitely makes things a lot easier, and also you get a real benefit of running the scans on all the stocks that are available within VantagePoint to really see the large sectors start to move together. And when everything starts moving lockstep, you really know it’s time to go ahead and get defensive and keep a lookout, because things can get really, really nasty when everything starts to turn.
Once again here, this has been our Hot Stocks Outlook for August 16th, 2019. thank you all for watching. Best of luck to the traders out there in the markets. Thanks again and bye for now.


