


Hot Stocks Outlook for the Week of
August 2, 2019
The Hot Stocks Outlook uses VantagePoint’s market forecasts that are up to 87.4% accurate, demonstrating how traders can improve their timing and direction. In this week’s video, VantagePoint Software reviews forecasts for ACCO Brands(ACCO), AK Steel Holding(AKS), The Toro Company(TTC), Xerox(XRX), and Digital Realty Trust(DLR).
This Week’s Hot Stocks Outlook
Good afternoon traders and welcome back to the Hot Stocks Outlook for August 2nd, 2019. Hope you’re all having an excellent week in the financial markets and there’s always plenty of opportunities to go ahead and cover.
We’re going to start here with a few really good examples of how this technology works. Starting here with ACCO Brands, we’ve got AK Steel, Toro Company, Xerox and also Digital Realty Trust, which that realty, home building space, a little bit of trouble in that section of the overall market.
ACCO Brands(ACCO)
But starting here with ACCO. Now what’s very important to understand here is that regardless of the market you’re trading, all these indicators work the same way. And what we have here are daily bars, so each one of these candles represents a full and complete trading day, and against that price data, you see that there is a black line and also a blue line right up against those candles. Now the black line that you see on the chart, that is what we call the actual, or is a simple moving average. It’s a very common technical indicator. Take the last 10 close prices, add them all together, divide by 10, you’ve got a 10 day actual or simple moving average.
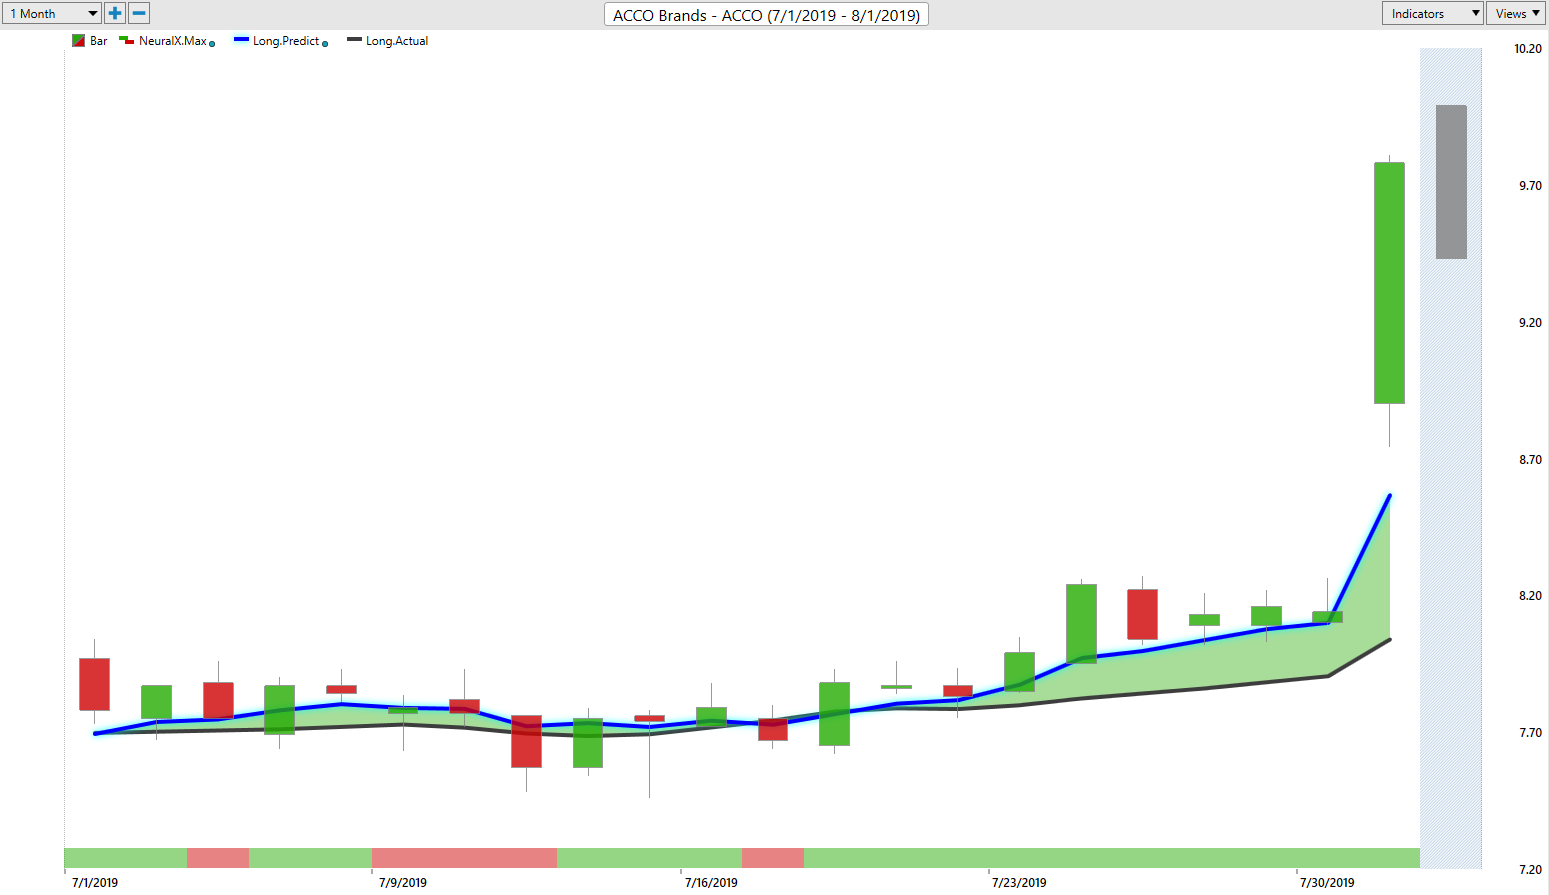
But what that indicator does it really only look at the past prices of the one market in question. Now what we want to compare that value to is this blue line against the chart. And so for this value to be generated, VantagePoint is looking at not only ACCO Brands and what’s happened in the past here, but other markets that are known to influence, drive and affect this market going forward. So in the future. So that can be other ETF groups, that can be other individual stocks, futures markets, the broader indices like the S&P, interest rates, currencies. And it’s utilizing that information to actually generate future prices, and then uses those future prices which haven’t yet occurred and builds those into the value of this indicator. So rather than just using the data from the past, it’s actually utilizing the benefit of artificial intelligence, specifically neural networks, to generate future price data and really take out the lag time associated with things like a moving average.
Now once that blue line crosses above the black line, it’s really telling us, look, the market is expected to start moving higher. Average prices are going to start moving higher and we could expect this black line to start moving up towards that blue line over time. Now in addition to that value being generated via those neural networks and artificial intelligence, there are also a few other indicators that are also driven by those neural networks. One being this indicator at the bottom of your screen, which you see in this example, it stays green the entire time, indicating that what this really is is a 48-hour forecast, so it’s looking ahead two trading days and determining short-term strength or weakness in the market.
In this example, you see it stays green the entire way. The blue line stays above the black line. And it really says, look, this market is going to start moving higher. No real reason to expect any short-term weakness over the next couple of days. And you see that you eventually get that pop and you get a 24% rally in shares of ACCO. Obviously, this market trading around $8 a share, now up towards 10, so easy go ahead, buy a thousand shares or so, not a huge position, and able to make a couple thousand bucks really in just the past two weeks or 10 trading days.
AK Steel Holding(AKS)
Now what’s interesting about this forecast is again, for whatever market you’re looking at, it’s going to work the same way. So if we come over here to AK Steel, we have a very similar situation. This blue line getting a very strong cross above the black line, signaling that prices are going to start moving higher. But what I want to bring your attention to is things like this where the neural index, that 48-hour indicator, sometimes will go red. And what that’s telling you is expect some weakness over the next couple of trading days. But as long as that blue line remains above the black line, the trend is still to the upside.
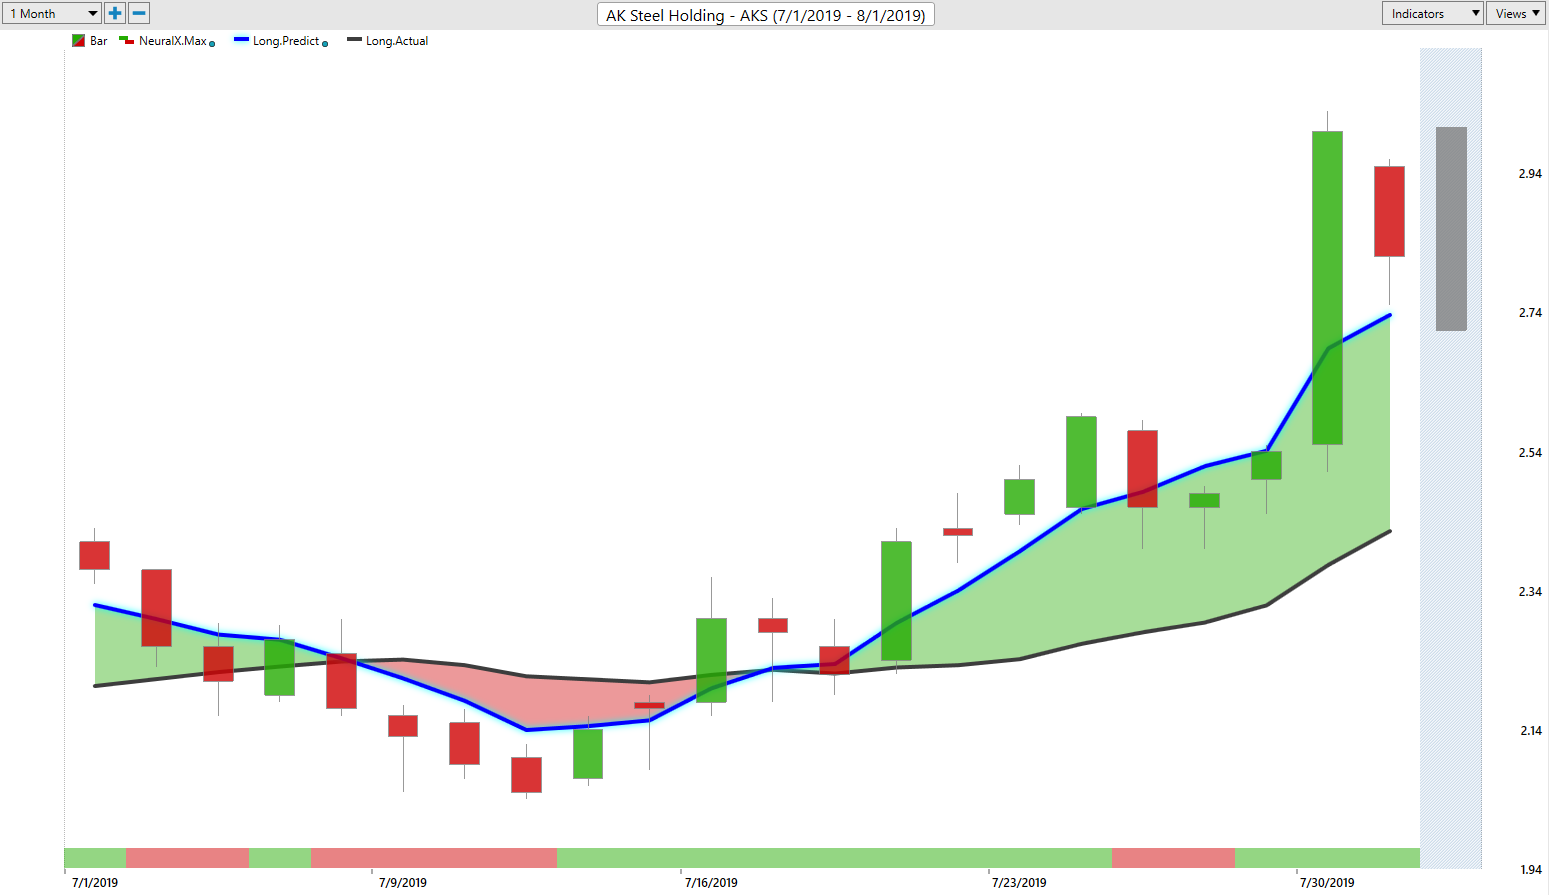
So what you’ll tend to notice with these forecasts is that while the trend’s moving higher, you may get these situations where that neural index goes bearish. And generally how I like to look at this is that you’re likely going to see some price action take place below the moving average. So if we have a predicted moving average of where prices are likely to trade moving forward, but there’s going to be some short-term weakness, we know we should probably trade above and below that average at times. And this is a good time to expect some of that price action again to take place below those predicted moving averages.
Now to help you with even that shorter-term intra-day, you’ve got a predicted high and low that’s generated before each and every trading day. So we can actually see how accurate each one of these predictions is for the trading day in question. And you see that once you say, “Okay, well I want to go ahead and start getting along in this market,” you get this tool that’s going to adapt for you. And you see this trading day comes through and it says, okay, well we’ve got a wider range here. Expect the predicted lows to come down here. You see the next day we move up towards the predicted high, hit a couple more predicted lows along the way here, but still saying, look, the only real direction you’d want to trade this market is to the upside, and especially during these periods where the neural index goes bearish, expect these moves down to the subsequent predicted lows, but a really great time to go ahead and add to your position and get involved with the overall move.
So really nice move here. The metal and mining companies have done very well really since the beginning of June, along with the broader markets have done really well, but specifically things like the XME ETFs, steel, aluminum, minings. This market just in the last 11 days up 32%. And again, really great opportunity on the cheap stock to catch a significant move to the upside just over the past couple of weeks.
The Toro Company(TTC)
Now moving forward, again, mid-sized companies doing fairly well here. ACCO, we’ve got the Toro Company, same thing. It crossovers to the upside, coming through the midpoint in July. And you just see all the strength here from this neural index. You get a little bit of a… One day you spend down with the neural index bearish, a little bit a weakness, a little bit below that predicted moving average there, but just so much distance between the moving average and then that lagging moving average. And that’s what’s telling you, look, this is a very strong trend.
And again, the only direction you can trade a market like this is to the upside. The trend is very much to the upside. You see you get an entry here, here, here as the market consolidates a little bit, in the market, right here, opens up a little bit lower. You get filled at that level, filled here. So you see one, two, three, four, five, six entries along the way, and regardless of your trading style.
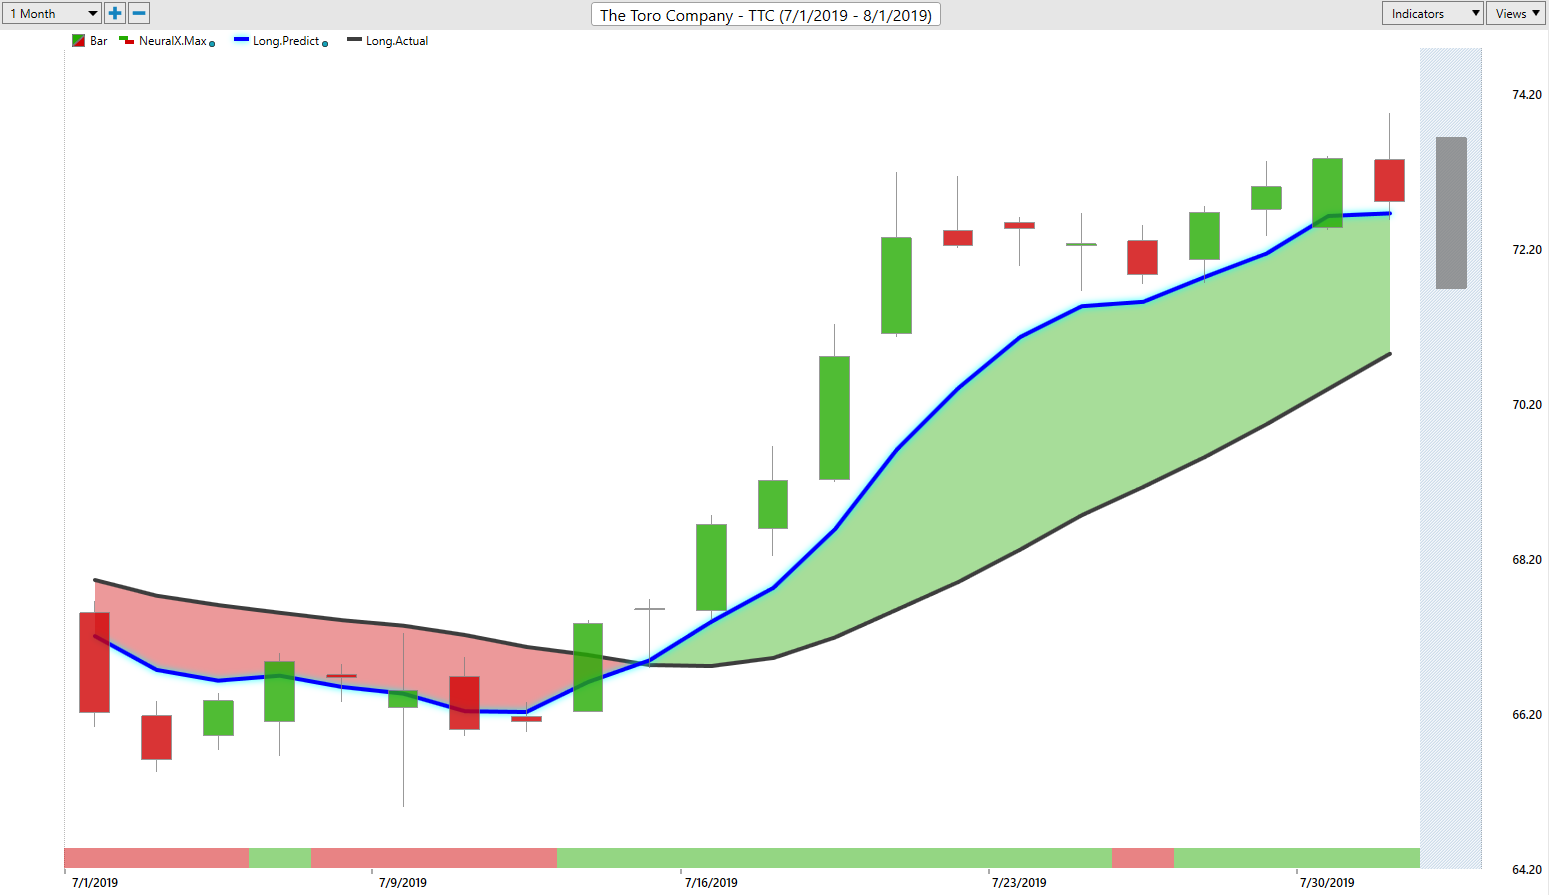
So maybe you’re shorter term and you just want to take this piece out of the market, get into the market and then target these predicted highs that come through. But have that tool that’s going to help you really adjust moving forward and understand volatility moving forward. Where should I expect prices, if it still fits in your framework for sticking into a longer-term trade? You don’t have to get out of the market, but recognize that yeah, the market may trade down to these predicted lows. And be careful over those 48 hour periods not to get shaken out of a market where the trend is still decidedly in your favor.
So a really nice opportunity here in the Toro Company. Obviously a really great entry at the beginning of this move, and the market up just about eight or nine percent over the past couple of weeks here. Now there’s been a few spots where there’s been that weakness in the market. We saw things like Amazon pullback, AMD. Some of these stocks did very well earlier on in the summer but are now places you really want to avoid.
Xerox(XRX)
Here’s Xerox though, and very clearly here we see we get this crossover to the downside. And another good example of how this neural index works.
So you understand that that blue line being below the black line, directionally the trend is now down, but you may get these periods where you may trade on the bullish side of this predicted moving average over those 48-hour windows. You see again here you get a little bit of consolidation as the market trades higher. You get these moves above the predicted moving average. But the trend very much to the downside, and once that neural index goes bearish again, you see that trend really starts to accelerate. And you’ve got the guidance moving forward that says, okay, well, if you’re going to start shorting this market, where do you want to look is ideally you can get in at these predicted high levels, be a great entry-level to take a position, but really great opportunities moving forward. Here you see you get about one, two, three, four, five entries before this market really starts to accelerate to the downside, and a really nice move to hedge your portfolio.
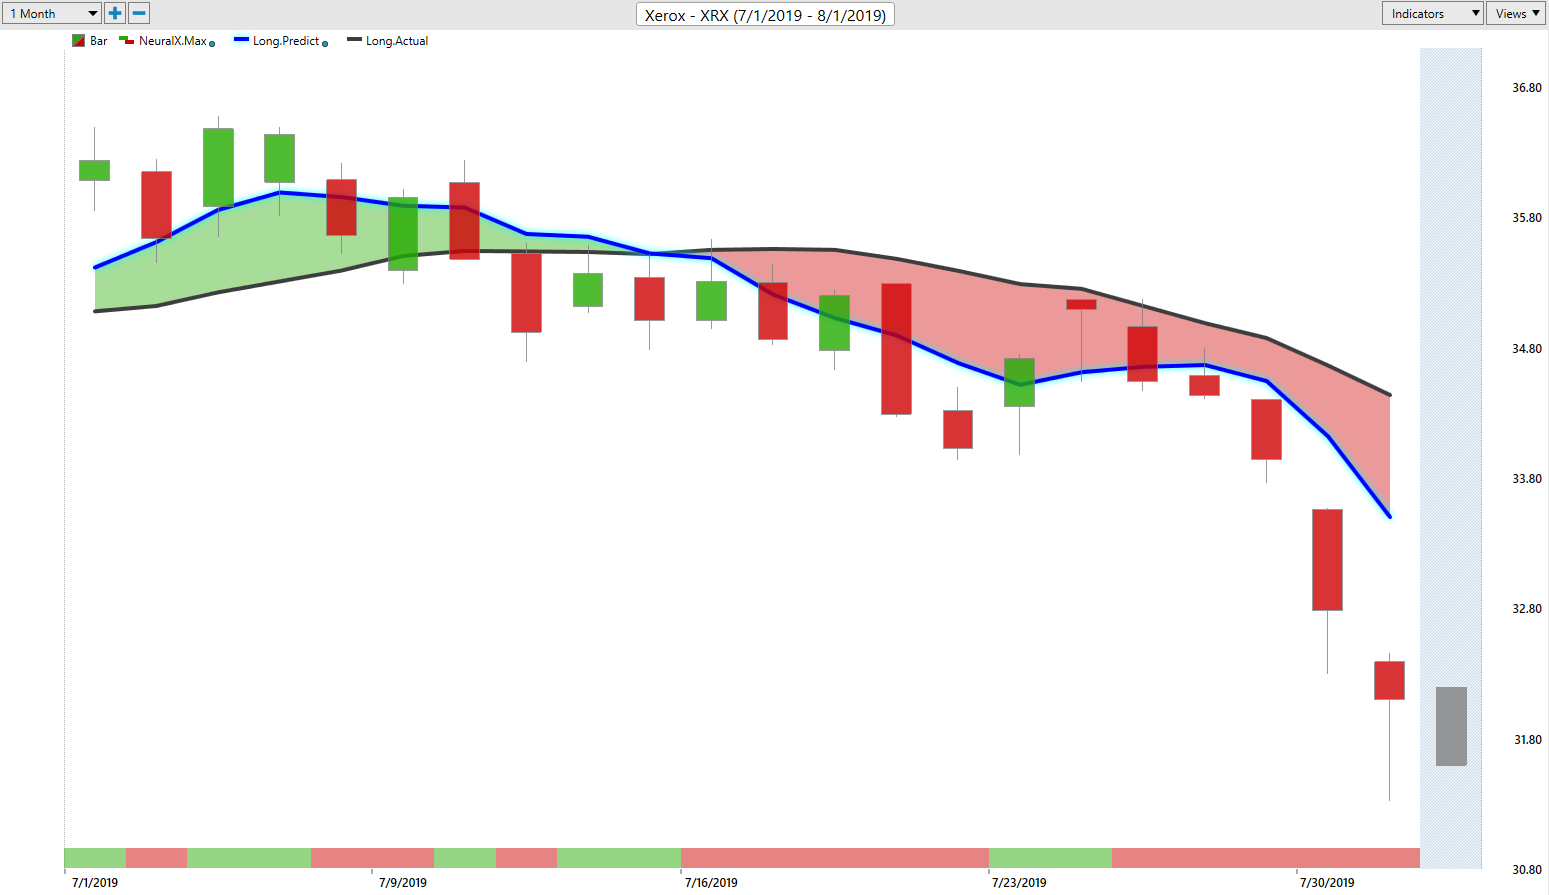
So there are those places in the market where you can go ahead, look to get short, in addition to some of your long positions out there. So you see this market up over 9% to the downside here in just the past couple of weeks. Over the past couple of weeks have been all these areas, some places you can get long, some places you can get short. One of the places specifically, I think we focused on Lennar Homes last week, but realty, real estate, home-building, definitely not an area where you’d want to look to get long in the market.
Digital Realty Trust(DLR)
And you see here in Digital Realty Trust we get that crossover to the downside. Again a couple of these instances where we get this gap up on the upper side of that predicted moving average. Again here you don’t really get too much of a move here. You get a consolidation as you bounce higher. But the trend’s still very much to the downside here.
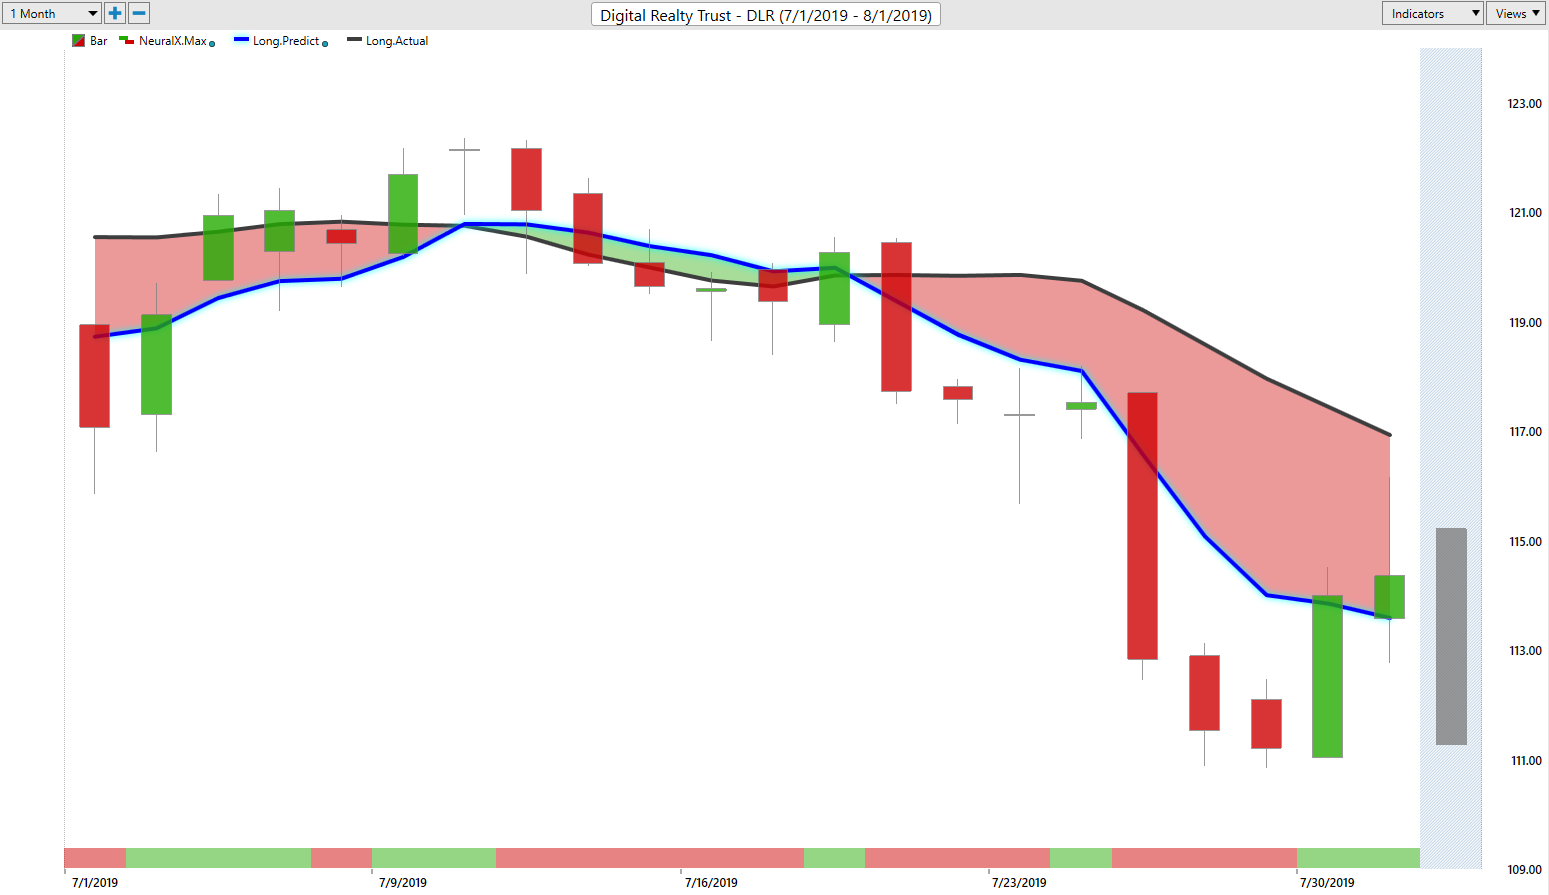
And some great entries early on to say, okay, well, where do I want to short? Well, this is the trouble with trading too short term is a lot of times the best entry to get into this market is on an up day, and you see the market ends up closing up at that predicted high. But understanding that, look, the trend is to the downside, and you see immediately that next day trend resumes and things start getting very, very bearish here. And a couple great more opportunities to go ahead and add to that position. But of course, with profits you’ve accumulated over the past couple of weeks, getting that good entry on the short side of these trades.
So again, really great opportunities spread all throughout the marketplace. This market down about four or five percent obviously, some of those realty and trust, and rates and things like that, going to move a little bit slower than the market. But certainly, you can clearly see those areas you want to avoid in the market, and some of these other areas where it’s really full steam ahead. Really nice crossovers and trend working in your favor, and you can manage those positions moving forward, add to them as they start working for you and really make a significant amount of money over the past couple of weeks here in the market.
So once again, this has been our Hot Stocks Outlook for August 2nd, 2019. Thank you all for watching. Best of luck out there and bye for now.


