


Hot Stocks Outlook for the Week of December 27, 2019
The Hot Stocks Outlook uses VantagePoint’s market forecasts that are up to 87.4% accurate, demonstrating how traders can improve their timing and direction. In this week’s video, VantagePoint Software reviews forecasts for Canadian Solar (CSIQ), Diamondback Energy (FANG), WPX Energy (WPX), Nabors Industries (NBR), Apartment Investment & Mgmt (AIV) and Cabot Oil & Gas (COG).
Register for a Free Live Training!
This Week’s Hot Stocks Outlook
Hello again traders, and welcome back to the Hot Stocks Outlook for December 27, 2019. I hope you all have had a great holiday break, and of course, gearing up for a great trading year in 2020. But of course, you know the markets wait for no one, and there are tremendous opportunities really happening even now in the equity markets. So we’re going to go ahead and take a look at Canadian Solar. We’ve got WPX Energy, Diamondback Energy, Nabors Industries, Capital Oil and Gas, and lastly, Apartment Investment and Management.
Canadian Solar (CSIQ)
Now, we really spent a lot of time over the past couple of months focusing on healthcare and biotech, and those stocks still doing extremely well with this market rally. But more recently, we’ve seen a theme in many energy stocks that there’s some opportunity here. And so when we look at shares of Canadian Solar and more of the traditional oil and gas players, looking at here with Canadian Solar, this is a great example of how all the indicators work here within the VantagePoint software.
So right up against these candles, these are daily end of day candles, so each one represents a full and complete trading day, you’ll see that there is a black line and a blue line right up against that price data. Now the black wine is what we refer to as the actual moving average. What that is is a simple moving average, a very common technical indicator, but the problem is that it lags price. It’s always just looking at, in one case, the one target market that you may be trading, and it really just acts as a good barometer of where have prices been over a given period in the past. And of course, as traders, we need to understand where the price is expected to go moving forward.
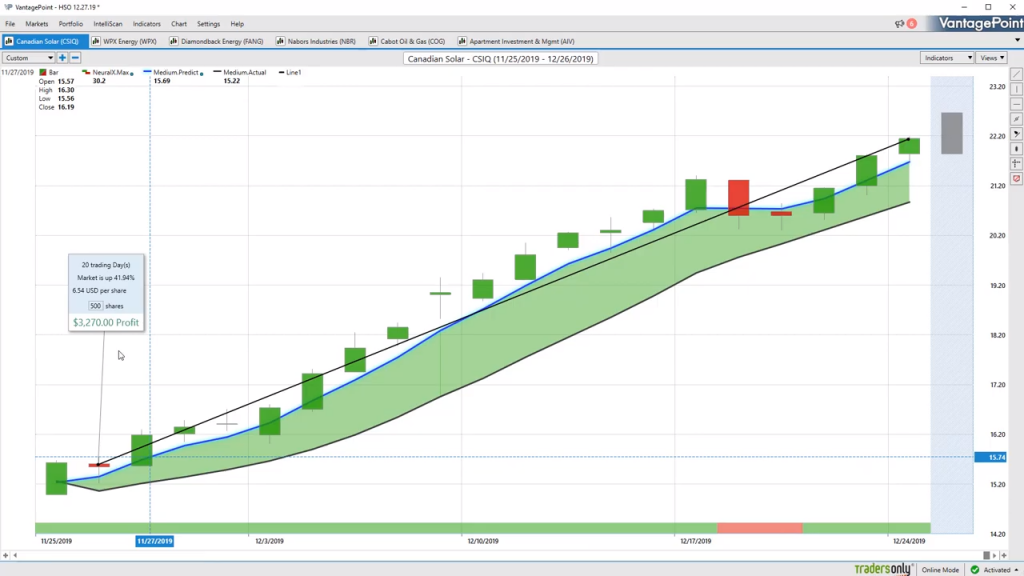
And so you’ll see right up against that price data, there’s that black line, but also and more importantly, this blue line and for this value to be calculated every single trading day, VantagePoint is performing a very sophisticated type of analysis called Intermarket analysis, and it’s using specifically the artificial intelligence and neural networks to analyze Intermarket relationships that are known to drive and influence the target market, in this case, Canadian Solar.
Now, that can be things that are really big and obvious like the S&P 500, the dollar index, crude oil prices, natural gas prices. But what the software is able to do is actually find a lot of those subtle relationships that don’t appear obvious, so it’s able to look through huge amounts of data and derive very important relationships between ETF markets, individual stocks, certain agricultural or commodity and futures markets, and what it does is it actually generates future prices. So you can think of that as candles in the future that haven’t yet occurred yet, and it builds that data into these moving averages, turning them from lagging indicators into forward-looking predictive indicators. So whenever that blue value or that predicted moving average moves above the actual moving average, it’s telling you prices are expected to start moving higher.
Now, in addition to that predicted moving average, you’ll see there’s another indicator at the bottom of the screen. And this is going to change from green to red every single trading day, but what it’s doing is it’s tuned to look eight hours into the future and measure short-term strength or weakness in the market, so not the overall trend, not the prediction of the moving average moving forward, but just short-term strength and weakness over those 48 hours windows that it’s forecasting for. And last, but certainly not least, as you see at the very right-hand portion of the chart, you actually have a shadow candle here, and this is actually predicted trading range, so a predicted high and a predicted low, which is generated before each and every trading day so that you have good intraday levels to go ahead and take positions, add to a current position and make trading adjustments.
Now, as we can see in this example for Canadian Solar, as long as that blue line remains above the black line, the overall trend is to the upside. And we can see in this particular market, these shares are up 41% in just the past 20 trading days. So again, this whole energy space has seen a lot of attention and we’ll see the same theme on many of these charts, and that’s what the software is able to do is alert you to, “Hey, here’s an opportunity focused on these particular markets,” but more importantly, in addition to that 41% rally in the market, you also get those predicted levels, so good intraday levels to understand, “Okay. Well, where should I be looking to add to my position? Where should I be taking profit if I’m a shorter-term intraday trader?” and you see about four really nice entries over this 41% rally in shares of Canadian Solar.
WPX Energy (WPX)
Here in WPX Energy now, these are more of the traditional oil and gas players, but we’ve just seen just like in biotech and healthcare where that whole market started to move up really at the beginning and midpoint of October, it became very obvious that that’s where the opportunity is, and that area benefited tremendously from the overall S&P. Well, this market more likely to benefit from what’s going on in the crude oil and natural gas markets. But you see here in WPX, same example here, blue line crossing over the black line. You’ll see when this neural index goes down to a red, you get some weakness, and what I often look for is the market just trading on the lower side of that predicted moving average, right? If you have an average, you can trade above and below it.
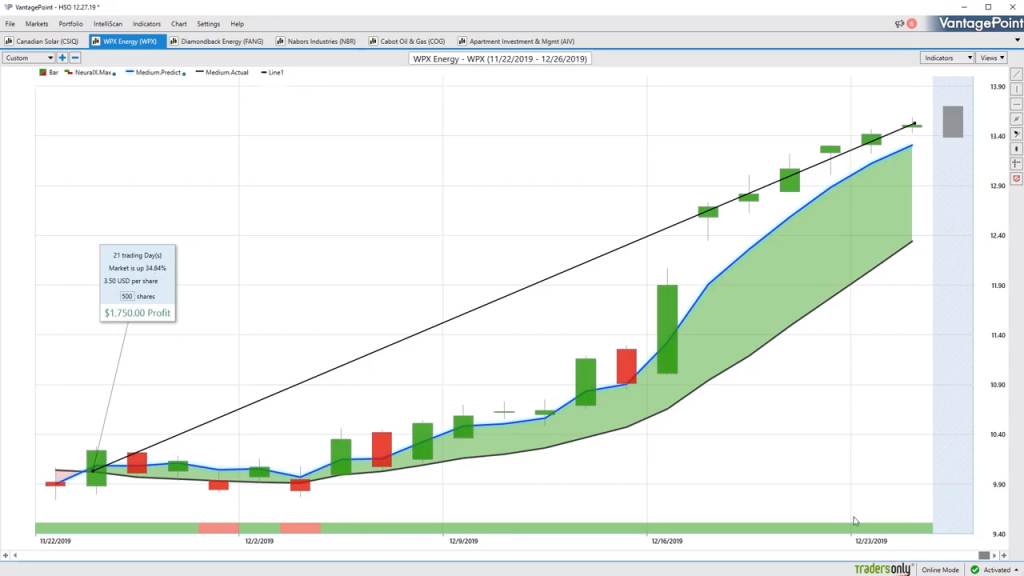
Well, when the neural index is saying weakness over 48 hours, look for a dip in the market. But if you say, “Hey look, I know I want to belong in this market. Where should I be looking to go ahead and add to that particular position?” You see three great entries here getting in down around 980, 990 per share and multiple entries really along the way as this market moves higher and higher. And again, we’ve just seen many markets, really towards the end of November and then the early part of December here, WPX Energy here up 34, 35%, so 500 shares are up $1,700, and that is not a huge position to be taking here.
Diamondback Energy (FANG)
So really tremendous opportunity, huge percentage increase, but again, it’s the whole sector, so you’re able to go ahead and say, “Okay. Well, let me find an energy stock where I can go ahead and look to take a position.” You see again, crossover to the upside here in Diamondback Energy, neural index up at a one, but you get these periods where that neural index will say, “Okay. Well, there’s some weakness over the next couple of trading days.” You see again here you get a little bit of a dip this next day, but if you understand, “Hey look, I want to belong,” I’m looking to these predicted high and low levels to actually go ahead and buy on the dip and you see how you get a tremendous risk-reward here. Especially if you’re participating in the entirety of the move, you can use those accumulated profits to add to your position and capture market moving from about $78 per share very quickly up to above 90.
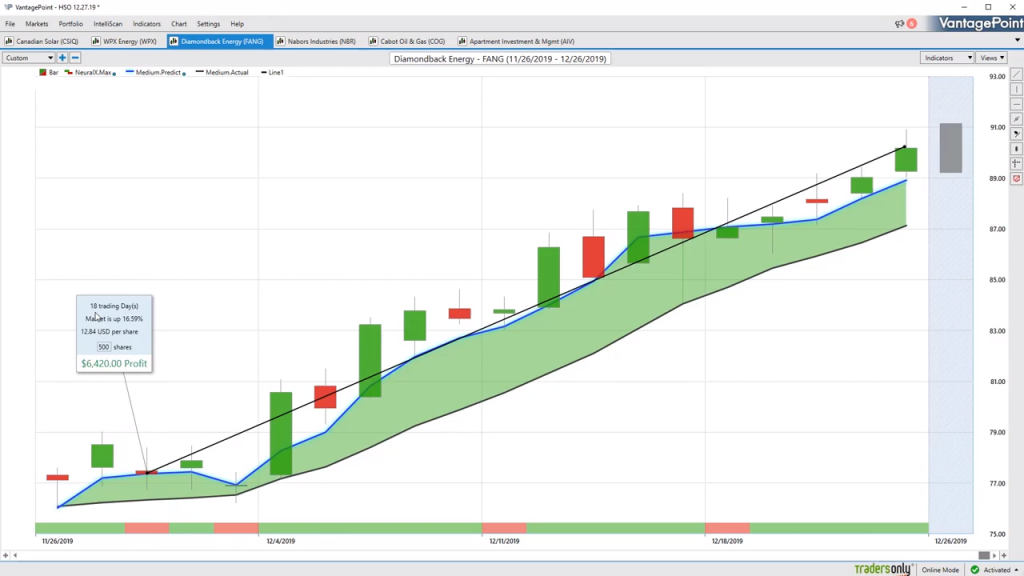
And again, many of these energy stocks are doing quite well here. You see this market up about 16, 17% in just the past 18 trading days, some of these things even a bit more recent as far as when they turned up, and that’s where VantagePoint’s really going to help you with the timing here.
Nabors Industries (NBR)
So Nabors Industry, very similar. And what I just want to highlight here is again, the neural index. This is, again, only looking ahead 48 hours at a time. So every day it’s updating you, giving you a new forward-looking 48-hour forecast, but when you have a longer term approach, and especially if you’re a trend trader here, you can understand that, look, the trend is up, but hey, expect some weakness over these windows when the neural index gets bearish, and you’ll see that you get those moves where you trade below that expectation that predicted moving average, but when everything lines up, once again, you’re getting very strong market.
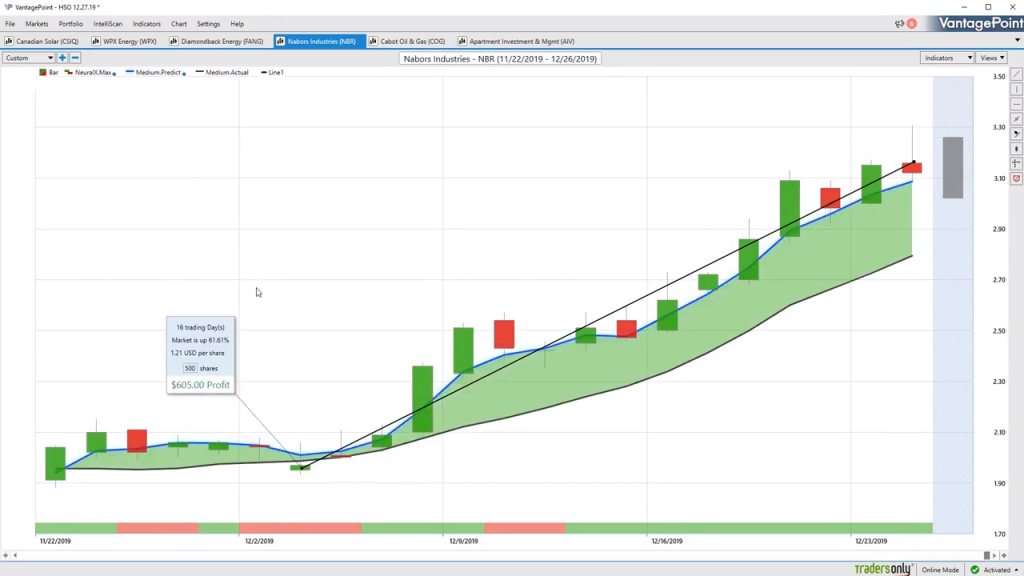
So again, whether you’re a shorter-term trader or a swing trader trading options, you want to make sure that you’re recognizing these things when those crossovers first occur, getting those exceptional prices as far as the overall move that you’re looking to get involved in. You see another example here wherefrom this latest entry here, this market’s up 61%, so again, you can look throughout the energy space, and there may be some stocks that are cheaper price stocks and you’ll get more volatility in those areas, but you’re going to understand there’s a broad theme here and it’s not just a one-off as far as the market you’re trading. You’ve got an entire sector that’s really working to your advantage here.
Cabot Oil & Gas (COG)
Here’s Cabot Oil and Gas. I wanted to go ahead and highlight how, again, here with the timing, so energies were not doing well as far as the energy stocks here. You see this market’s in a downtrend. Most stocks were, and you see a lot of those stocks that we looked at with WPX, Diamondback, Nabors here, they turned up really all the way back in November, but you want to go ahead and get that timing right so you get a really good risk-reward on what it is that you’re going for with for your particular trading style. And you see here in Cabot, you get that crossover, the blue line over the black line saying, “Look, here’s where you want to go ahead and get involved. Expect some of that weakness below that blue line over the next few days, but this is an excellent opportunity to go ahead and add to your position or take a new position in energy knowing that you’ve got a lot of strength in that overall sector.”
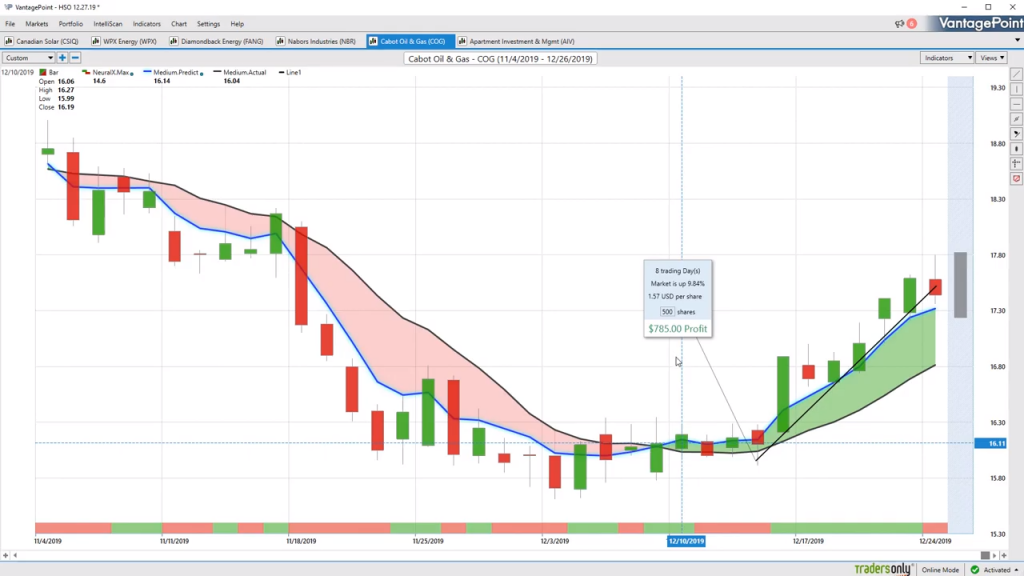
And really if you take a close look at this, you see this market up easily 10% just in the past eight trading days, but even more importantly is looking how these forecasts work even on the downside. Multiple entries were intraday. You’re getting exceptional levels to possibly go ahead and short, but then look at this neural index. It’s very bullish, letting you know you’re going to trade on the bullish side of that moving average, look to take some profit down at these predicted lows should you still be short in a particular market like this, and then very clearly the entire trend changing and saying from this point on, look to buy at the predicted lows. Target the upside and get a nice 10% rally and eight trading days here, so just a few weeks of time really.
And last but not least, I really just wanted to bring in an area where the markets aren’t doing particularly well, because we’ve seen the S&P 500 moving up and up and up and up, and it’s been a tremendous rally. Even the S&P forecasts are just saying, “Look, this market’s moving up. Don’t go ahead and be shorting or anything like that,” but you see, look, here are areas in the market that you want to avoid. And you’ve seen again, similarly to all the energy stocks, similarly to healthcare and biotech, really the real estate, the high yielding property management stuff, not doing very well.
Apartment Investment & Mgmt (AIV)
Now, obviously these things move much more slowly. But again, if you’re looking for a place to hedge your overall portfolio, looking for a place to get short, look at these intraday levels that say, “Look, okay, well, this clearly is not in an uptrend,” and if you’re looking for an area to short make a percent or two on the downside while all these other markets are going dramatically higher and higher and higher as the S&P finds new highs. So again, we see some really nice entries all along this really initiation of the downtrend here. And again, not a huge move. These things, high yielding stocks, they don’t move a lot, but when they start moving lower they can have tremendous moves to the downside of you seeing here five huge red candle days. Overall, the market’s down about 6% but a nice place to day trade, short the market, take a little profit, look for another predicted high level to take a short position or buy some put options and make some money that way as well.
So again, just tremendous amount of opportunity happening all throughout the markets here, and many of these markets up well over 20% all throughout the energy space, and then you’ve got things like Humana up 50, 60% as it’s been rallying for pretty much three months straight.
So once again, this has been our Hot Stocks Outlook for December 27th, 2019. Have a great new year. Thanks for watching, and bye for now.

