


Hot Stocks Outlook for the Week of February 14, 2020
The Hot Stocks Outlook uses VantagePoint’s market forecasts that are up to 87.4% accurate, demonstrating how traders can improve their timing and direction. In this week’s video, VantagePoint Software reviews forecasts for Crocs (CROX), Allstate (ALL), Boeing (BA), Plains All American Pipeline (PAA) and Autodesk (ADSK).
Register for a Free Live Training!
This Week’s Hot Stocks Outlook
Hello again traders and welcome back to the Hot Stocks Outlook for February 14, 2020. Hope you all are having a great week out there in the financial markets. As always, plenty to cover in this week’s outlook. We’re going to go ahead and start out. We’ve got shares of Boeing here, a lot going on in the insurance space. We’ll go ahead and look at Allstate. Last week we looked at Sketchers and saw that some of these shoe companies not doing well. We’ll take a look at Crocs this week, a little bit in the energies. We, again, last week looked at Exxon, we’ve got planes, All American, and lastly Autodesk, which is actually a stock we looked at all the way back in November, seeing how things have moved forward, but a great example here as far as shares of Boeing on how all of these predictive indicators work.
Boeing (BA)
If we go ahead and look at the market here for Boeing, what we have are daily bars and candles. Each one of these candles represents a full and complete trading day and very important to understand that that’s how the software works. It’s projecting out for the following trading day, the next trading day coming up, and it’s doing it through this set of proprietary predicted forward-looking indicators. Now, the first thing that we want to pay attention to is right up against this price data you’ll see that there is a black line and also a blue line. Now, the black line that you see there, that is a regular simple moving average or what we refer to as the actual simple moving average.
It’s a very common technical indicator and all it really does though is look back at previous prices, add all those 10 bars together, divide by 10, and it gives you a plotting value moving forward. Now, that works really great as a measure of where prices have been over a given period of time, but obviously, as traders, we need to understand, okay, where are prices going next? What we want to do is actually compare that black line to the value of this blue line that you see. For this value to be generated each and every trading day giving you a new forward-looking value of what that predicted moving average is, the vantagepoint is performing what’s called Intermarket analysis and specifically using the technology of artificial neural networks to do that.
When we’re looking at shares of Boeing and trying to forward project where are these prices going next, well, we’re not just going to look at the past prices of Boeing, like regular technical analysis. What we’re able to do here is actually look at the Intermarket relationships that affect Boeing. Now, this can be individual stocks in the same industry. This can be things like ETF groups. This can be the S&P 500, dollar index, currencies, futures markets, and all of these markets are known to drive and influence your very important relationships with the target market in question. Now, those can be positive relationships. It can be inverse relationships. What the software has identified is that these are meaningful and significant over time.
What it does with that data is actually generate future price, so actually predicted price that hasn’t yet occurred, and it actually builds those predictions into the value of these indicators, turning what was a just reactive indicator into a forward-looking indicator that’s not just based on past prices, but actually praised on forward-looking predictions. Now, whenever we have that blue value or that predicted moving average, in this case, cross above the actual moving average, it’s suggesting that average prices are going to start moving higher and therefore you’d want to go ahead and look to take a long position. Now, what’s very important to understand about this though is that that’s not the entirety of the forecast here.
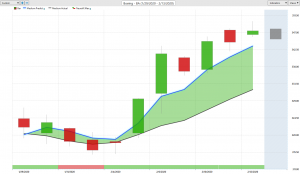
If you actually look at the very bottom of the screen, you’ll see that you have a bar that goes from green to red. This indicator is updated every day, and it’s looking at actually projecting for the next two trading days ahead. What it’s doing is forecasting very short-term strength or weakness in the market. Not the overall trend direction, not average prices over a given period of time, but just over the next 48 hours short-term strength or weakness. Where that can be very effective is letting you know in a situation like we have here in Boeing is the trend is to the upside, but you’ll notice that this neural index, it goes down to a red configuration here and it’s letting you know that expect weakness in prices over those subsequent 48 hour periods.
Of course, that will update moving forward and update if it’s going to get green and let you know that there’s strength over the next 48 hours. But how I like to think of this really straightforward way is that if we have a very accurate measure of the predicted prices through the predicted moving average, well, when that neural index goes bearish, you’re likely to trade on the lower side of that average, obviously an average we can trade above and below it, and in this case really help to know is when you’re likely to trade over the next 48 hours below that value or above that value. Now, to really round out the forecast, you’re also in addition to the overall trend direction, in addition to 48-hour forecasts, you’re also given an intraday predicted high and low.
This is really the benefit of these neural networks is they’re able to really identify what area or what timeframe they’re trying to predict and they can be tuned to really go ahead and hone in on these specific areas. Whether you’re a day trader or a swing trader or you trade options, you’re going to understand what levels you really want to be looking for and then you can go in and say, “Okay, well, intraday, where do we want to be looking to go ahead and actually taking positions on a particular asset.” You’ll see here that in shares of Boeing, as the market moves forward, you see we get that predicted high and predicted low for the next trading day.
But these things are updating each and every day, letting you know, okay, well, where should you look to come in? You can see how accurate these are moving forward. Now, the overall trend is up and we obviously got a big breakout there, but you see how very quickly these things get back online and give you very good levels to go ahead and take action on. Really nice moves here in shares of Boeing. Market up so far from those predicted low levels, which we actually had those hit pretty much in the bottom here, over 8% just in the past nine trading days. A very short-term move, but very clearly you see that predicted moving average say, “Look, the trend is up.” Neural index is saying, “Look, there’s short-term and long-term strength coming in here and seeing the market move higher.”
Allstate (ALL)
Moving forward, we’ve got shares of Allstate. Same concept. Regardless of the market you’re trading, whether you want to trade currencies or futures or individual stocks, it really works the exact same way. Here you see we get this blue line crossing above the black line letting you know, look, the overall trend is up. Now, we can see this trend has been in place all the way back to mid-December, but look how accurate these predicted highs and lows are at letting you know, okay, over the course of a longer term trade and where this can get really effective is kind of combining a couple of strategies.
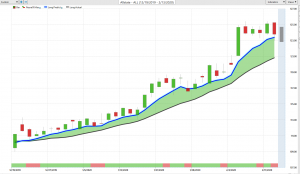
You can be a trend trader, get involved with that overall trend, but then manage your position by taking some profit at the predicted highs, buying more at these predicted lows, and really making the most of the move. When you have a market like this that over a given period of time we can say, it’s been about three months already, let’s see how much it’s moved up, you can be a part of that 11 or 12% move to the upside, but also get more of that as you’re able to trade with profits and use those profits to buy at these predicted low levels and take those little pieces out of the market. Now, obviously we’re looking at Allstate, a very big company, slow moving, sort of like one of these utilities, but 11% rally is nothing too snark about here.
CROCS (CROX)
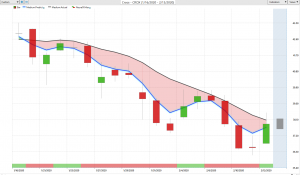
We’ve got a really nice move higher and plenty of opportunities to get in over the course of that couple months. Now, here, shares of Crocs. Now, we looked at again Sketchers last week. We had Steve Madden. What’s really helpful about the software is that it understands these very important relationships between markets. When you start to see a lot of similar markets show crossovers, meaning this blue line crossing the black line, whether it’s to the upside or the downside, we actually have a scanning feature that you can run a pretty standard process every single night and really identify when these sectors start to turn this way. You see Crocs here, we had a nice move to the upside, but more recently we’ve seen that weakness.
But again, we can go ahead and say, “Okay, well, from this point forward you’re looking to go ahead and get long and you see you get plenty of opportunities to go ahead and stake out those long positions. Get some really nice entries as this market moves higher.” But when those conditions start to change, you want to reverse course. We see that pretty much after this red candle here pretty clearly saying, “Look, the trend is now down. Now go ahead and take your short positions in the marketplace.” Again, a really nice move to the downside here. It’s a very good time in the market to go ahead and have some really hedges in your portfolio, have some areas where you’re short. You’re seeing some areas of the market actually soften up, but the S&P as an index keeps moving up higher.
Some major areas of the market moving things higher, but there’s these areas of weakness receive shares of Crocs down about 11% just the past 16 trading days.
Plains All American Pipeline (PAA)
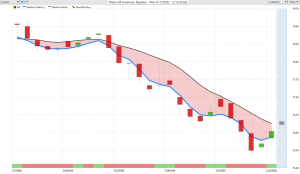
One of those areas of concern, oil and energy. Last week we looked at ExxonMobil. Here we’ve got Plains All American Pipeline and same thing here. You can see very clearly this trend is to the downside, a ton of distance between that predicted moving average and the actual moving average. We had a little bit of a pop in energies last week, but a lot of those stocks just ended up falling even further as these trends still pretty strongly to the downside. But here you see you get this neural index popping up to a green configuration. You got a little bit of strength there, but nowhere near getting this crossover to the upside.
You want to go in and say, okay, well, I understand energy is weak. We understand that that’s an area of the market where you can look to take short positions, and then you have this guidance every day moving forward that says, okay, well, intraday, where do you actually want to go ahead and take those short positions if you want to get a new opportunity in a new position on? Here we have shares of Plains All American and we can go through… I had like winning petroleum’s down 50%. Exxon’s obviously still trending lower. Natural gas getting killed. Those stocks, like Gulfport Energy, these things getting absolutely killed, but share is down 14 and a half percent just in the past 18 trading days.
Some really great opportunities to the short side of the market and offers a tremendous amount of protection. If you lare ong the market or buying the SPY or buying a S&P 500 futures, you could still have those areas that regardless of what happens in this market, you’re going to be making some really nice money when volatility really kicks in.
AUTODESK (ADSK)
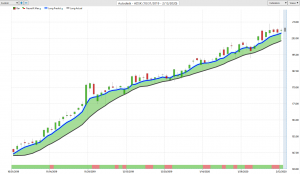
Here are the shares of Autodesk. We took a look at this really around November, so very early on here. I just want to highlight is how these forecasts work moving forward. When you get on a trend, you want to obviously understand, well, look, if the trend’s going to continue, I should go ahead and hold onto that move and use my profits to, again, make the most of that opportunity.
Again, we can see just how accurate these predicted highs and lows are. These levels that come through over the course of a trade that say, look, if you’ve got a limit order just waiting in there and saying, look, I’m going to go ahead. If we hit this level intraday, I’ll go ahead and be a buyer, you see, you’ve got about a dozen entries here just in the past couple of months here really since we brought this market in. Overall, just an absolutely tremendous move here in shares of Autodesk as overall we can take a look at this. We’ve got to move up about 42%, but easily here another 15% just in the past couple of months and plenty of levels to come in and buy at those cheaper reduced prices before the market makes another big rally higher.
Really tremendous opportunities, again, playing out all throughout the market. We also at the same time took a look at Adobe when we brought in Autodesk. Same thing. Trend has continued, a lot of great levels to come in and buy at. You see, overall this market up 42% in the past 73 trading days. Once again, this has been our Hot Stocks Outlook for February 14, 2020. Thank you all for watching. Best of luck to the traders out there in the market. Thanks again and bye for now.


