


Hot Stocks Outlook for the Week of January 31, 2020
The Hot Stocks Outlook uses VantagePoint’s market forecasts that are up to 87.4% accurate, demonstrating how traders can improve their timing and direction. In this week’s video, VantagePoint Software reviews forecasts for Walt Disney (DIS), Square (SQ), US Bancorp (USB), Fifth Third Bank (FITB), and Workday (WDAY).
Register for a Free Live Training!
This Week’s Hot Stocks Outlook
Hello, again traders and welcome back to the Hot Stocks Outlook for January 31sh, 2020. I hope you all are having an excellent week in the financial markets and as always, plenty of opportunities to cover in this week’s outlook. We’re going to start out here with shares of Square (SQ), US Bancorp (USB), Fifth Third Bank (FITB), Workday (WDAY). Walt Disney (DIS),
Square (SQ)
What we have here in shares of Square, and really a good example of how all the VantagePoint forecast works, regardless of which markets you’re trading, what we have here is daily bars here, daily candles here, representing each full and complete trading day. You’ve got the highs and the lows there. But right up against that daily price action you see that there is a black line and also a blue line. Now the black line that you see there is a simple moving average, or what we refer to as the actual simple moving average, and it’s really a good barometer of where prices have been over a given period of time, but only has the ability to look over the past as it calculates the last 10 close prices, adds them all together, divides by that number, and just plots that line moving forward.
Now obviously as traders we need to know, hey, where are prices expected to move going forward so we can be ahead of those moves and profit from them. So what we want to do is actually compare that black value, that simple moving average, to this blue line that you see generated every night from the VantagePoint Software. For this value to be calculated, VantagePoint is performing a very sophisticated type of analysis called intermarket analysis, and it’s utilizing the technology of artificial intelligence and specifically neural networks to do that. So when forecasting for what we call the target market, in this case Square, VantagePoint is looking at other related markets that are known to drive and influence the value of that market.
Now, this can be things like the S&P 500, this can be things like commodities, oil, currency prices, other tech stocks, other ETFs, commodities, interest rates. So what it’s able to do is then understand specifically how those other markets are driving and influencing the future price of Square and utilize that information to actually generate future prices that it builds into these indicators, thus turning what is generally a lagging indicator that only looks at the past, to a forward looking indicator that’s forecasting future prices.
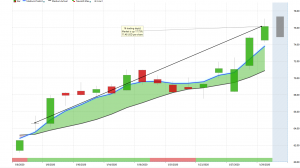
So whenever you see this blue line in this example cross above the black line, it’s forecasting that average prices are going to start moving higher. Obviously as a trend trader, you would look to go ahead and look to get long the market. If prices are expected to move higher than where they’ve been in the past, you want to get long. If they’re expected to move lower, you’d want to go ahead and get short.
Now, in addition to that predicted moving average though, there’s some other indicators also driven by that technology of neural networks, but tuned a little bit differently. So if you look at the very bottom of the chart here, you see that you have this bar that goes from a green to a red. Now this indicator isn’t looking at overall average prices, or essentially the trend of prices, but it’s really tuned to this look ahead 48 hours at a time, or two candles looking forward. It’s really looking at short term strength or weakness in the market.
So again, when you understand that if you’ve got a directional bias to the long side or the short side, but understand when that short term strength or weakness is going to come through, obviously very advantageous for a trader.
Lastly here, you actually get a predicted high and a predicted look. So again, driven by these neural networks, but rather than being tuned to 48 hours ahead, this being intraday and looking at actual specific levels as far as predictions for the daily high and the daily lows.
When we go ahead and put all this together, we can identify markets and much of this done through the help of our Intelliscan feature that can actually identify fresh crossovers and new opportunities in the software. But whenever you see that blue line crossing above the black line, we understand, okay, well we want to go ahead and get long the market.
In this case, you see a really nice rally here as shares move up just about 18% in just the past 15 trading days. But if you want to go ahead and manage that position more effectively, you can adjust your position, add to your position, take away from it, with the help of these predicted highs and lows. And you see how over the course of a move you get really good guidance as far as those daily ranges. And even on days like this where you see before that neural index went bearish here you’ve got that daily range, that prediction for the next trading day actually moving lower and you see how these markets perform over these windows and creating some very good opportunities, but of course the overall trend. Look, you only want to be to the upside as certainly as a market moves up 18% over the past few weeks here.
Workday (WDAY)
Another example here in shares of Workday, you see we have a very clean crossover to the upside really all the way back in December, but notice how this neural index really forewarns you of, look, there’s some weakness over those subsequent 48 hour periods. How I like to think of it, if we have a really good gauge of the predicted moving average, well if there’s weakness over the next 48 hours, you’re likely to trade below that average. We should expect the market trade above and below an average, but often can warn you when that short term weakness is going to come through and where you can act accordingly to go ahead and adjust that position. But of course, again, utilizing those even shorter-term levels.
So you really want to wrap all this together as far as the overall trend, short term strength or weakness, but also the very short term levels to really effectively to adjust your position size, to know when you want to be heavier on a position, where you want to take profits, knowing that if you take profits, you can likely get better prices over the next couple of trading days, and then use that update to the forecast to update your overall approach to the market.
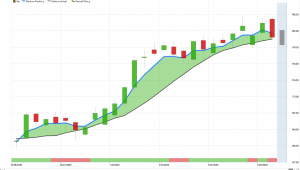
So we see here we’ve got shares moving dramatically higher here, up over 10% just in the past 25 trading days. So again, these are very short term moves just over the past couple of weeks, really a few weeks, to a month. But things have been shifting in the market in a very important way.
I really touched on this very briefly last week, we’re running the scan and seeing some weakness come through the markets and specifically that being seen in many of the financial stocks.
Fifth Third Bank (FITB)
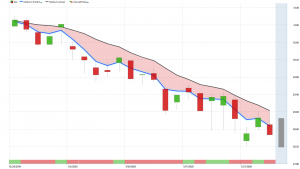
So you see here in Fifth Third Bank, we get this crossover to the downside, neural index very bearish over the course of this. But again, looking at how, okay, well if you want to look to get short, where is VantagePoint highlighting that it’s a better area, especially in those shorter term intraday levels to get short? And you see, again, you’ve got that directional bias to the short side, but you want to stay patient on getting the right price and not chasing down markets and taking on more risks than you need to.
So overall, there’s a lot of areas of weakness out here in specifically the financials, but broadly across the markets. We saw going into the week getting some gap downs and some weakness, and there’s definitely some areas where you can go ahead and profit off of that weakness and make money even if you’re just hedging some of your long positions in the market.
But using the guidance of the software to understand, okay, well where are the areas where we can go ahead and get long and add to that position and manage it effectively, and where are those areas as a buy-side trader on the long side of the market, you definitely want to go ahead and avoid and not get caught up on a bullish move.
Here we’ve got shares of U.S. Bancorp and very similar move, you get this crossover to the downside and this is where the Intelliscan is extremely effective because you can run these scans every night to identify new opportunities and you see how many of the sectors in the market are shifting.
US Bancorp (USB)
So you see many opportunities in similar areas, similar stocks move at the same time, and that can alert you that look, there’s something more broad-based going on here and really pick your spots in the market. Whether again, it’s to the long side or the short side, whether you want to hedge yourself by buying some put options. But here at U.S. Bancorp, this crossover to the downside neural index bearish. You see you get a couple of areas here where you’re going to get that short term bounce, but very important to remember that this indicator is accurate upwards of 80% of the time, so right about eight out of 10 times, and it’s also only looking very short term. So if you can set that longer-term directional bias and use this for that short term guidance but always stick with the longer-term trend here and never get on the wrong side of that predicted moving average.
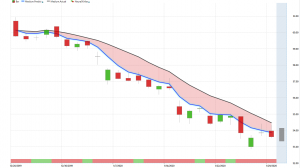
So again, we look at these daily predicted highs and lows and it offers a really great guide of where to get short. Certainly shorting the market sometimes a little bit more difficult than going long, but when you can really fine-tune those entries, you don’t have to run excessive risk and you can still get that exposure in your overall portfolio here.
So really nice move lower in shares of, again, just a lot of these financial stocks highlighting some weakness here and definitely an area you want to avoid. Another over 10% move down in just the past… That’s four weeks of trading time, pretty much a month there.
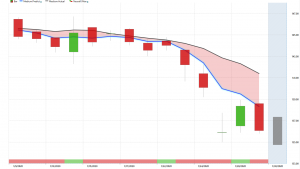
Walt Disney (DIS)
Lastly, shares of Walt Disney and again, very popular stock, had a really great rally earlier at the end of last year, but very clearly here forecasting some weakness here.
So you see again this neural index, it’ll get bullish and let you know sometimes when those short term rallies are coming in. But very clearly this saying, look, you want to go ahead and look to short the market. If you’re going to go ahead and take positions, you’d be shorting at these predicted highs targeting the VantagePoint predicted lows. And this is why this is very important because when you get on the wrong side of these predicted moving averages, or the right side, these things can really start to move.
So in this case we see shares of Disney down pretty considerably here, down over about 6%, this is just the past 11 trading days. So this is only two weeks here and we’re seeing a lot more weakness in stocks. I really touched on this at the very end of last week and that’s when we started to see a lot of these crossovers start to move to the downside when we run that nightly scan.
And what we’re able to do here is we can go ahead and open up that Intelliscan and show you how some of this works. So if I go ahead and open up a new Intelliscan here, I can bring in some of our markets, add in the US stocks, and what I really like are some of the features found within the VantagePoint software here. So we can actually go ahead and bring up our indicator tray here.
You see we have this field for Intelliscan, which allows us to really fine tune and pick which predictive indicators we want to go ahead and add to our scan. And where this can be very effective is utilizing tools like going through and and recognizing which category of market that things are starting to move.
So again, if we go to something like financials here, we can look for crossovers that have happened for more than six or seven days here to the downside. And you just see how many of these markets are starting to come through. You’ve got Bank of America, Bank of New York, Barclays, Comerica, Fifth Third. And that’s where you can identify some of these opportunities and say, okay, well what’s going on more broadly in the sector? Where is there some really sustained weakness? And then match that with your trading styles. Taking the VantagePoint tools and understanding, okay well the move is lower, let me use the short term tools to help guide that position as it rolls forward.
And again, when you take a look at something like the predicted ranges here to understand, okay well where do you really want to go ahead and have those orders waiting in the market to go ahead and really look to take a position.
So once again, you want to stay very aware out there. There’s certainly some shifting market conditions that we need to be aware of. And the guidance from the VantagePoint software, again, on that daily basis as you roll forward with your portfolio and roll forward with your strategy, very effective to understand when you should stick with a position.
We looked at things like Shopify and some of these stocks have just kept moving up. The daily range is performing very well there to manage those positions. But also understanding that there’s some things shifting out there and even some good opportunities to go ahead and short.
So once again, this has been the Hot Stocks Outlook for January 31st, 2020. Thank you all for watching. Best of luck and bye for now.


