


Hot Stocks Outlook for the Week of
July 17th, 2020
The Hot Stocks Outlook uses VantagePoint’s market forecasts that are up to 87.4% accurate, demonstrating how traders can improve their timing and direction. In this week’s video, VantagePoint Software reviews forecasts for Lousiana Pacific (LPX) , BJ’s Wholesale (BJ), Cincinnati Financial(CINF), UPS (UPS) and Cooper Tire and Rubber (CTB)
Register for a Free Live Training
This Week’s Hot Stocks Outlook
Hello in traders, and welcome back to the hot stocks outlook for July 17th 2020. Hope you were having a excellent week out in the financial markets, and there’s always plenty of opportunities to take a look at today. So we’re going to start here with shares of LPX, Louisiana Pacific. We’ve got BJ’s Wholesale, Cincinnati Financial, UPS, and lastly, Cooper Tire & Rubber.
Louisiana Pacific
So, starting out here with Louisiana Pacific, what we have here is daily bars and candles, or candles in this case. And each one of these candles represents a full and complete trading day. Also you’ve got the high and the low there, so the daily range. And right up against those candles, you see it, there is a black line and also a blue line. Now, very important to understand that this black line on the chart is actually a simple Moving Average. So a very common technical indicator, just looks at the past 10 close prices, adds those all together, divides by 10. And really what the benefit of a tool like this is, is that it really smooths out the overall price action. But the weakness is that it’s only looking at past prices, and specifically only looking at the market in question, in this case, Louisiana Pacific.
So what we want to actually do is compare that black value or that estimation of where average prices have been to this blue value that for this number to be generated each and every trading day VantagePoint is utilizing the technology of artificial neural networks to perform what’s called intermarket analysis. And so what that means is, rather than just looking at the past close prices of Louisiana Pacific, this technology is really looking at things like related ETF markets, individual stocks, the global indices, like the S&P or the Russell or the NASDAQ. Things like global currencies, global interest rates. Because what we understand is that other markets drive and have influences on other markets. And specifically Louisiana Pacific here has its own set of what we call inter markets. Markets that are determined to have a very significant effect on future prices moving forward.
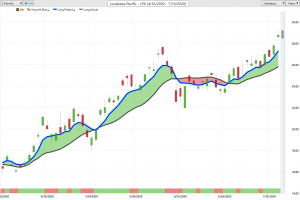
Louisiana Pacific
So what the technology does here is, it takes those intermarket relationships and actually generates predictions. So you can think of that as a prediction that hasn’t yet occurred yet about the market in question, and it actually takes that predicted data and build it into the value of these indicators. So, rather than just having a Moving Average that looks at the past and gets dragged around by the most recent close, we have now a forward-looking predictive tool that’s actually making predictions on where average price is going moving forward.
So whenever that blue line or that Predicted Moving Average crosses above the actual Moving Average, it’s suggesting average prices are going to start moving higher. For a trend trader very vital to have that information about when a trend changes and the overall direction, whether it’s to the upside or the downside. Now, in addition to that Predicted Moving Average, you’ll see at the very bottom of the chart here, you have a bar that goes from green to red, back to green, pretty much a binary output there.
And what this indicator is telling you again, each and every trading day before the … Really at 6:00 PM Eastern forecasting for the next trading day is really a short-term indicator that’s looking ahead 48 hours. You can think of that as two candles ahead and letting you know about short-term strength or weakness. Now, this indicator is extremely accurate. It’s upwards of 86, 87% accurate on the average of getting that right on whether you’ve got short-term strength or weakness. But when you can tie that in with things like the Predicted Moving Average, you have an assessment of, well, should you be going long? Should you be going short? Should you be expecting strength or weakness?
Now to really round out the entirety of this forecast with your overall trend, your short-term strength or weakness, you’ll notice there’s also a shadow candle here at the very right hand side of the chart. And that’s actually an intraday indicator. It’s giving you a prediction for the daily range or the predicted high and predicted low. Again, those neural networks being used to really pinpoint a specific intraday level that you can use to take positions.
So once you understand that a market is up or down, whether you want to be long or short, you can then come in and say, “Okay, well, where are those predicted highs and lows going into these trading days so that I can have a limit order waiting and make sure I get a good intraday price involved in that overall move?” And what’s really interesting about the software that you tend to notice after using it for a while, is you’ll see days like this where all the price action moved higher for this predicted high and low, but you see what happens the next trading day. You almost perfectly hit that previous low and the overall trend starts to move higher. And then you’ve got these ranges in here. We are bouncing off the predicted high, predicted low, predicted high, but the overall direction still very much to the upside. And of course you only want to be long taking profits on long positions there.
So Louisiana Pacific, really nice move here so far. We got a nice pop yesterday, but really since that first predicted low gets it, you’ve already got about a 15, 15 and a half percent move in just the past 10 trading days, so two weeks, 500 shares there has you up almost $2,000 in shares of LPX. Really a pretty significant move there when you got a stock from 25.50 now pushing up against 29.
BJ’s Wholesale Club
Here’s BJ Wholesale Club, and really the exact same thing. You see a lot more volatility in this market. And that’s really the thing is when you get big up days you tend to see that range really start to expand. And this is where things like the predicted high and low do a really good job of adapting. And that’s really one of the big benefits of an artificial neural networks is their ability to take in all of that inner market data, understanding how other markets are influencing and effecting, in this case BJ’s Wholesale and then really adapt to that and let you know, okay, well going trading moving forward, what has changed out there and how should you look to go ahead and manage this opportunity here?
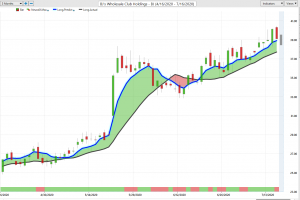
BJ’s Wholesale Club
So we see over the course of this uptrend now going back about a month’s time here, we have shares up over 13%, just in the past 20 trading days. Again, about 500 shares has you have a couple 1,000 dollars. But more specifically we can take a look at well, okay, well, how are those predicted ranges working, moving forward? And again, you see a very similar picture where you get that good guidance that says, “Okay, well, if you want to get involved intraday, where should you be coming in and taking a position?”
And you see that over the course of this move you’ve gotten one, two, three, four, five, six entries so far in that rally over the past 20 trading days. But more specifically is you see how that range adapts and really lets you understand that after each trading day what’s going on, not only in this target market of BJ’s wholesale, but how are those other markets affecting the predicted high and lows in those daily ranges moving forward?
Cincinnati Financial
Last week we looked at American Express and here we have another financial stock, Cincinnati Financial. Now, American Express wasn’t doing so well. We saw things in a downtrend, but here we can see that in this case, Cincinnati Financial is very bullish here. And you see that neural index has pretty much remained on that green bullish configuration for what’s about one out of 12 days it went bearish, but stayed green this entire time with actually a lot of separation between that Predicted Moving Average and the actual Moving Average.
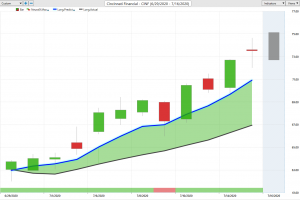
Cincinnati Financial
So again, another good indication of, well, how strong is this trend? How much is the prediction away from where market prices have been? And again, we can take a look at those predicted highs and lows. So you get a really nice entry here at the beginning of the trade. Another entry here, another day here, where again, it’s one of these days where we sort of shoot to the previous predicted low, but the overall trend very much to the upside and moving higher and higher. So really nice entry here on Cincinnati Financial.
Again, you’ve had some mixed messaging here in the financial space. So we’ve saw with Amex, not a good time to be long Amex and very likely many of the other credit card companies here. But here in Cincinnati Financials we had Golden Sachs, some of these things really pop the other day. This market up over 17% in just the past 10 trading days. Again, a 500 share position in this case has you up about $5,500 just in the past 10 trading days, really two weeks of time here.
UPS
Here is UPS. Again, we see a market with a lot of volatility to it, right? We have some big down days, big up days, but overall the trend very much intact here and letting you know that look, the overall trend is up. You only want to take long positions. You have these periods of time where it says, “Okay, well expect some weakness over the next 48-hour period.” Again, you see it here where the market really settles down for a few days, but that blue line still above the black line. So the overall trend is up. We want to make sure that we’re looking towards things like the daily predicted lows to go ahead and take positions. And again, you see these examples where you have days like this, where you don’t hit that predicted low on that trading day there, the next day you’re coming in hitting that position and then immediately moving higher here.
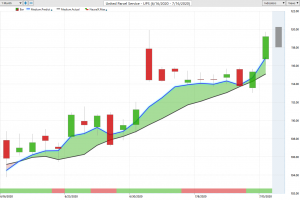
United Parcel Service
And then we see we get back on track with these predicted highs and lows, really adapting to what’s been going on here. In a day like this you see the daily range really move higher. And that’s the day where you see a lot of strength and that trend continue in that case. So shares of UPS doing very, very well here, we still have a lot of separation between that Predicted Moving Average and the actual, and again, the market up 11 and a half percent just over the past 18 trading days. And we’ve seen a lot of strength here. So we had a few periods over the past few weeks where there were some weakness. Really identified some of the financials, some of those RV stocks and things like that had really simmered down a little bit after some really nice rallies, but over the larger part of the market here is definitely moving higher.
Cooper Tire and Rubber
And then you want those tools to say, “Okay, well, if I’m going to get long here, how can I take the smallest amount of risk and still get some exposure to that upside?” Here with Cooper Tire & Rubber we see this crossover to the upside. Again, that neural index for the most part remaining bullish. But of course we want that daily guidance if we’re going to be managing a position on where are these predicted lows telling us to come in and accumulate a position. And if we’re short-term traders, where are they telling us to potentially take a little profit? You see, a day like this, you come outside the range, you see these days, because they’re gapping higher and trading a little bit lower. But overall you really only want to be long here, right? The Predicted Moving Average telling you, look, this trend is up. No reason to be short here at all. And we see again a really nice move here over the past, let’s see, about 11 or 12, really about 11 trading days since this came through.
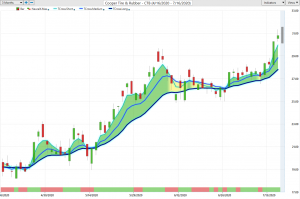
Cooper Tire and Rubber
Shares up over 13%, again, 500 shares here has you up about $1,800 there. So some really nice opportunities out there really spread throughout the markets. And then we’ve got building materials here, some retail wholesale stocks, financials, transportation here, and a tire company. So a lot of different areas of the market performing well. But of course you want to be able to identify where are the stocks with that strength and where are those areas of the market that we should just avoid, are in downtrends, maybe potentially even short and make some money on the bear side of things as well. So once again, this has been our Hot Stocks Outlook for July 17th 2020. Thank you all for watching, best of luck out there, and bye for now.


