


Hot Stocks Outlook for the Week of
June 19, 2020
The Hot Stocks Outlook uses VantagePoint’s market forecasts that are up to 87.4% accurate, demonstrating how traders can improve their timing and direction. In this week’s video, VantagePoint Software reviews forecasts for New York Times (NYT), Humana (HUM), Horizon Pharma (HZNP), Adobe (ADBE), and DocuSign (DOCU)
Register for a Free Live Training
This Week’s Hot Stocks Outlook
Hello again traders and welcome back to the Hot Stocks Outlook for June 19th, 2020. Hope you all are having an excellent week out there in the financial markets, and as always, a lot to cover in this week’s outlook. We’re going to take a really close look at some of the predictive indicators and really how this works in practice for the individual trader.
So starting out here, we’ve got shares of New York Times, Humana, a company we looked at last week, Horizon Pharmaceuticals, Adobe, and lastly DocuSign.
New York Times
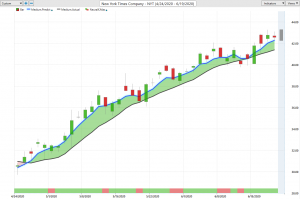
So starting out here with New York Times, really going to act as an example of how it really all of these forecasts work, regardless of the markets that you’re trading, but what we have here is daily price action. So each candle there represents a full and complete trading day with the high, the low and the close price, and right up against that price data, you’ll see that there is a black line and also a blue line.
Now we also, at the very bottom of the screen, you see, you have this green or red bar that changes everyday moving forward, and towards the right of the chart here, you also see a predicted high and low. That’s actually a predicted candle range for the next trading day and all of these work together to provide really the rounded out forecast as far as vantage points, predictive indicators here. So what we have here right up against that price data with the black and the blue line is, this black line that you see there that is a regular simple moving average.
A very common technical indicator, but one that certainly has some weaknesses, in that it only looks at past prices, meaning you just take the last 10 close prices, add them together, divide by 10 and that line gets dragged around by the most recent already occurring price action, and the other problem is that it only looks at the one market, right? It’s just looking at the past prices of New York Times, and what we understand about the global markets is that there’s very important influencers and drivers in other markets that can affect that market, that you’re trading in.
New York Times (NYT)
So in shares of New York Times here, we have that black and the blue line, but to generate this blue line, which is actually a predicted moving average, vantage point is performing what’s called Intermarket analysis. And so what that means is rather than just looking at past prices of New York Times, vantage point is looking at not only the past price in New York Times, but also things like different ETFs, like healthcare ETF markets, things like other individual stocks, other magazine and publications and media companies. It’s going to be looking at things like the futures, right?
The futures, as far as the S&P 500, the Russell, things like the VIX, things like global currencies, global interest rates. So there’s all these global markets that are known to drive an influence and affect future prices of the markets that you’re interacting with and trading, and what this is able to do is take all of that information, weigh those positive and negative relationships and actually generate future price. So you can think of that as predicted prices yet, so in the future that haven’t yet occurred. And what they’re able to do is take those predictions, actually build them into the value of these indicators, turning what a lagging indicator that’s just going to look at the past closes and summarize where that market’s already been into a forward-looking predictive tool.
So whenever we have that blue line or that predicted moving average cross above the actual moving average, it’s suggesting that average prices are going to start moving higher, based on those intermarket relationships and that forward-looking prediction. Now at the very bottom of the screen, you’ll see that there’s that bar that goes from green to red. This is also an indicator derived from those neural network intermarket relationships. However, this is tuned to only look ahead 48 hours. So it’s very short term, really just looking at the next couple of trading days, whether they’re short term strength or short term weakness in the market, and then at the very right hand side of the screen, an actual intraday guide.
So intraday predicted high and low for the next trading day. So you’re provided with that 6:00 PM the night before the market’s opened the next day at 9:30. So you have good levels to go ahead and get into the market, take profit, manage the position along the way. So we see here in shares of New York Times, we get this crossover to the upside and you’ll see how accurate these predicted highs and lows are.
So once you have identified the trend direction and say, “Okay, well, this is where I want to trade. This is where I want to be,” well go in there and have your orders waiting down at these predicted low levels, and you see that as often an excellent guide, as far as where one should look to go ahead and get involved in the market. In cases like this, where you see you come out of the range a little bit, you actually hit the next day’s predicted low, you’re going to get filled at the open there.
If you have those orders waiting and you see how very quickly this gets back on track and a very good guide over the course of this move, telling you where should you add to the position, where if you’re a short term trader, should you take some profit along the way, But of course, understanding that, “Look this market is still in an uptrend. If you’ve gotten a great entry, make sure that, as long as that blue line remains above the black line, you understand the trend is up and you can remain there.”
So this market up over 33% in just the last 34 trading days got a 500 share position, five option contracts, up in value over $5,000. This is just over really the past month of May here now going into June, so about a month and a half time here.
Humana
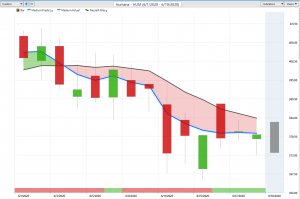
Now, here are shares of Humana, and we looked at this last week and it’s a very good example of how we can, can identify areas of weakness in the market and understand that, look over the past few weeks, it has not made sense to be along Humana. You see the blue line crossing below the black line, saying average prices are expected to move lower.
HUMANA (HUM)
You see when this neural index gets bullish, you do have some price action moving on the positive side of that predicted moving average, but the overall trend still very much down. And again, we can see that, “Okay, well, as a trader, where should you be coming in? How can you be using those intraday levels to make decisions? Well, obviously, if you’re going to be in this market short up at the predicted highs, target things like the predicted lows, and that’s going to keep you on track with where this market is moving.
So very clearly here, this market’s still in a downtrend, but other markets have been a little different. And we saw that dip last week in the broader futures markets, a lot of markets like Humana have moved into a downtrend, stayed there.
Horizon Pharma
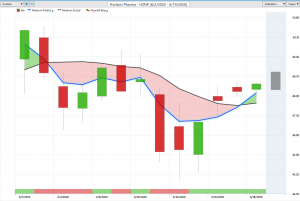
Well here’s shares of Horizon Pharma, and very similarly at the end of March, when a lot of stocks started moving higher, this market performed extremely well, but you see a couple of weeks ago, we got this crossover to the downside, and it’s a good thing because look. Four or five days later, you’re getting some aggressive moves lower as the S&P 500, the futures markets really start to move and drag a lot of stocks lower.
So certainly a short term trader wants to be aware that look, the overall trend here is now down, really from this point on, and I’ll go ahead and Mark it with the pen here. You want to go ahead and look to short at predicted highs or potentially take profit on your longs up at those levels, and you see what occurs here, right? You’re shorting the market up here, getting out of the way or selling right before this dip lower, but recently saying, look the market’s back in an uptrend, you’ve got a lot of strength from the neural index crossover, the upside, and potentially look to add back in that trade at predicted lows though, right.
Horizon Pharma (HZNP)
So using that guidance and just a pretty fantastic move here, where you see this market, as far as the move from March, moving up about 79, almost 80%. 500 shares has you up almost $11,000, but very quickly here realizing that, look it, you want to short up those levels, not a huge move to the downside, but very clearly you could come out couple of percent ahead or potentially just avoid the six and a half percent decline in the market prices that came through over that couple of week period there. So very interesting again, having these two healthcare stocks, one saying, “Look stay out of the way.” The other one saying, “A little bit more optimistic here,” and you certainly want to make sure you’re picking your spots based on where that strength or weaknesses.
Adobe
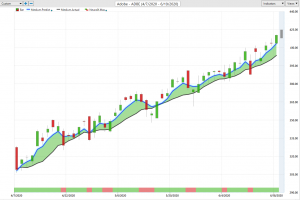
Here’s shares of Adobe, and another example of a really strong market that stayed in an uptrend. Here you see the past couple of weeks, very clearly in an uptrend there, right? Very little as far as again, that weakness coming in, but not dragging that blue line below the black line, and you see how quickly this market recovers and is finding some new highs. But what I really wanted to highlight as well in this market is some of these predicted highs and lows, and really one of the benefits of this tool, it’s very adaptive in that those forward-looking forecasts that are looking at those intermarket relationships, understand that, “Okay, well, on a day like this, where the market’s moved lower, well what’s going on here?”
ADOBE (ADBE)
“How can we go ahead and change those forecast to get things back on guidance, and get things to say, “Okay, well, how have things shifted in the market? What makes sense here going forward?” And you see that with that, look the trend’s still up, and if you want be a buyer, well come in down there a little bit below 400 here, and you actually see things like this. Whereas if you, you can deal with volatility over the next couple of trading days, you see that this is an example where, you gapped up and never traded towards this predicted low, and that’s what happened on this next trading day, right?
You came lower, you move towards that predicted low and literally the next trading day, you’re back up at that predicted high. So if you have orders waiting there, those come out profitable as well, as long as you remain in that long position, seeing as how the predictive trend is still to the upside, very clearly from that blue in the black line. So shares of Adobe here, since that turn up in the market in end of March, shares up about 29%. And again, very clear to see that, “Okay, well, if you want to trade here in Adobe, you want to be a buyer down at those predicted low levels.”
DocuSign
Lastly, here shares of DocuSign, and I think we looked at this a couple of times, with the virus and things like that going on. Obviously a lot of these work at home companies doing quite well, but of course, how do you want to trade this, if this is a market that you want to get involved in? Use that guidance from the vantage point, predicted highs and lows. So we can see again that moving forward, very nice forecast coming through here to get you a really great entry early on in the trend. But even as volatility picks up, you want that guidance to say, “Look, the overall trend has remained up and intact, but if you want to be a buyer in this market, intraday coming down at these predicted lows.” And every couple of days, you’re seeing something get filled down at those levels and the market finding new highs.
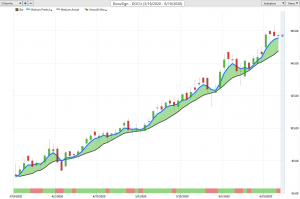
So a really fantastic opportunity here as far as shares of DocuSign. So when you can understand that, “Hey, here’s a place in the market. It makes sense to be. Stocks performing very well. It’s in an uptrend, but you want to have that short term guidance, so you can minimize the risk and how much you have to risk to get into a particular opportunity, but still capture that upside in that move, that’s potentially in the market here.
So you see shares up over 84%, just in the past 50 trading days. Again, a small position about 500 shares has you up to about $37,000. So whether you want to do that through the shares or the options market, obviously a nice opportunity to the upside there. Very clearly here since April, this is a place you want to belong. So once again, this has been our Hot Stocks Outlook for June 19th, 2020. Thank you all for watching. Best of luck and bye for now.


