


Hot Stocks Outlook for the Week of
June 21st, 2019
The Hot Stocks Outlook uses VantagePoint’s market forecasts that are up to 87.4% accurate to demonstrate how traders can improve their timing and direction. In this week’s video, VantagePoint Software reviews forecasts for SPDR S&P Metals and Mining ETF($XME), Commercial Metals($CMC), Nucor($NUE), Freeport-McMoRan Copper & Gold($FCX), Newmont Mining($NEM), Ruth’s Hospitality Group($RUTH), and Kohl’s($KSS).
This Week’s Hot Stocks Outlook
Good afternoon traders, and welcome back to the Hot Stocks Outlook for June 21, 2019. I hope you all are having an excellent week out there in the financial markets. And, as always, plenty of great opportunities to go ahead and cover.
We’re going to start out here and do things a little bit differently in this week’s Outlook, in that we’re going to take a look at the XME ETF here. We got the metal and mining ETF, and actually a lot of stocks within that ETF to really highlight an important point of how these intermarket relationships work and how the software here can really clue you into some good opportunities to take some positions in the market. Then we’ve got also Ruth Hospitality Group and also Kohl’s, so definitely, a lot to look at today.
SPDR S&P Metals and Mining ETF($XME)
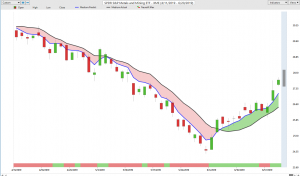
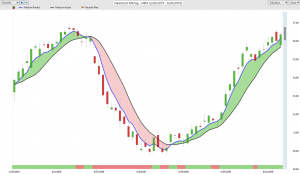
But I want to go ahead and start out here with the XME metals and mining ETF, which is really exposure to steel and aluminum, also gold, even a tiny little bit of coal there. So it’s a very diverse mix of different types of assets here. Regardless of which market you’re trading though, the vantage point indicators here all work the same. So whether you’re trading coals in the S&P or this metal and mining ETF, all the indicators you see against the chart here are all going to work the same regardless of the market.
But what we have here in XME is the daily price action. We can see going back really to the beginning of June and there’s a black line and a blue line against the chart there. Now the black line that you see, that is what you refer to as a regular or simple moving average. Now in the software here we refer to this as the actual simple moving average, but a very common technical indicator. It just plots previous prices, adds them all together and then divides by a number and only looking at the past close prices of XME.
But what we’re able to compare that value to is this blue line that you see on the chart. That is the predicted moving average. Now, for that value to be generated Vantage point is looking at not just XME but it’s looking at well, a lot of other steel and aluminum companies. It’s looking at ETF groups, it’s looking at the dollar index, it’s looking at metals futures markets. So it’s looking at all these diverse markets and using that information to develop future prices, so price information in the future that hasn’t yet occurred, and actually build that data and work it into this moving average, turning it into a forward looking predicted moving average.
Now in addition to that indicator against the chart, you also see this green a bar at the bottom of the screen. It can go from green to red and back to green. Also utilizing that predicted information to forecast very short term strength or weakness. So it’s only looking ahead 48 hours at a time. It can help guide you over short term strength or weakness in the market. And lastly, your given an intraday. So an intraday predicted high and predicted low ahead of each and every trading day. So you know not only where you want to get into the market, but where to go ahead and take those short term profits.
Now once that blue line or that predicted moving average is moving above the actual, it’s suggesting average prices are going to start moving higher. As a directional trader, you know, hey, it’s time to go long the market.
Now once you have that information that says okay, well you want to be long, you can use these daily predicted high and low levels. We actually see this shadow candle that you see here. Well, it will be filled in by an actual candlestick there. So we can see how accurate all of these have been going over the past price data.
But what I really just want to point out here is that you tend to see very similar conditions across similar markets. And right now we’re in a very unique market environment and there’s been very few places where I’d really want to go ahead and actually start taking long positions, this being one of them here in the XME ETF. And we’ll go ahead and take a look at all these correlations and how close these things look as far as if you develop a process here with VantagePoint, you can really identify these great opportunities in a lot of these steel, aluminum and gold market stocks over the past just 11 trading days. You see this market up over 10%.
Commercial Metals ($CMC)
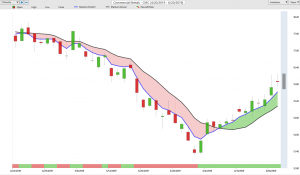
Let’s go ahead and move over to CMC though and you’ll see how similar these charts look and that they really send a lot of signals to you. So we actually have some software that can scan through these opportunities and identify these fresh crossovers and the start of a new trading opportunity. But here in commercial metals, new core, we’ll take a look at both of these really quickly as they’re going to be highly correlated here. But again saying okay, well look, if you want to go ahead and get long, focus on these markets and really look towards getting in certainly at the lower part of these predicted ranges, be a great time to take a position. And you see that 48-hour forecast just continually to the upside here.
Nucor($NUE)
So we’ve seen the markets do a good job recovering. But I’d be pretty cautious there has been being very selective on where you want to go ahead and try to exploit that strength in the market. Here are short shares of Nucor and a good example of how you get these opportunities where there’s going to be some volatility, but you see still a lot of separation between that blue and black line letting you know that look, the trend is still up. And of course, you can get that information from them, these other markets and see how strong some of these areas are.
So if we go ahead and look at CMC, it’s actually a good example of how the neural index here at the very bottom, it’ll indicate some short term strength or weakness in the market and you see that we certainly trade lower than the low here, but the trend is still very much to the upside. So if you can anticipate that weakness, understand to not have your stops tightened up to where you’re just going to get stopped out of the market, but be able to deal with that, expect this market to trade around this predicted average and certainly directionally stay on the right side of things.
Freeport-McMoRan Copper & Gold($FCX)
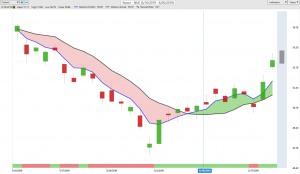
Now gold, we’ve seen moving pretty substantially higher here very recently. And again, you get these crossovers in these gold and silver mining ETFs, here this crossover to the upside. And go ahead and take a look again at those predicted low levels coming through, and we can see it how accurate these forecasts and predictions are, where if you can really deal with the volatility over a couple of trading days, you’re going to have a good opportunity to get that entry into the market. And then you get these intraday levels, which are good levels to go ahead and take profits.
So imagine if you set a limit order at this predicted high before the trading day, you get filled here and have the opportunity to buy back at much lower prices, again, taking some profit here, chances to buy back at lower prices and some really great opportunities just all throughout this sector.
Newmont Mining ($NEM)
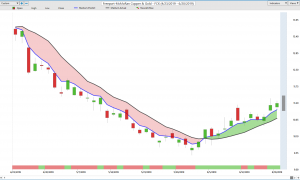
But I would be very cautious in some of the more traditional sorts of stock areas. We want to look for those areas where there’s a lot of correlation between things and you’re getting a very strong signal here in Newmont Mining, of course, I think we covered this a few weeks ago, but really great opportunities really over the past month here as gold has done well. Well, so are markets like this. So whether you have the exposure to trade in those actual futures commodities or you just want to get that exposure, well a great place to get that leveraged exposure is through stocks. And we’ve had some really great rallies really all throughout this area.
So again, I just want to highlight, we’ve had a lot of market volatility and there have been some few places where it’s like yeah, if you want to go ahead and get long, focus on these areas. And we’ve just had tremendous rallies and great entries to start getting involved at the right time so that you can trail stops and really not set new exposure to the market, the chance of actual fresh losses.
But then we have these other areas.
Ruth’s Hospitality Group($RUTH)
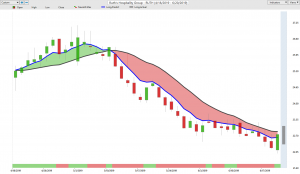
So Ruth Hospitality Group, this is actually a chain of restaurants and steak houses, exact opposite where we’ve seen over the past couple of weeks even where there’s strength in the market, this is not an area where you want to be getting long and actually an opportunity where you can add to your short positions. So again, using that guidance from these predicted high levels. And you see, in a bearish trend here, you’re going to get these kicks and rallies and moves higher in the market. But notice how quickly the market continually closes below that level. So you trade a little bit higher, but by the end of the closing day you’re back below those levels. So if you can deal with volatility really over a couple of trading days, I mean one two three four, five, six, seven, eight, nine, 10, 11, 12, 13 opportunities to go ahead and get short this market here, just adding in with profits all along the way there. So really nice move to the downside here in Ruth Hospitality.
There are some great areas in the market to go ahead and buy some put options, to buy some of that downside protection and possibly get long. Some of these other areas like the gold miners and the aluminum and steel sort of areas, good opportunities to get long trail those stops. 13% decline here in Ruth Hospitality Group.
Kohl’s($KSS)
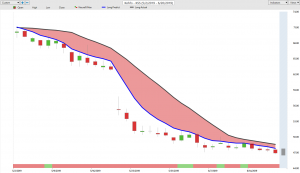
We’ll also go ahead and revisit Kohl’s and we see just over the past month here now things have not recovered. So if you’re still trading that market to the short side, which you would still be doing because the trend is still forecasted to move to the downside, well how would you want to manage that opportunity? Well, stay involved over that 33%, have sort of a core position on, but great opportunities day to day to come in and say okay, well where do I want to be adding to this position? Short some here, take some profit and just keep shorting and targeting these predicted low levels in the market. There are just plenty of opportunities, much similar to Ruth Hospitality Group here, plenty of opportunities along the way to be shorting the market, taking profits, adding to that position along the way, and really making money pretty much every week as this market continues lower and you see a tremendous amount of weakness from the neural index.
So you have these days where you get a little 48 hours of sideways strength, you move up towards these predicted highs, again going sideways here. But then you get all this weakness in the neural index, the great opportunity to go ahead and set those shorts and expect some lower prices there.
So really great opportunities here. Again, 33% decline here in some of these names here, in Kohl’s.
Ruth Hospitality also down 13, probably down 15% by now. And these other areas which traditionally haven’t done extremely well recently. I know that XME ETF’s trading at a low. Some of these markets have been really pushed lower. But great opportunities in this market volatility and say okay, here’s an area of some strength. Let’s focus in, use those predicted levels on a day to day basis and really guide that position forward. Really manage the position as it trades forward, whether you’re, again, on the long side, like commercial metals or XME here or on the short side, like Ruth Hospitality or Kohl’s here.
So just a great example of how these tools can work to help you be a better trader, make those better management decisions on a day to day basis, and keep improving that position as the market trades forward so you really adapt with the changing market conditions that we’re seeing and not get swept up and surprised by them.
So this has been our Hot Stocks Outlook for June 21, 2019. Thank you all for watching. Best of luck and bye for now.


