


Hot Stocks Outlook for the Week of
May 22, 2020
The Hot Stocks Outlook uses VantagePoint’s market forecasts that are up to 87.4% accurate, demonstrating how traders can improve their timing and direction. In this week’s video, VantagePoint Software reviews forecasts for American Axle (AXL), Boston Beer (SAM), Cincinnati Financial(CINF), iRobot(IRBT) and Matador Resources (MTDR)
Register for a Free Live Training
This Week’s Hot Stocks Outlook
Hello again, traders, and welcome back to the Hot Stocks Outlook for May 22nd, 2020. Hope you’re all having a excellent week out there in the financial markets and, as always, plenty of opportunities to cover in this week’s outlook. So, we’re going to start here with shares of American Axle, actually, revisit Boston Beer, we’ve looked at really a few times over the past couple months, Cincinnati Financial and opportunity from last week that we looked at, iRobot and lastly Matador Resources. An energy company as well, seeing a lot of those energy stocks and the commodity is actually performing quite well as well.
American Axle
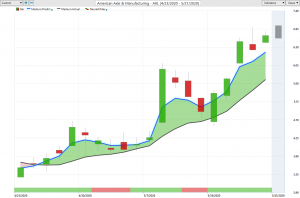
Here in American Axle & Manufacturing, what I want to really do is just highlight how the basics of these forecasts work. We see here that what we have here is daily bars and candles, so each one of these candles represents a full and complete trading day. Right up against that price data, you see that there’s a black line and also a blue line. Now, the black line that you see there, that is a regular, simple moving average or what we refer to as the actual simple moving average. How indicators like that work is that they look at the past 10 close prices, add all those close prices together, divide by 10, and it plots that line moving forward. Now, one of the problems with tools like that is that they’re really getting dragged around by previous price action, essentially things that have already occurred. As traders, we want to understand, okay, well, what’s going to happen next? Where are prices going tomorrow, not where have they been over the past 10 days?
So, what we want to actually do is compare that black value on the chart to this blue line that you see here. For that number to be generated, you can think of it as just a number or a value, but to generate that value, well, what’s happening? Well, in the case of specifically American Axle & Manufacturing, VantagePoint is looking it up to 30 to 35 markets that are known to influence and drive this target market moving forward. Now, that can involve individual stocks. That can involve ETFs that model a particular sector. That can involve commodities, things like crude oil prices or grains or gold prices. That can involve things like global currencies or global interest rates. It’s able to understand how those other market relationships affect and influence the future price of American Axle & Manufacturing.
American Axle and Manufacturing
And so, what happens is neural networks, a type of artificial intelligence, are understanding those relationships and actually generating predictions, so we can think of that as future predictions that have not yet occurred and using those values and incorporating them actually into the value of these indicators generated within VantagePoint. So rather than having a moving average that only looks at the past, this is actually utilizing those predictions based on those intermarket relationships and predicting future prices. What we have here is this, whenever this blue line, this medium predicted moving average, crosses above the actual moving average, it’s suggesting that average prices are going to start moving higher and you, therefore, would want to ahead and get long.
Now, in addition to that way of forecasting future prices, you’ll also see this indicator at the bottom of the screen. You see how we can go from green to a red. This is also utilizing that technology but tuned to only look ahead very short term. It’s really a 48-hour indicator, so looking really two candles ahead at a time. What it’s able to do is, again, forecast that very short-term strength or weakness. But, why that’s important is because if you’re getting long in the market and the overall trend is still up, meaning that blue line is still above the black line but the neural index goes bearish, you want to be prepared for that weakness, not only as an opportunity to stick with your position and understand, look, this is only a two-day forecast. It’s only looking ahead very short term, but also even to potentially add to your position in an existing uptrend.
Boston Beer
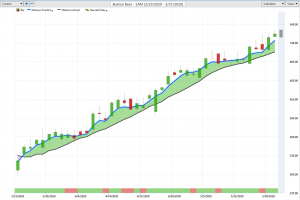
And so over the past couple of weeks, we looked at shares of things like Boston Beer and a very good example of we see that that blue line has remained above the black line. We’ve gotten a very significant trend here and you’ve got that neural index is going to help you along the way. I usually like to use the example of when that neural index goes bearish. You’re likely to see prices trade below that predicted moving average, right? You can trade above or below an average, but when that neural index gets bearish, you should probably expect some more weaker price action that’s going to take place below that level. But, we also are able to generate predicted highs and lows. Again, that technology of neural networks is now looking ahead. Rather than looking at the overall trend and looking at future average prices, rather than looking at the strength or weakness just over the next 48 hours, you also have a predicted high and a predicted low for really next day intraday levels.
Boston Beer
That can be really effective if you want to go ahead and set limit orders or set profit targets on the top end if you’re going long in the market. We can see actually how accurate all of those predictions have been. We’ve done this a couple of times here with Boston Beer where we had this market go into an uptrend. You see that just consistently, if you have limit orders waiting down at those predicted lows, understanding, look, the trend is up. Should we get down to these levels? I want to be a buyer and start participating on the bullish side. You’re not going to hit that level every day. You see periods of time like this where you run sideways. You don’t hit it on a few of these days, but if you have those orders waiting, you’re actually getting in a really good level over the next few days and that overall trend continues.
So, a really great opportunity here in Sam Adams and this market has just kept going higher and higher and higher. But, where you can really increase your overall really P&L and really make a lot of money is by doing that trade management and understanding that look, the market’s in an uptrend. I can take my existing gains from accumulating profit over the trend. And then, take extra shots at the market right at these predicted lows with those profits and really benefit as that trend continues.
Cincinnati Financial
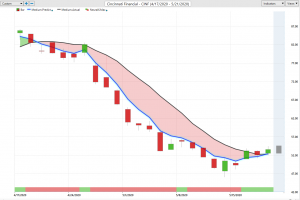
Just last week, we looked at Cincinnati Financial and we have still seen a mixed market. There are markets that are really not performing all that well and there’s a lot of volatility out there. Cincinnati Financial is one of these areas that we highlighted to the downside. As you see this opportunity with that fresh crossover to the downside, we can look at those predicted high and low ranges. You see you get a really nice entry if you’re coming in and ready to go ahead and short this market as shares go lower here, right? But, what’s interesting is over the past week, when we look at those forecasts, well, that’s changed here. Very clearly, Cincinnati Financial has been forecasted to move higher over the short term and here just saying, “Look, the trend is now up. If you had been short over this period, you don’t want to be shorting the market anymore. You actually want to go ahead and get long here.”
Cincinnati Financial
It just goes to show how it’s really about having an adaptive approach to trading and understanding that you may have a view about a particular market or where things are going to move, but VantagePoint is doing this analysis on each one of these individual stocks. What’s happening is for each target market, a very unique set of intermarkets is provided to understand how those intermarkets specifically affect the market that you’re trying to trade. That way, you can apply this forecast and this trading approach to whatever market you’re trading, knowing that it’s really doing a lot of the heavy lifting behind the scenes and understanding again how those global market relationships are going to play into what it is that you’re doing.
iRobot
iRobot
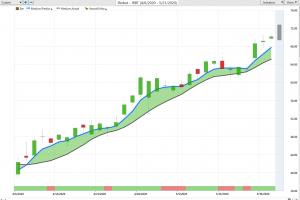
Lastly here, we have iRobot and I’m going to go to Matador, another good example of how this technology can be very effective. But here, iRobot crossover to the upside, really strong uptrend here. But again, you can use those predicted high and low levels. That’s really where trade management can really be taken to another level as far as taking profit along the way but adding at very opportunistic levels here as that overall trend continues. You see that you’re getting four levels here where you’re hitting the predicted low before that trend makes another leg up and moves higher, so a really nice opportunity as far as iRobot shares. But really, what I wanted to highlight here is a company like Matador Resources here. Here, you see a 56% rally here in shares of iRobot. Very clear, if you’re trading the market like this, all you want to do, go ahead and get long.
Matador Resources
But, here’s Matador Resources and this is a energy oil company, right? We’ve seen energy’s actually recover quite well, but it’s taken a while for things to really get going. Seeing some of those 5%, 6% or even 8%, 10% moves in the future’s market in the commodity oil, well, that’s a part of those intermarket relationships, right? So if you’ve got an energy company, obviously it shares some very strong correlations with the commodity itself. That’s what this is able to do is look at energy ETFs, look at other competing oil stocks, look at the commodity, look at the currencies, look at the interest rates, and understand what’s likely to occur next. But, what’s also extremely effective about this is that it is an adaptive technology so that every day is new data comes in, new close prices happen all over the world in all of these different areas. It’s able to say, “Okay, how have things shifted? How can we change that overall forecast?”
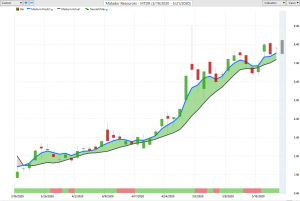
Matador Resources
Over the course of this move, some of this energy stuff has moved up tremendously here. This market up just under 300%, about 279.77%. That’s 41 trading days, but you can see very clearly that a stock like this has been very strongly in an uptrend. If you’re coming in and saying, “Okay, well, utilizing levels like the predicted low,” and that gets very, very important when you’re trading cheaper stocks. You see this was down at $2 per share, now it’s up towards $8 per share. But when you’re trading that, look how the range starts to expand and you get that explosion to the upside. But, look how these predicted highs and lows, these ranges start to expand and say, “Look, if you want to keep trading this, that’s fine, but just understand that there’s going to be more volatility. You don’t want to have stopped sitting up inside those predicted high and low ranges at all.” That’s really where you should be taking action, right? Buying at these predicted lows, taking profit at the predicted highs, and really making the most of that particular opportunity or trend that you get involved in.
Once again here, just a really nice rally. You’ve seen a lot of these energy service companies perform quite well. Where you get those stronger predictions, that a lot of separation between the blue and the black line and very clear forecast that something’s going on in energy, well, that’s what’s going on behind the scenes of VantagePoint is it’s looking at what’s going on in the global oil market, what’s going on in heating oil or natural gas, and how it specifically affects that target market that you may be looking to trade.
Once again, this has been our Hot Stocks Outlook for May 22nd, 2020. Thank you all for watching. Best of luck and bye for now.


