


Hot Stocks Outlook for the Week of May 24th, 2019
The Hot Stocks Outlook uses VantagePoint market forecasts that are up to 87.4% accurate to demonstrate how traders can improve their timing and direction. In this week’s video, we analyze forecasts for Haliburton ($HAL), Gamestop ($GME), Home Depot ($HD), Kohl’s ($KSS) and Qualcomm ($QCOM).
This Week’s Hot Stocks Outlook
Good afternoon traders and welcome back to the Hot Stocks Outlook for May 24th, 2019. Hope you’re all having a great week in the financial markets, and as always a lot to cover. We’re going to start out here with Halliburton. We’ve got GameStop, Home Depot, Kohl’s, and also Qualcomm, so some energies here, a little bit of retail and also some tech, and some very important things going on. We’re gonna go ahead and touch on the energy space here with Halliburton, which we actually looked at this a few weeks ago and previously for several weeks as energy seems to be making a complete reversal here. What we have here in Halliburton shares are the daily price action. We can see going back really to the mid point of about April, where is really where we started to see a lot of market weakness come into some shares, but you want to be real selective in where you play that.
Haliburton ($HAL)
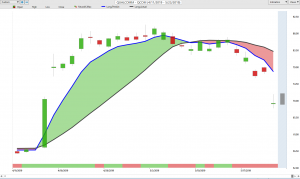
Now, here in Halliburton, against those daily bars, you see that there is a black line and also a blue line against the price data. What that black line that you see on the chart is, that is a regular or simple moving average, so a very common technical indicator, we refer to it as the actual simple moving average. What that is is a good barometer of where prices have been. But of course, as a trader, we need to know where prices are going to move next. What we want to compare that value to is this blue line that you see against the chart, and for that value to be generated, vantage point is performing a very sophisticated type of analysis called Intermarket analysis and using the technology of neural networks and artificial intelligence to do it. When forecasting the future price of Halliburton and energy stock, well, it’s looking at things like crude oil, it’s looking at ETF groups, it’s looking at individual stocks that share an important correlation to Halliburton. Also things like currencies.
This is very, very important to understand and get that valuable information from other markets to determine where are prices likely to move. Once that blue line crosses below the black line, it signals that the trend is likely to start moving lower, average prices are expected to move lower than actual prices or predicted average prices are expected to move lower than the actual prices, and therefore you’d want to go ahead and get short. But that’s not the end of the forecast here. We also have this extremely accurate 48 hour indicator where you see every day it updates, and it’ll be red here, you see you get a green day here, some green here. But what this is is just a simple short term strength or weakness in the market over the next 48 hours or really two trading days. And that can help you know when to expect some short term market weakness, but also a great time to re-add into a short position, in this case here in Halliburton.
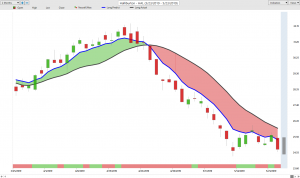
And lastly, to really round out what we would refer to as really the vantage point forecast, really all of these tools working together, is you get a predicted high and a predicted low generated before each and every trading day. As long as that blue line remains, in this case below the black line, you’d want to be taking short positions and you’d want to look towards things like the predicted highs and target as you’re a very short term day trader, target the predicted lows. But as long as that blue line remains below the black line, the trend is still to the downside. What have we seen here? Not only stocks and equities, but the energy’s certainly accelerating to the downside. And so this is why week after week I’ve been coming in and saying, “Look, you gotta hedge your portfolio, take advantage of these big market relationships that are going to take hold of things like Halliburton or Chesapeake energy or all these things that we’ve looked at over the past few weeks.”
The market’s down over 21% or $6 and 66, little ominous sign there, dollars per share and things moving drastically lower here. I mean, easily, I mean a $30 stock, you buy a thousand shares, you’re up six, seven grand, even more than that, as things really accelerate to the downside and we’re seeing a lot of equity weakness. So again, through really the month of April and especially here in May, we see a lot of weakness in the marketplace and you want to find good places to go ahead and play that weakness.
Gamestop ($GME)
So again, through really the month of April and especially here in May, we see a lot of weakness in the marketplace and you want to find good places to go ahead and play that weakness. Well, here in shares of GameStop, you see the blue line handedly below that black line for the duration running all the way, really, a couple of months of time here. But it’s really about how these forecasts adapt and change moving forward with the help of those predicted levels. When I go ahead and bring up the predicted levels, what you’re looking at is what was the prediction compared to the actual market data.
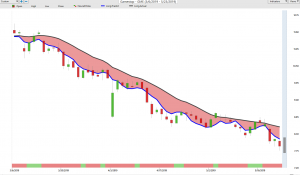
Then we’ll have this candle will generate and you’ll see those predicted highs and lows remain where they’re at. And you can just see how accurate these forecasts are over the longterm to help traders understand that… Yeah, intraday. All right, well look towards these predicted high levels, expect a little bit of strength and a bounce here, but the trend is still very much to the downside and within a couple of days you see moving drastically lower. Again, great level over the few days there to get short, you want to get short at those predicted high levels ideally. Great level there, great level here, right here, right here, right here, right there and there. And just as this trend moves lower, you’ve got excellent entries to the downside. Again, as long as that blue line is still suggesting that look, average prices are below the actual moving average, the prediction using that future data from… That’s generated via those intermarket relationships is telling you it’s time to go ahead and get short.
The Home Depot ($HD)
Especially when we see these correlations take place of a lot of markets at the same time, like we saw with energies, and we’re seeing in a lot of shares of the equity markets, marker’s down 31%. I mean, so much opportunity not only to make that 32% decline there, but also intraday. Some great levels to add to your position strategically and really turn this into more than a 31% move. Moving forward to shares of Home Depot and some more of this retail space. Very clearly here, going into this month of May, not a good time to be long Home Depot. You see similar action on things like lows, and just these retailers in general. What’s happened is the trade talks and things have act as a catalyst, but you want to stick with these forecasts. I mean, looking back over all the different things that have happened in the market, these indicators are still upwards of 80% accurate in relation to the neural index, over 80% accurate, and that’s going to guide you forward as you look to make trading decisions in the market.
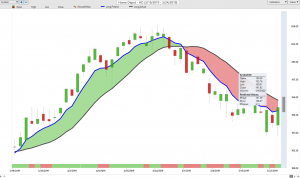
Just like every other opportunity here, what are we looking for? Well, you’re looking to use those predicted levels from the predicted highs and lows to really say, “Okay, well where should I be looking to actually take short positions so I can minimize my exposure to the market, but still get involved in an opportunity?” And again, as long as that blue line is remaining and also a thing that’s very helpful is looking at the spread and the separation, shows you the difference between that prediction of where average prices are expected to move and where they’ve been. The wider that level, the stronger the trend. Therefore you want to go ahead and, again, adjust that position as the market trades forward. Really nice opportunities to, again, trail stops with this volatility coming in, things are moving lower and lower. You’re seeing a lot of more volatility in the equity indexes and just down about 7% so far, but $14 per share and still moving lower. As you see that blue line still handedly below the black line.
Kohl’s ($KSS)
Shares at Kohl’s here really getting smacked. I believe [inaudible 00:07:18] earnings and a catalyst here that really caused these things to jump off a cliff. But, going into the month, again, you see a lot of these retail stocks, just like the energies before them, showing that look, these things are starting to reverse, you don’t want to belong here. And if anything you can get great entries short the market and then deal with that volatility that’s gonna come through earnings and make a lot of money or you can get stopped out at break even should you just lock in your stops or trail them with the market.
But, it’s how you want to go ahead and minimize your risk and exposure to the market, and a great tool like vantage point is going to help you understand how things are changing day to day, so you can not necessarily just get short, let’s say 500 shares, maybe you want to be short a thousand shares at some time. Maybe you want to be short only a couple hundred when you get near a predicted low. That’s what’s going to help you understand how to adjust that position in relation to what’s expected and likely to occur. So, market down 23% over 16, almost $17 per share, and this is not too expensive [inaudible 00:00:08:17]. $70 per share, but down $17. Really exciting move. Again, you buy not a huge position there, but you’re going to be up 25% on your money in just really the month here, 14 trading days, not even a three weeks of time as far as the market day to day is concerned.
Qualcomm($QCOM)
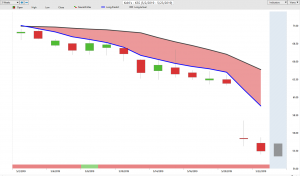
Lastly here, Qualcomm, and we’ve seen a lot of things like the… XLK, I believe is the technology ETF, things like NVIDIA, Intel, really get damaged here and really moving much lower. But you see shares of Qualcomm here at the beginning of the month of May saying, “Look, if you want to go ahead and trade these stocks, you’ve gotta be trading it to the short side. And if you want to then manage that position moving forward, well, short at predicted high levels, that’s where you’re going to get those good opportunities.” There’s plenty of these times in the market where the market’s going to trade up and you gotta be shorting on those up days. The S&P was like that. I mean, you really wanted to be shorting when the jobs report came out, stocks went straight up on a Friday and then just completely started collapsing from there, but that was the great time to go ahead and get short.
Here in Qualcomm, down 19% in just nine trading days, $16 per share. There are some really fantastic trading opportunities. We’ve been highlighting this market weakness over the last few weeks and why you want to hedge your portfolio because you see how quickly your long positions are going to get completely wiped away and be in the negative. Whereas focusing on the short side of the market and where these opportunities are opening up, so you can make a considerable amount of money very quickly here as the markets decline very rapidly. This has been our hot stocks outlook for May 24th, 2019. Best of luck to all you traders out there in the markets. Thank you all for watching. Thanks again and bye for now.


