


Hot Stocks Outlook for the Week of
May 29, 2020
The Hot Stocks Outlook uses VantagePoint’s market forecasts that are up to 87.4% accurate, demonstrating how traders can improve their timing and direction. In this week’s video, VantagePoint Software reviews forecasts for New York Times (NYT), Boston Beer (SAM), eBay (EBAY), Horizon Pharma (HZNP) and OraSure Technology (OSUR)
Register for a Free Live Training
This Week’s Hot Stocks Outlook
Hello again traders, and welcome back to the Hot Stocks Outlook for May 29, 2020. Hope you’re all having an excellent week out in the financial markets, and as always plenty to cover in this week’s outlook. So we had a lot of popular companies here. We’re going to start out with New York Times. We got Boston Beer Sam, we’ve really followed that since really end of March, when stocks move higher. We also have E-Bay, Horizon Pharma and also OraSure Technology.
New York Times
New York Times
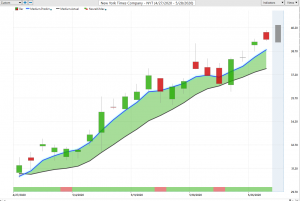
Starting out here with New York Times though, what we have here is daily price action. And it’s a really good example here of how this software works on the end day data basis. So each one of these candles represents a full and complete trading day. And you’ll notice that there’s a couple of indicators right up against the price data, that black line, and also the blue line. Now the black line that you see against the chart, that is a regular, simple moving average or what we refer to as the actual simple moving average.
And that’s a really good measure of where market prices has been, right? It’s what it does is it takes the last 10 close prices, adds those altogether and then divides that number by 10. And it’s a good rolling level of where average prices have been. But of course, as traders, we need to understand, well, where are prices going moving forward so that we can get ahead of that move. So what we want to actually do is use that black line, but actually compare it to the value of this blue line that you see against the chart as well. And for that blue line to be calculated each and every trading day and be updated, what vantage point is doing here is what’s called intermarket analysis and specifically utilizing the technology of artificial neural networks to do that. So what that means is rather than just looking at the past close prices of, in this case the target market New York times, what Vantage Point’s able to do is look at other related markets.
Now this can be different ETF groups that track the sector. This can be individual stocks. This can be things like the S&P 500, global currencies, global futures and commodity markets or interest rates. And it knows specifically which markets are known to have what can be a positive correlation or inverse correlation to this target market New York times, and understand how those relationships actually affect future price. So with all of that calculation done, we actually generate future price prediction. So actually data that hasn’t yet occurred yet into the future and build it into the value of these indicators. And they’re tuned to be forward looking and accurate as possible. So what you have is a forward looking predicted, moving average that lets you know, okay, well where are prices moving next and really react to the move faster. So you see, once we have that blue line in this case cross above the black line, it’s suggesting average prices are going to start moving higher than where they’ve been or essentially that the market trend is now to the upside.
Now, in addition to that predicted moving average, you’ll see at the bottom of your screen, you see you have this indicator go from green to red, back to red, back to green. Well, this is also derived via that neural network process, but much shorter term indicator. And so what it’s focusing on is really just the next 48 hours of trading or what you really think of as really two candles or two trading days ahead and forecasting short term strength or weakness in the market. And this can help you prepare for the days ahead. Understanding, Hey, if the trend is up, but there’s a possible dip coming, I should go ahead and try to get cheaper prices, potentially add to my position at those better prices. So what we have here is we see this blue line crossing above the black line and really to round out the entirety of these forecasts, that you have the overall trend, short term strength or weakness, you see at the very right hand side of the screen, you have a predicted high and predicted lowest shadow candle here that actually updates each and every trading day.
So we can actually look back and see how accurate each one of those predictions have been. And after tonight’s forecast, what will happen is you’ll have that predicted high predicted low, and the actual trading day candle will fill that space and we’ll be able to see how accurate. But if I go ahead and flip over to those predicted highs and lows, you can see once you determine the overall trend direction and then understand on that intraday basis. Well, where do I want to be coming in as a buyer? Where do I want to set those limit orders and where this is really helpful is being a end of day trader and understanding that, okay, well, let’s wait for all of that market data to come in Vantage Point will calculate those Intermarket relationships and forecast what’s likely to occur over the next trading day.
So you have all of this information, 6:00 PM Eastern time, the night before the next trading day. So you see here New York Times Corporation up about 25%. This market’s been forecasted in uptrend for quite a while here, but more importantly for those shorter term traders to understand is, look, you’ve got a really good roadmap here of understanding where you should be setting limit orders, where you should be taking action and also where to potentially take some profit on the upside, assuming you’re adding your position or maybe your shorter term buying at the lower end and taking some profit as the market moves higher. So really nice move there about a 25% rally higher.
Boston Beer
Boston Beer
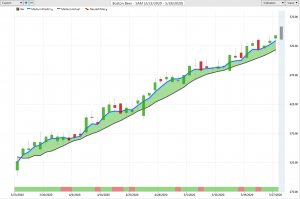
But when I want to highlight here is Boston Beer and this has been a market we’ve looked at, I keep bringing it in really to highlight how accurate these forecasts work at really adjusting to changing market conditions. So it’s not about just getting into the market here, but understanding, okay, well, where can I add to my position? Is the trend still up? And I should therefore hold that overall position here. And we see with Boston Beer that blue wine has stayed very solidly above the black line. But if we look over the past couple of weeks and see, all right, well now with new data coming in over the past couple of weeks, how accurate have those predicted highs and lows been on Boston Beer? Well, just as accurate as they were a month ago. And understanding, look, you want to come in at these predicted lows and you see that you get a better part of the range there before the market eventually wants to take another leg up and move higher, just like it did back here. And when you understand that, Hey, there’s a trend reversal, let’s go and get involved. You really want to make sure that you get that best price possible. So you don’t have to risk as much to get involved with a nice trending move here.
So Sam Adams here obviously been a really nice opportunity here in the market overall. Shares up pretty considerably up 55% just in the past 44 trading days. So, just over the past couple of weeks, I’ll probably get about 10-15% more. But again, having that guidance to say, okay, well, if I’m going to stick with this trade, I’ve made all of these profits, well, should I be taking profit or buying more shares with those profits and making more money as the market continues to trend?
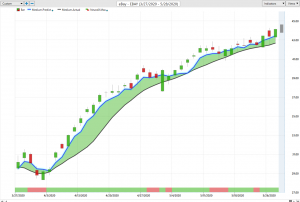
And so what I want to highlight here is also that this period in March is really where we saw a lot of stocks turn higher. So if we come over here to eBay and understand that, okay, well stocks broadly have had a trend reversal here. You get a lot of these crossovers coming through are actually in Telescan feature during March letting you know that look, stocks are starting to move higher, look to go ahead and take a position and pretty much the same move as Boston Beer. And this is where things get very correlated in certain markets. We’ve seen the S&P do really well really since the end of March here. And so you’ll see again, these predicted low levels acting as that guide to say, okay, well, if you want to come in and be a buyer in the market, where do you want to have those orders waiting to get a really nice fill on that continued move to the upside? So in eBay here, again, a really nice opportunity, but this is one of these markets that hasn’t reversed the downside. And this has been really important so that you hold out and capture that full 46%.
And when the time comes that that blue line crosses below the black line, you’ll understand, look, the trend is over, go ahead and take your profits and move onto something else. And actually we can skip Horizon here for a second, but that’s where things like Orasure Technologies come in and understanding that, over the past couple of weeks, actually, quite a few markets have turned lower and you want to understand, well, where’s that strength in the market? Well, we know it’s in Boston Beer and E-bay and New York Times Corporation.
OraSure Technologies
So those markets are forecasted in uptrend, but here Orasure, over the past couple of weeks, crossover to the downside and a tremendous amount of weakness here from your neural index. And what I like to really highlight here is often when that neural index goes, bullish or bearish, depending on which direction the trend is, you’ll get the market trading the next trading day above, in this case, above that predicted moving average, right?

Orasure Technologies
You have the overall trend direction that forward-looking predicted moving average, but you can trade above or below it. And this also lets you know, when to short above that level or possibly be a buyer below that level. But again, we can bring up these predicted high and low ranges and really see that, look very clearly the market is in a solid downtrend here. Market’s off about 18% just in the past seven trading days. So you really want to understand those areas where you can remain long, add to your position like Boston Beer, but also where you should really take short positions, possibly hedge your long positions, or just take profit. And assuming may have been long from the period in March where stocks rallied, but now not a good time, you’ll lose 18% by sticking around in a market like OraSure.
Horizon Pharma
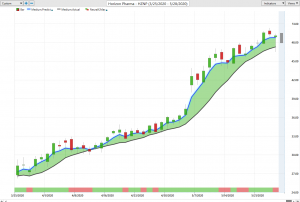
Lastly here, Horizon Pharma, very similar situation again to Boston Beer, eBay, we see all of these markets turned up, but of course we want to understand where is that strength persistent, right? Where should we hold on to that market? Where over the past couple of weeks where some markets have turned lower, where should we continue to trade that market to the upside? And we can again, look at the full ranges here. We’re looking back all the way, now two full months of calendar time here and seeing how this software is adjusting each and every day to pinpoint these predicted high and low ranges so that you have good guidance coming in over that next trading day. And even if you’re not getting into the market here, you get that continually updated forecast that lets you know, okay, well, if you want to come in and participate in a particular market where should you be looking to get involved and you see even days like this, you get a lot of volatility, but look where that market closes, right?
Horizon Pharma
It pushes below the predicted low, but that close coming in, actually above the predicted low inside the range and giving you a really good measure of, okay, well as a end of day trader coming in, where should I look and expect prices to move around? And so again, really nice opportunity here, Horizon Pharma up 73%.
eBay
But here being a biotech stock, but seeing things like eBay, Boston Beer up 50% just over the past couple months, and it’s really highlighted some of these tremendous opportunities to go ahead and get long. But of course, you want to be careful out there. You want to hedge your portfolio, find areas to go short as well. And this is where the guidance from really these inner market relationships and these forward looking predictions can really help you get the better pieces of the market and not get out of a trend too early, which we see things like Boston Beer. Every week we come in and say, look, the trend is still up, don’t go ahead and get out of the market. If anything, it’s a good opportunity to add at those predicted low levels that are coming through. So a 58% rally here just over the past 44 trading days.
EBAY
So once again, this has been our Hot Stocks Outlook for May 29th, 2020. Thank you all for watching best of luck out there and bye for now.


