


Hot Stocks Outlook for the Week of November 1, 2019
The Hot Stocks Outlook uses VantagePoint’s market forecasts that are up to 87.4% accurate, demonstrating how traders can improve their timing and direction. In this week’s video, VantagePoint Software reviews forecasts for Fortune Brands Home & Security (FBHS), United Healthcare (UNH)
United Therapeutics (UTHR), and Roku (ROKU)
Register for a Free Live Training!
This Week’s Hot Stocks Outlook
Good afternoon traders and welcome back to the Hot Stocks Outlook for November 1st, 2019. Hope y’all are having a excellent week out in the financial markets and there’s always plenty to cover in this week’s Hot Stocks Outlook.
Fortune Brands Home & Security (FBHS)
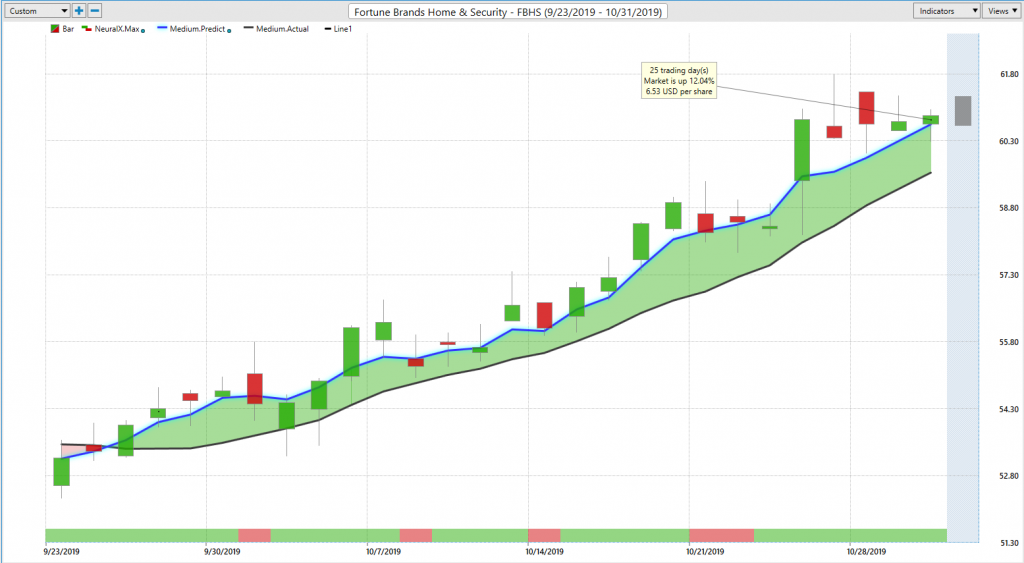
So, we’re going to go ahead and start out here. We’ve got Fortune Brands Home & Security. A lot going on in the healthcare and biotech space, as well as shares of Roku, which we’ll go ahead and take a look at. But starting here with Fortune Brands Home and Security, a good example of how all of these forecasts work really regardless of the market that you’re trading. So, what we have here are daily candles, so each one of these days represents a full and complete trading day, and right up against that price data, you’ll notice there’s a black line and also a blue line on the chart. Now, the black line that you see there, that is a regular simple moving average, we refer to it as the actual simple moving average, and that’s an extremely common technical indicator.
Really, all it does is plot previous closed prices, add them together, divide by a particular number, but the real weakness of indicators like that is that they only look at past prices, and they really only have the ability to look at the one target market here. So, essentially they’re going to be dragged around by the price data in the existing market that you’re looking at. Now, right up against that black line though, you see that there’s also a blue value, and for that blue line to be calculated, Vantage Point is performing a very sophisticated type of analysis called Intermarket analysis because we know markets are driven by other related markets. Now, when we’re looking at something like fortune brands and an individual stock, that can be things like ETF groups, that can be individual stocks, that can be global currencies, the global indices, S&P 500, interest rates.
So all of these markets affect the trades that you’re taking and the markets that you’re trading. And what this software is able to do is analyze those Intermarket relationships, and actually use that data to generate future prices. Now, those future prices that haven’t yet occurred are built into the value of this indicator. Thus turning a lagging indicator that only gets dragged around by past prices into a forward-looking indicator. And so, this is called the predicted moving average, and it’s letting us know where our average prices expected to move going forward because as traders, we need to be ahead of the market. So, once that blue value crosses above the black line, that looks, the overall trend is up, expect average prices to start moving up as long as that blue value remains above the lagging actual moving average, you’re essentially in an uptrend.
Now, in addition to that predictive indicator, there’s a couple of other tools that really round out the entirety of this forecast to help you manage your trades day today. Now, one of the most important being this indicator at the very bottom of your chart, you see that it can go from a green to a red back to green. And what’s important to understand is that this is a very short term indicator in that it’s only looking ahead 48 hours at a time. So, you can think of it as looking ahead a couple of candles, and letting you know if there’s strength or weakness over the next couple of trading days. Very important if you’re long in the market, and have a directional bias to the bullish side.
Well, when you see weakness coming in, that’s often a good opportunity to look to actually add to your position. And so, to really round out these daily forecasts, and these short term forecasts. Every single day, you’re provided with a new predicted high and low value, which you see at the very right-hand corner of the chart that hasn’t yet occurred, so that you know where to place limit orders, where to look to take profit, and really make the most out of the trading opportunity.
So we can see in this example, this is going back all the way back to September 25th, and we can see that, that’s when the trends started, but more importantly, how’d you manage that trade as the market moves forward? Well, we can see that the trend is up. You’d really only want to be taking long positions. You see when that neural index goes down to zero, expect that weakness over the next 48 hours. And look at how these predicted lows, let you know, “Hey, look to add to your position down at these predicted levels, and make sure you don’t have stops up in this area, and then get kicked out of the existing uptrend here.”
So you see that a really easy way that I like to think about this is whenever that neural index goes bearish, and I have a very accurate view of the predicted moving average of where prices are expected to go, I should just expect prices to move below that predicted moving average, and that can be a good opportunity to go ahead and add to your position and you do exactly that. Start the trade back here, but add to that position along the way and really make the most of that move higher. So you see really just tremendous move higher in the market here. The market’s up over 12 on the stat. 13.5% from where those crossovers came through, but you see just multiple opportunities along the way to add to that position at a very strategic intraday level as those days click on buy.
United Healthcare (UNH)
Now, next year, we’ve had a lot going on in the healthcare and biotech space, so last week we looked at PBLI, a much cheaper stock, but had a tremendous move. Here in United Healthcare crossover to the upside neural index up at a one. And you see what happens here that now this neural index, it goes down to a zero or a red configuration, and look how the market starts to run sideways, but that doesn’t change the bigger picture here. That blue line is still well above the black line, and you want to remain long in the position. You see as the trend continues in the neural index as it gets to the bullish side, again, this market really moves into an uptrend, and you see some faster acceleration over those periods. But again, we can look at those predicted highs and lows, and understand that as a trader you’re looking at these levels and really salivating at these levels.
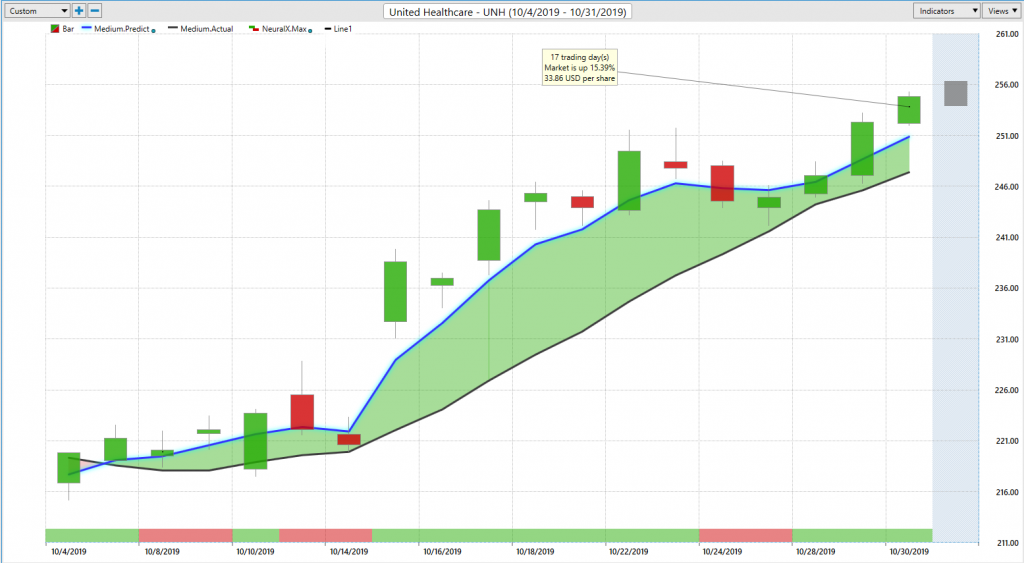
So, if you have a limit order waiting at this day here, you actually get filled at the open down here, and you’re good to go. You see, you get a little volatility as the market breaks out and things expand. But look how quickly these predicted lows get back on track and say, “Okay look, if you’re doing your trade management, want to add to the position, take profits along the way.” You see, there’s six entries here just in the past couple of weeks, and the market then continues to break out a bit higher. So, really tremendous moves specifically in this space and specifically it was October 4th. You see this where these crossovers start to come through. You see this on October 7th, this whole week really saw a bunch of tremendous opportunities specifically in that biotech space, and very possible you’ve got an entry. Down here, 17% move to the upside just over the past 15 trading days. That’s literally three weeks a time. Market’s up almost 20%, and you can trail your stop participate on the upside.
United Therapeutics (UTHR)
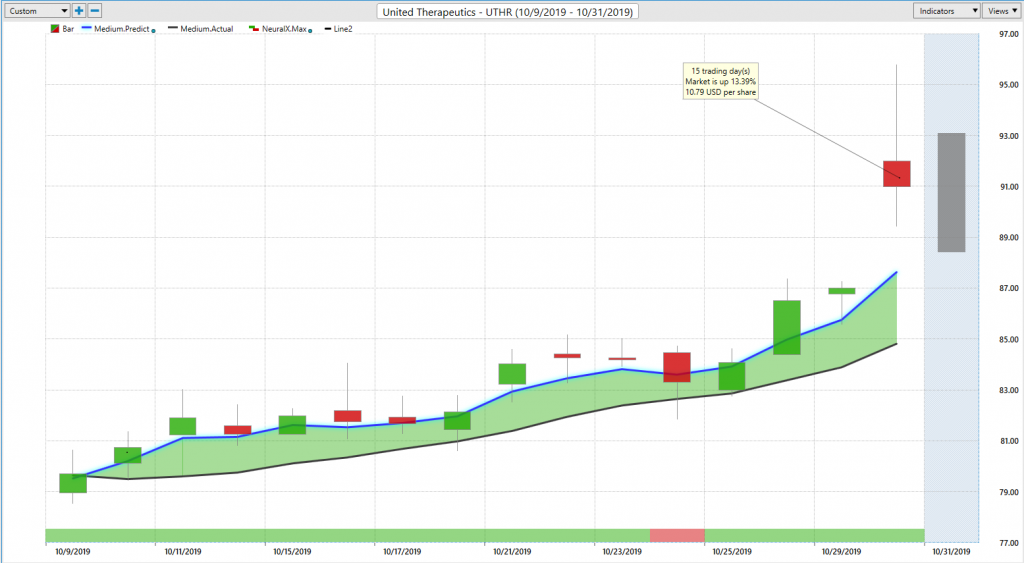
United Therapeutics, another example of the same time period where what we’re able to do is actually scan for fresh crossovers from the software. So, whenever we have this predicted moving average crossing above the actual moving average, we’re actually presented with that every single night and can see where these opportunities are opening up. Here are very clearly, you see this market moves into an uptrend. You run a little bit sideways here but look at this predicted low right in here. Obviously the trend starts back here and multiple areas whereas an intraday trader, if you’re looking to take profit at the predicted highs, great opportunity for those shorter term, but the trend is up, and certainly you don’t want to miss that breakout as things really start to accelerate to the upside here, so tremendous move.
We are seeing a lot of earnings reports and things like that, really accelerating things, you know to the upside, but here we have again, another 15% rally just in the fast 15 trading days. So it’s just multiple stocks here within that. Again, the biotech, pharmaceuticals, healthcare area, a lot of opportunities coming through at that first week of October, and made sense. Look, if you want to get long and benefit from the S&P strength that we’ve seen, that’s the place to go ahead and do it.
Roku (ROKU)
Here’s shares of Roku. Again, at the beginning of October here. This had a huge decline, a great opportunity to short the market, but very clearly saying, “Look, October is not the time to be short. And if anything, what do we want to do?” Well, the trend is up, look towards those predicted levels each and every day from vantage point to say, “Okay, where can I add to this position?” You see the range really expands here. You move a little bit past the predicted low, but look how quickly these levels get back on track. And you have multiple days here. You can add your position, make the most out of these opportunities, but at no point did we ever see this trend cross to the downside here.
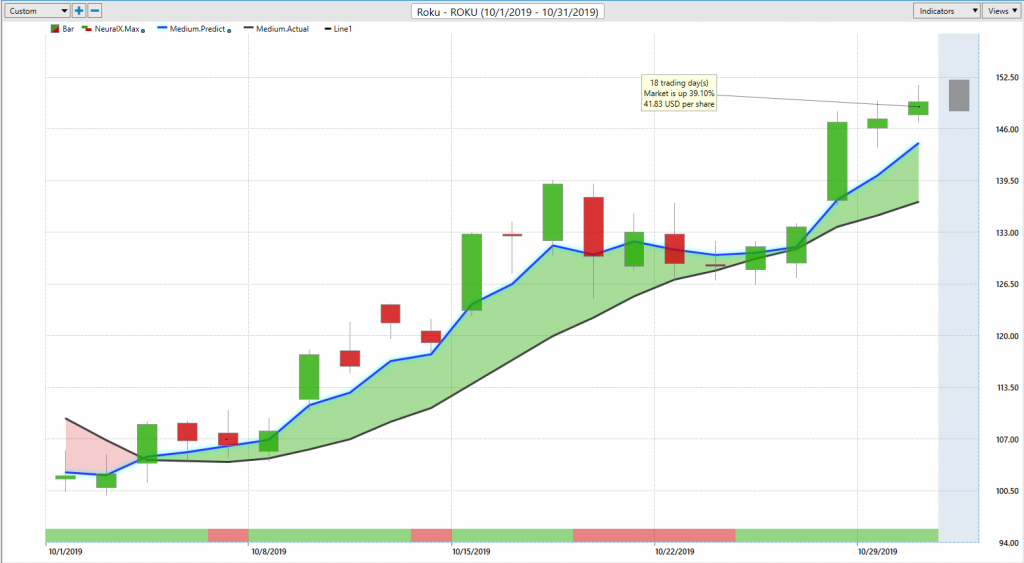
So you see that you just got a lot of separation between that blue and the black line saying, ‘Look, until you get across this trend is still up.” And as a trend trader, you want to maintain that position. And so just another opportunity here, the market’s up 39% in 19 trading days. So again, a great opportunity to show, but very clearly the software coming in and saying, “Look, get out of those shorts, reverse your position, look to go long. The market’s up 40% in just the past month here.”
So, what’s really great about this, like I mentioned, is that we can scan for fresh crossovers every single night. So, when we see all of these opportunities start to roll through, it makes it very clear of what sectors are rotating, where the opportunities are. And therefore, what we can do here is actually open up this Intelliscan here. So, I can open this up and really show you how all this works. We can show our markets, show our IntelliScan area. Actually let me bring up our indicators here. And what I can do here is actually dragging all of my US stocks into my IntelliScan area.
We can drag all of these stocks right into our scanning field. And one of the things that I really like is the ability to take this category. So, when I talk about watching these sectors start to rotate, and understanding where those opportunities and certain moves are coming through. Well, we’ve actually seen a lot of weakness in some of the higher-yielding real estate stocks, as well as utilities. And what this allows you to do is say, “Okay, well maybe I want to go ahead and hedge my portfolio, look for opportunities to maybe even short the market,” and you can actually set all of these predictive indicators to auto sort and find those opportunities for you. So you see here, we’ve gone ahead and just set all of our conditions to down.
We’ve got the trading range, all of our predictive trend indicators pointing to the downside. And all you need to do is go ahead and open up these charts and say, “Okay, well, where’s this opportunity? How should I go ahead and play this?” You get a very clear forecast here. You got a fresh crossover to the downside. Neural index at a zero. You’ve got your predicted levels coming through and you understand, “Okay. Well, if this is an area I want to trade, how should I go ahead and approach that opportunity?”
And really the beauty here is again, is as long as those trends continue, as long as that blue line remains above the black line, you really know what to do. And over these periods where your neural index may get weak, you understand that, “Okay. Well, you may experience some weakness over the subsequent 48 hour periods, but don’t just completely change your trading approach and, and you know your intentions getting into this market.” And you see, as long as the trend remains up, you get a nice acceleration, and 40% move to the upside.
So, really tremendous opportunities really happening all the time in the market. So, whether it’s to the bullish trader or bearish trader, it’s easy to find how these sectors are rotating, and where to really focus your attention. And especially on certain nights, you just see that an entire sector starts to rotate. You get that benefit of the S&P also moving to the upside. And it makes it very clear where you want to go ahead and take those shots in the marketplace. So once again, this has been our Hot Stocks Outlook for November 1st, 2019. Thank you all for watching. Best of luck and bye for now.


