


Hot Stocks Outlook for the Week of November 8, 2019
The Hot Stocks Outlook uses VantagePoint’s market forecasts that are up to 87.4% accurate, demonstrating how traders can improve their timing and direction. In this week’s video, VantagePoint Software reviews forecasts for S&P 500 (SP), TG Therapeutics (TGXT)
Humana (HUM), and Xerox (XRX)
Register for a Free Live Training!
This Week’s Hot Stocks Outlook
Hello, again traders and welcome back to the Hot Stocks Outlook for November 8th, 2019. I hope you all are having an excellent week out in the financial markets and there’s always plenty to cover in this week’s outlook. So we’re going to do things a little bit differently today.
S&P 500 (SP)
We’re going to start actually taking a look at the S&P 500 futures and I just want to explain and highlight how you can identify other related markets, and actually with the help of our Intelliscan feature, really see a lot of markets start to turn up at the same time. And that really helps you focus on individual sectors. So I know we’ve sort of pinpointed out biotech, healthcare stocks and we’ve got a couple more of those today, but you see so many of these opportunities coming through at the same time and it makes it very easy for a trader to understand that something’s going on, not just in this stock, I want to trade, but broadly across the marketplace.
So we actually see here going back really to the midpoint of October, we have the S&P 500 futures and a very clean break and crossover to the upside between this black line and the blue line. Now the black line that you see here on the chart, that is a simple moving average or what we refer to as the actual simple moving average. And that’s a very common technical indicator in that it only looks at past prices and it only looks at the one marketing question. So it’s always going to be a lagging indicator and let us know where prices have been over a given period of time. But of course, as traders, we want to know, okay, well where are prices moving going forward?
And so what we want to do is actually look at that wine and that level in relation to this blue value that’s generated via the technology found within VantagePoint, that being specifically neural networks, a type of artificial intelligence. And what they’re doing, when they’re creating these forecast and these predicted levels coming from these indicators is it’s actually looking at 35 other markets that are known to drive and influence the S&P 500. So that’s going to be things like global indices. There’s a huge equity correlation that happens all across the globe. If the Japanese stock market’s up, the US stock market’s up, things like the Dollar Index, things like interest rates and individual stocks, ETF groups, that all share very important correlations with the S&P 500, and there are valuable data and clues to be derived from those Intermarket relationships.
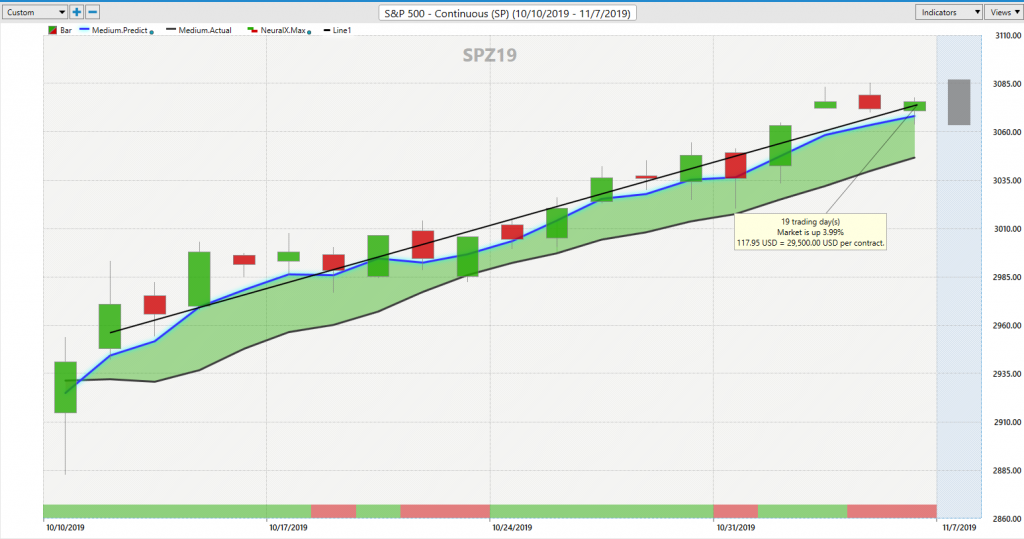
And so that process is actually used to generate future prices. So prices that have not yet occurred over the next couple of trading days, and it builds those values into these indicators, turning them from lagging indicators that just chase around the market, to forward-looking predictive indicators that are forecasting where prices are expected to go next with a high level of accuracy.
So in the S&P where we see we get this very clean crossover to the upside, a lot of strength is coming from these bottom indicators. Let me go ahead and explain this. Again, the technology can be tuned to really generate a particular type of indicator. So with the predicted moving averages, it’s forecasting the future average price moving forward, whereas the predicted neural index that you see at the bottom of the screen, it can be a bullish, it can move to bearish, but it’s very short term and it’s only looking ahead 48 hours at a time and letting you know about very short term strength or weakness. But of course, if I know I want to belong to a market, and there’s weakness over the next couple of days, well it’s likely a buying opportunity. So you can use that information to know where there’s likely to be some weakness and volatility. And capitalize on that and really manage a longer-term opportunity quite effectively.
So you see here with the S&P, obviously, we get these crossovers around October 11th, it was even before that where the biotech and the healthcare really started to turn up. But you see how effective these predicted levels are. And really to round out the entirety of the forecast, and we’ll see this with the subsequent charts, is we’re also provided a predicted high and low trading range. So you also understand every day that’s clicked by here over the past month on the S&P, well Intraday, where do you want to be adding to positions? Where is that S&P reaching the bottom level of its range? You see how effective all of these levels are and that can help you with your stock trading or just your direct trading of the S&P 500, and you see we’ve gotten a very nice rally moving to all-time highs. And what has that effected? Well, that’s obvious, you’re going to see stocks moving higher.
TG Therapeutics (TGTX)
And so if we look at these opportunities again, we really identified, okay healthcare, biotech, there’s something going on there, as we see all these crossovers coming through it, really the beginning of October, all through October, the S&P moving higher signaling, look, if you’re going to get a position on the market, get long and specifically focus on these particular areas where your scan is yielding a lot of results through those moving average predicted crossovers. And so you see here that on October 14th, we get this clean crossover to the upside neural index up at a one. You’ll get these periods where I like to really say, okay, well when you get that neural index bearish, as you see it gets bearish a couple of times, expect there to be that short term intraday, likely moves below the average. So if we have a predicted average and it’s fairly accurate, we should trade above it, we should at times trade below it and that neural index will let you know, hey, over the next couple of days, expect a little softness and some weakness, but that’s a great time to then use those predicted levels, those predicted highs and lows, again generated and tuned via that neural network training to identify intraday level.
So you have tools that are looking at the overall average, 48-hour forecast as well as picking out highs and lows for the next trading day. And while nothing’s going to be exactly perfect here, you see how close you’re getting to these predicted lows, it’s clearly indicating where do you want to have some orders waiting and ready to go. And very clearly you don’t have to take on as much risk because you’re getting a much better price. And also this all works off of the end of day data. So you know when you’re looking to add your position, you have your order waiting and resting. There’s none of this manual chasing down the market, looking at one-minute candles and all that. You have an order waiting, you let the market trade, let the next day click through and update your forecast in how you want to manage the particular opportunity you’re involved in.
So huge, huge opportunity here. Really all throughout this space. I know we like PBLI, United Healthcare last week. This thing’s up 43% just this month. And it was very clear via those in Intelliscan seeing all these crossovers moving to the upside. A lot of strength via the S&P and the other related markets and it was very clear, you don’t want to be short here if you’re taking on new positions for October, you’re getting long and making a lot of money.
Humana (HUM)
Here in Humana, obviously very similar to United Health, but look at this forecast, clearly crossover to the upside. Neural index strongly here to one. You see when it dips down, you get that little bit of weakness below the average, but clearly, clearly very strong forecast here signaling that look, October, you want to go ahead and get long and as far as when to start that opportunity, really this first week of October, right before really the midpoint of October, you’re running your scans and just seeing crossovers after crossovers moving to the upside and saying, look, pay attention to these opportunities. If we go ahead again, bring up those intraday predicted levels, you’ve got orders waiting to go ahead and snag up your shares at excellent intraday prices.
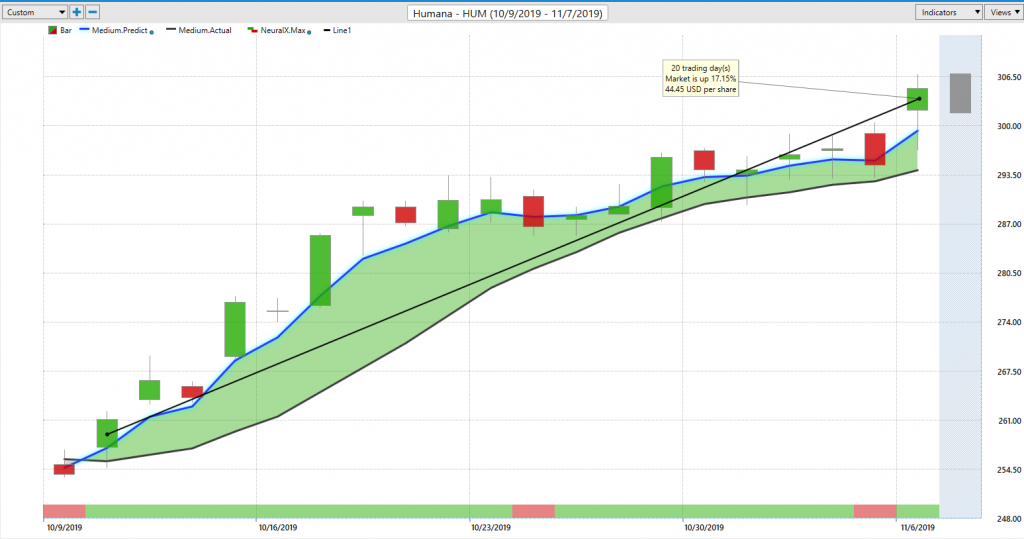
And regardless of your trading style, maybe you’re a day trader, maybe you’re shorter term, maybe you’re a swing or position trader, it’s going to work exactly the same way and saying, okay, well where do you want to be long? How do you want to manage that position intraday? How do you add to your position? Take some profits along the way. This is Humana and got insurance companies up 18%, so you don’t want to have to chase the, penny stocks and high-flying things, there’s tremendous opportunities happening all throughout the markets, but you’ve got to get that timing down and have a tool that’s going to help you not only get this 18% but of course possibly adding to that position at very opportunistic levels along the way here.
Xerox (XRX)
Here shares of Xerox crossover to the upside again. You’re running your scans and just this beginning point of October is clearly signaling there’s an opportunity and it’s to the bullish side of the market. Shares of Xerox here cross over to the upside. You see that again, neural index goes bearish, you’ll get this weakness over the subsequent days, but you do not want to be short here. And again, you can go ahead and bring in those predicted levels, I love how these tools work where you get this neural index, you get that little bit of weakness pulling back a little bit, but you’ve got this roadmap that’s updated every single day at 6:00 PM the night before the trading day to let you know that okay, we’re a little soft going in here, let’s let this market come down to these levels before we go ahead and get re-engaged and re-involved, obviously multiple levels before this thing really pops and move into the upside.
So again, it’s multiple sectors all throughout the market. We’ve been highlighting the Intelliscan feature over the last couple of weeks and I really don’t actually want to do that today because what’s happening is all of these markets are in strong existing uptrends. So you’re not going to get fresh crossovers coming through the software and you really understand the sort of market environment you’re in as you do this scan day after day after day, and have a running record of what is the market currently doing? Where are these trends taking us? How far into these trends have we already been in? And you see this market’s up 28%. so when you recognize these opportunities early, you see all throughout the marketplace, just tremendous opportunities to make significant returns on your account in just 28% move here in Xerox, there are 18 trading days here, this is pretty phenomenal stuff.
Zion BanCorp. (ZION)
Here’s Zion BanCorp, very similar. A lot of the financials are actually very, very strong with very similar crossovers. You know, when those big correlations start to grab the markets, and when we talk about inner market analysis, this is it. The S&P is moving higher, it’s dragging all these different sectors higher. It’s driving the global equities higher. All of these markets are related.
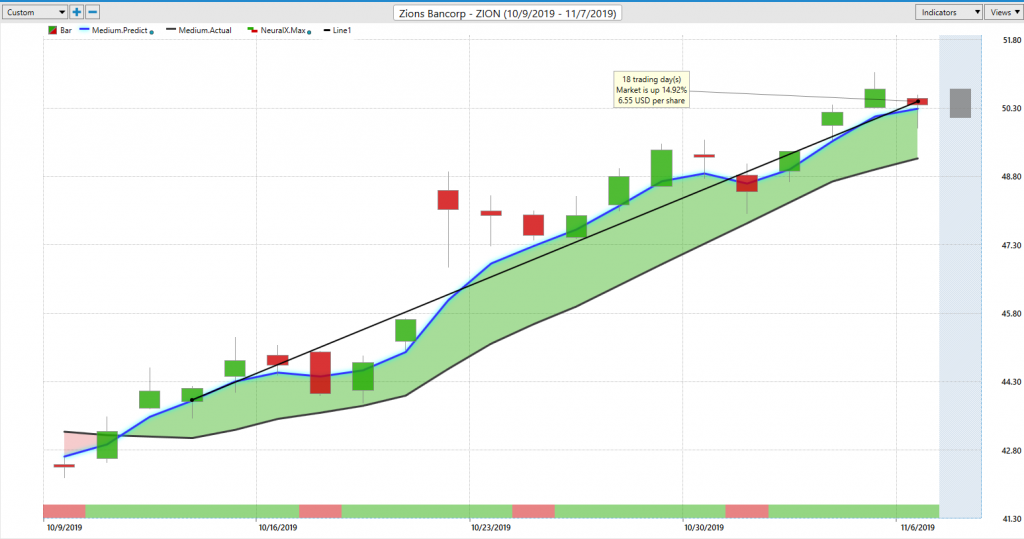
And when you have a tool that’s weighing those Intermarket relationships so you’re not eyeballing charts and chasing things around and trying to come up with correlations that might not be there, VantagePoint is handling this in a very sophisticated way to keep you doing the right thing at the right time. And you see again, Zion here crossover to the upside. You see again neural index, you get that weakness, you’re going to get those lower lows setting in over those 48 hour periods. But clearly, clearly tons of separation between our prediction of the average and the actual signaling very, very strong trend. Just see just the distance between these levels. No way on earth you could possibly be shorting. And a very clear clue is coming in that’s saying, look, if you’re getting long, plenty of opportunities coming through really, at the beginning of October. You see this market up 15%. these are very significant moves that over the past month, very easy to go ahead and take positions and obviously your trailing stops doing quite well on these opportunities here.
So once again, this has been our Hot Stocks Outlook for November 8th, 2019. Thank you all for watching. Best of luck and bye for now.


