


Hot Stocks Outlook for the Week of
October 18, 2019
The Hot Stocks Outlook uses VantagePoint’s market forecasts that are up to 87.4% accurate, demonstrating how traders can improve their timing and direction. In this week’s video, VantagePoint Software reviews forecasts for Lennar(LEN), Roku(ROKU), NiSource(NI), Fortunate Brands Home & Security(FBHS), and Nordic American Tankers(NAT).
Register for a Free Live Training!
This Week’s Hot Stocks Outlook
Good afternoon traders and welcome back to the hot stocks outlook for October 18th, 2019. Hope you all are having an excellent week out in the financial markets and as always plenty to cover in this week’s outlook. So we’re going to start out with shares of Lennar. We’ve also got Roku up here. We’ve got Nice Source the utility stocks, Fortune Brands home security, and lastly, we’ll end off on Nordic American Tanker here.
Lennar(LEN)
So starting here with shares of Lennar what we have here and what we’ll have on all these subsequent forecasts is daily bars and candles. So, each one of these candles represents a full and complete trading day and right up against all that price data you see that there is a black line and also a blue line. Now the black line that you see on the chart that is what we refer to as the actual simple moving average. So, all it really does is take the last closed prices, adds them all together, divide by that number, very common technical indicator and a really good barometer of where prices have been over a given period of time. But of course as traders we want to understand, “Okay, well where are prices headed moving forward?”
And so, what we want to do is actually compare that black value to this blue value that you also see against that price data and for this blue value to be calculated generating what’s called the VantagePoint predicted moving average. VantagePoint is performing what’s called intermarket analysis so it’s not just looking at the past prices of shares of Lennar it’s actually looking at other ETF groups like Home Builder ETFs, other related homebuilding stocks, things like the dollar index interest rates. And it’s looking at up to 30 to 35 other markets to identify how all of those other markets influence, drive, and effect, in this case, the target market shares of Lennar moving forward.
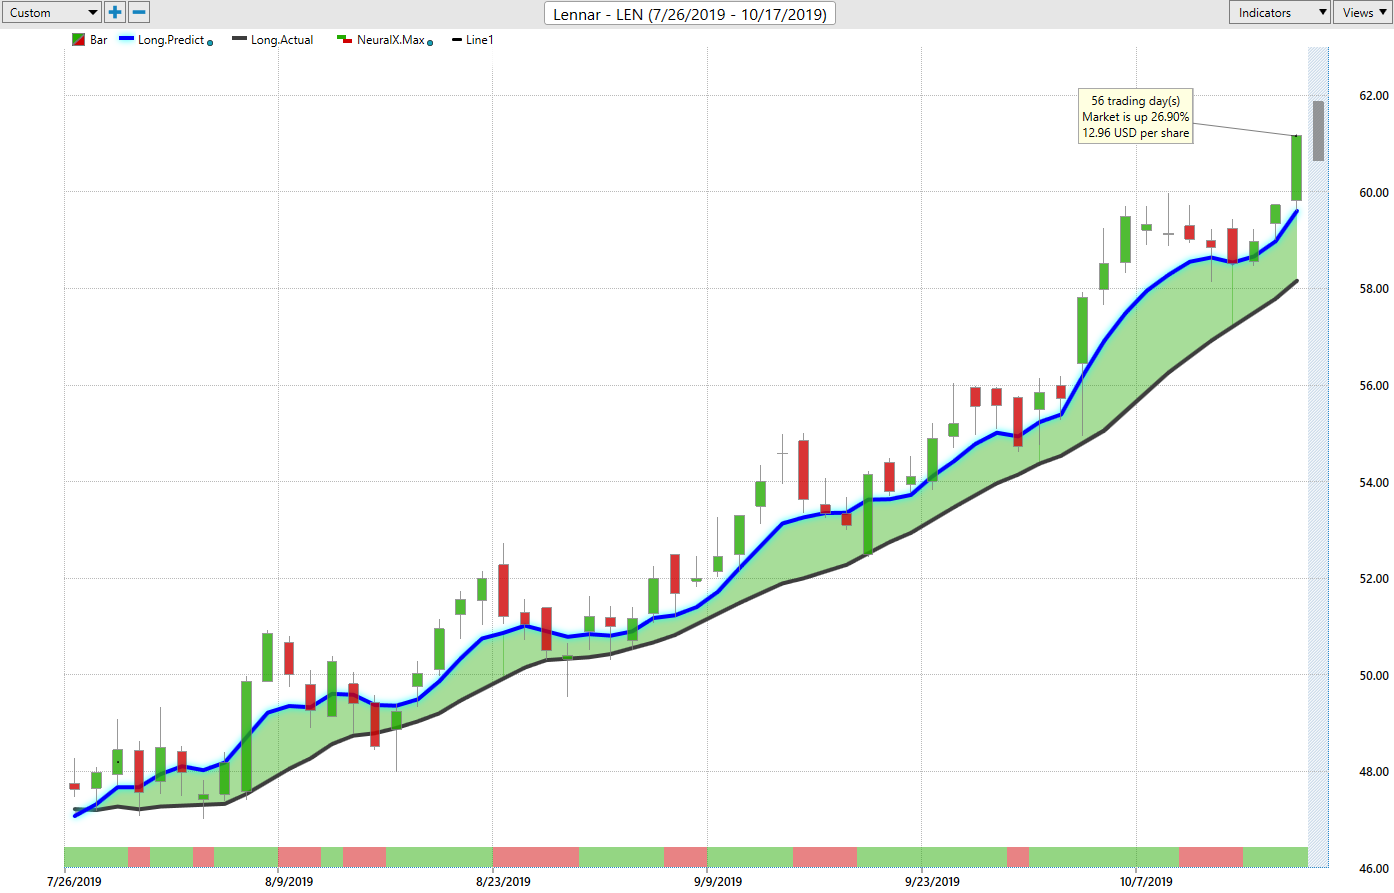
And it actually utilizes all of that data from all those related markets to generate future data so candles in the future that haven’t yet occurred yet. It actually builds those future predictions into the value of this moving average changing it from a lagging indicator into a forward-looking moving indicator. Because of course, we want to understand where are average prices moving forward going next over the next couple of trading days and how should that affect my overall trading. So here we see in Lennar we have that blue line crossed above the black line here at the beginning of September but we have a couple of other indicators on the chart here which will help us with our overall trading.
Now at the very bottom of the chart you see that there’s a green line that it goes from a green to a red back to a green. This is a highly accurate 48-hour indicator so it’s only looking ahead 48 hours or you can think of it as two candles at a time strength or weakness in the marketplace. But as far as the blue line, as long as that blue line remains over the black line, the trend is still up. And really to round out the entirety of this forecast of trend, short term strength, or weakness, you’re also given a predicted high and low range. So, before each and every trading day all of these predicted highs and lows, your neural index for short term strength or weakness, the new value of your predicted moving average, those are all generated for you 6:00 P.M. the night before the next trading day.
So, we see that as long as that blue line remains above the black line we then have that guidance that says, “Okay, well if we’re looking to get long well where do we want to look on an intraday level to actually take a long position?” And you can see that over the course of this trade as the trend moves higher we have very early on in the trade here a great entry around $52 but multiple entries along the way. Whereas a trader you can be using your profits to add to your position and really make the most of each of those opportunities not only getting involved but also knowing when to cut your profits, move on to something else and manage that trade.
So, you see overall this market’s up about 19% but you had four or five different entries along the way where you immediately move higher towards the next days predicted high and you see a two, three percent move over a couple of trading days there. So, a really nice opportunity here. Home Builders is doing extremely well. Just moving straight up and you see that these daily levels that you’re getting from these predicted highs and lows doing a good job to let you know, “Okay, well where do you want to come in, get a really great price?”
Roku(ROKU)
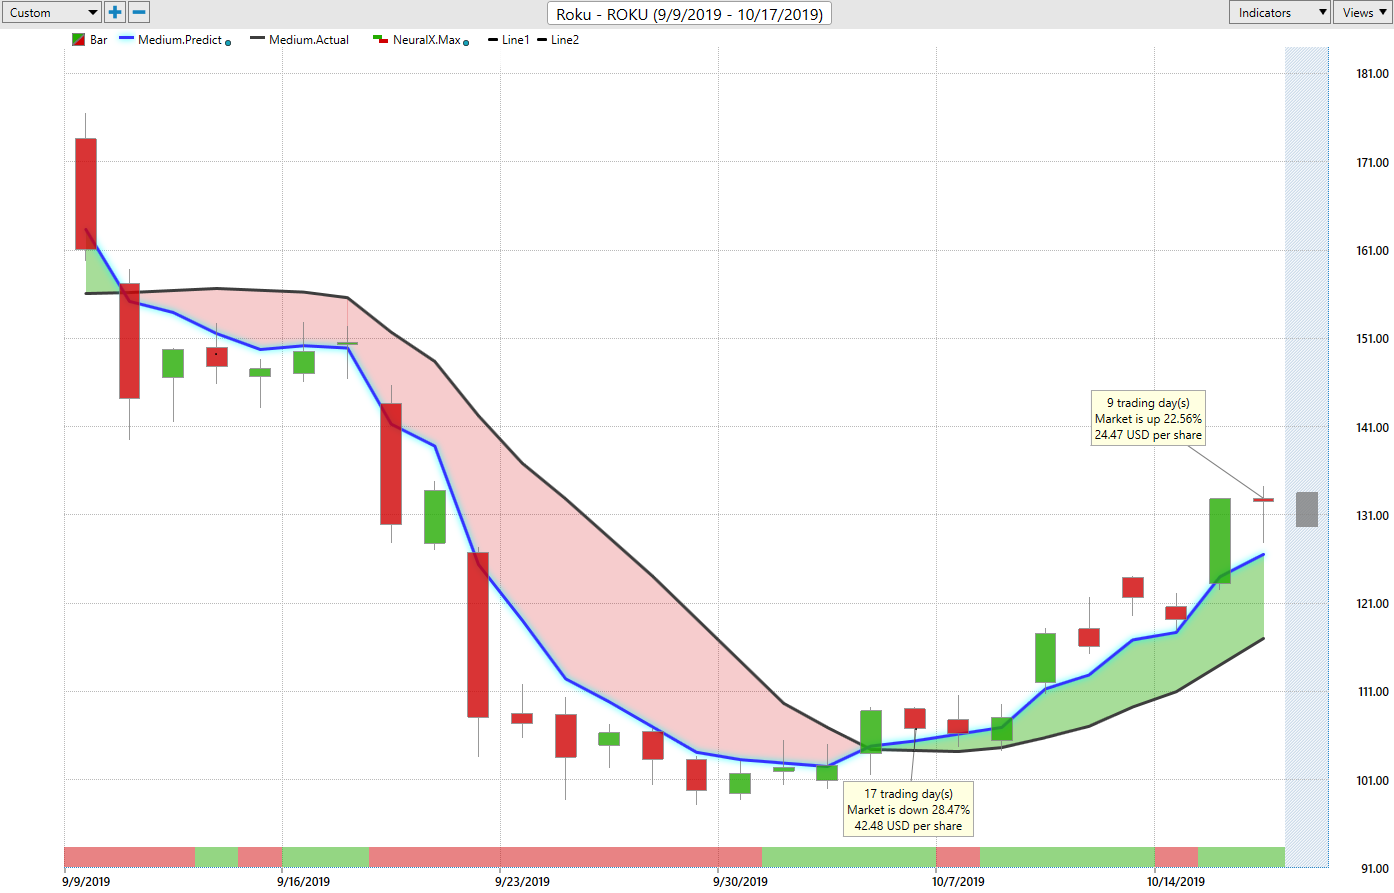
Shares of Roku here you see more recently getting this crossover to the upside, neural index up at a one, and the exact same approach that you want to use. Understanding that “Okay, well if I understand that the trend is now up, I want to get long, let me use the guidance from those predicted levels that are generated before each and every trading day.” And you see that for the past couple of weeks here very clearly the forecasts have been saying, “Look, if you want to buy Roku great opportunity here. Here’s another intraday level. Here’s another one.” But intraday okay well let’s get a good average price for the next couple of days here, let’s understand the overall trend direction, but also not get shaken out of the trade just because there’s some short term weakness possibly in the market over the next couple of trading days. As long as that predicted moving average says average prices are moving up you see you have a lot of separation between those two values and just a significant move here in shares of Roku but really all across the market.
The past week we’ve had a lot of strength here, market up over 25% in shares of Roku.
NiSource(NI)
Utilities have been soft though. And when we’ve seen again all of these forecasts we actually have a scanning feature called the VantagePoint and Intelliscan which we can scan every single evening and look for fresh crossovers so one-day old crosses that have just occurred to identify new trading opportunities. So each and every night and all these forecasts you’ve had these crossovers come through you can make sure that the neural index is in agreement. But what that lets you know is hey there’s a new opportunity going with the help of your tools on this really intraday basis and understand, “Okay, well if I’m going to get involved in this market or this trade in particular where do I want to be adding to my position? Where do I want to be getting involved?”
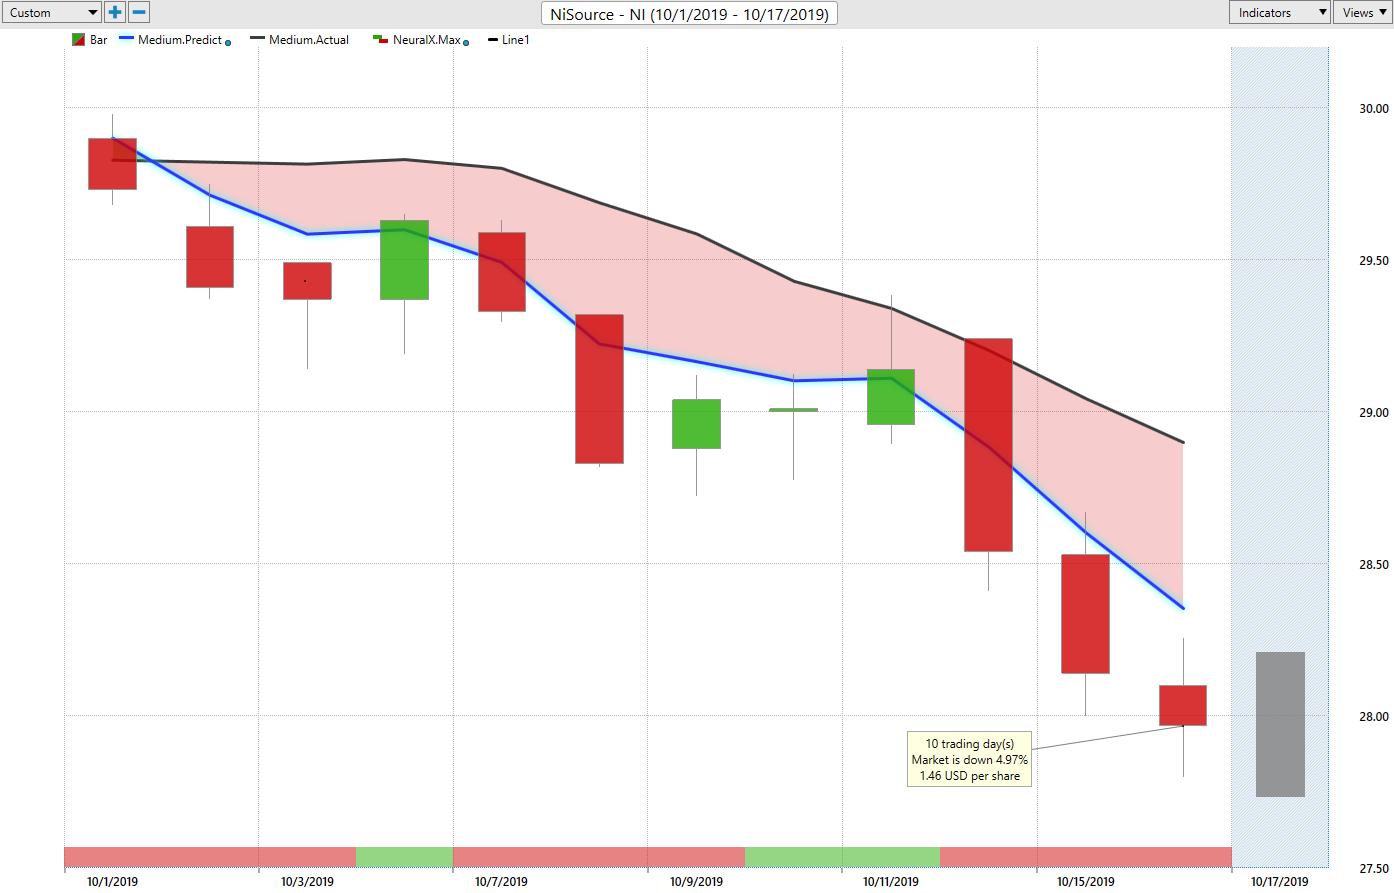
And you see a few entries here and why this is so important. You see so many days like this where the trend is down but the market’s going to close at a high. It’s going to close towards that predicted high on a very bullish move but almost immediately that trend continues and you want to be getting short on that trading day because at the next open you’re immediately moving lower with that trend. You see a couple more trading days here where you move up, hit those predicted highs. But you want to make sure you’re short in a market such as this and really just broadly utilities. So you run that scan and you just see all across the utility space these predicted moving average and moving to the downside letting you know, “Hey, don’t look for safety and the conservative trade here in utilities. These are easily slow-moving stocks already off 5%.”
Fortunate Brands Home & Security(FBHS)
So, here in Fortune Brands home security just another good example here to get these crossovers to the upside and certainly very clearly you want to be long in a market such as this. And so, as days click buy as far as your overall trade and you say, “Okay, well what should I be doing in this market that I’m in? Should I be taking profit, adding my position.” Well, you have the benefit of those predicted levels. So you see how even on a day like this you hit this predicted level comes up and boom you move down pretty quickly hit it.
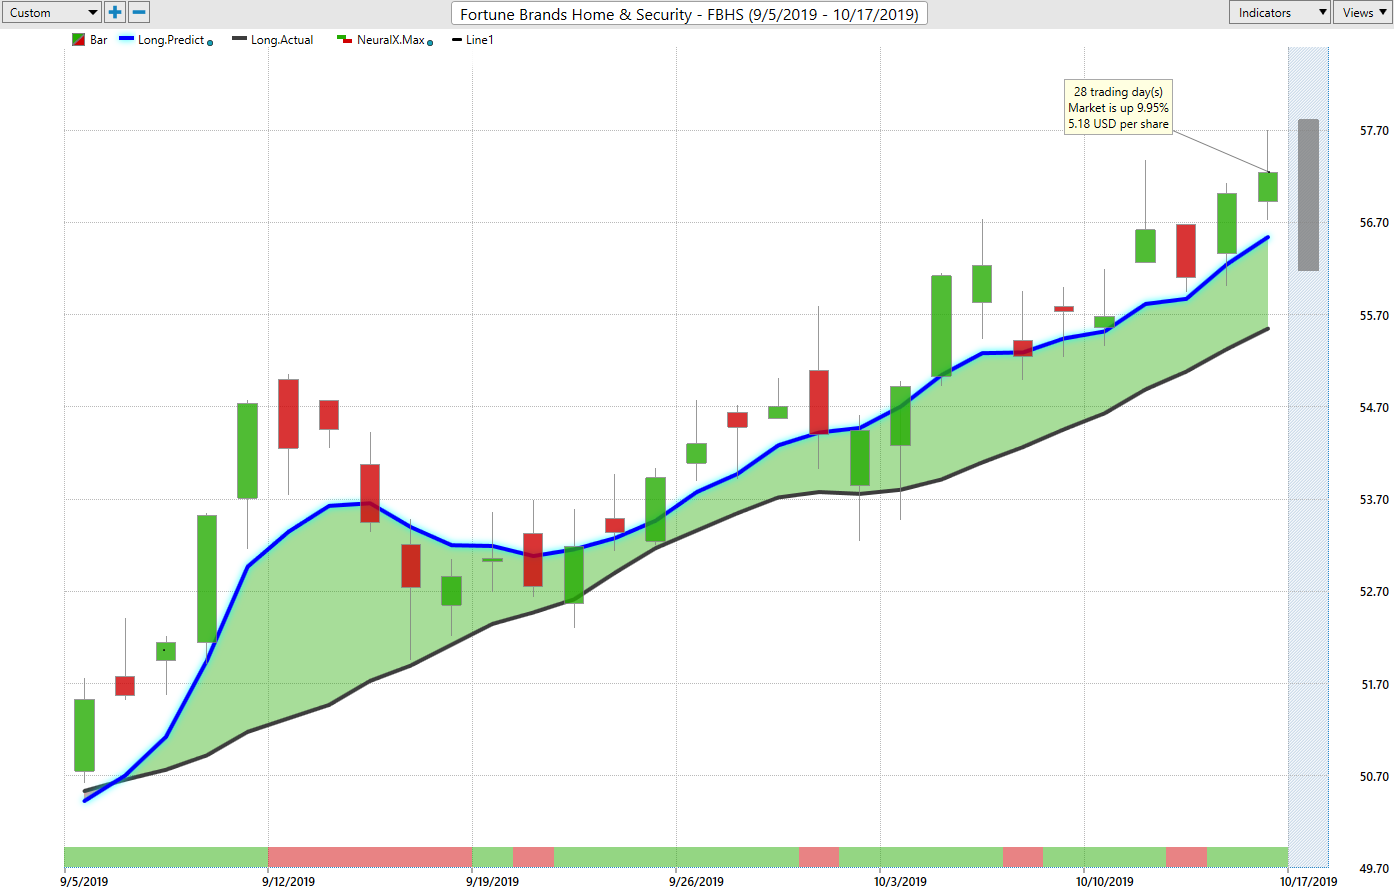
Here on this trading day you move a little past the predicted level and look at the next trading day letting you know, “Hey, we’re going to trade a little bit lower this next trading day make sure you’re prepared to add your position down there as long as you want to participate in that uptrend.” And you see again, multiple opportunities here, about five opportunities as this market trends to the upside. So over the course of the trade if you’re a trend trader a really nice move to the upside here. The market’s up about five, six percent but as a shorter-term trader you’ve had four or five entries to take one or two percent as that market keeps moving up from those predicted low levels that come through.
Nordic American Tankers(NAT)
So, another nice opportunity here and lastly here we’ve got Nordic American Tanker seen a lot of the tanking stocks actually really start to move, higher crude oil start to level out a little bit, but here in Northern American Tanker crossover to the upside neural index up at a one and just want to highlight how some of these stocks you see this is a very cheap stock here but when you understand, “Okay, well intraday, where do I want to come in to really limit the amount of risks that I have to take to still get the same exposure to that opportunity?” That can be really powerful. And when you can actually even take profits over the previous days you see you hit a predicted low here, hit a predicted high here, another predicted low come in here, you can take these little pieces out of the market but still make sure that you’re not getting out of the way of that big trend or that big opportunity and you’re not getting out of the way to soon.
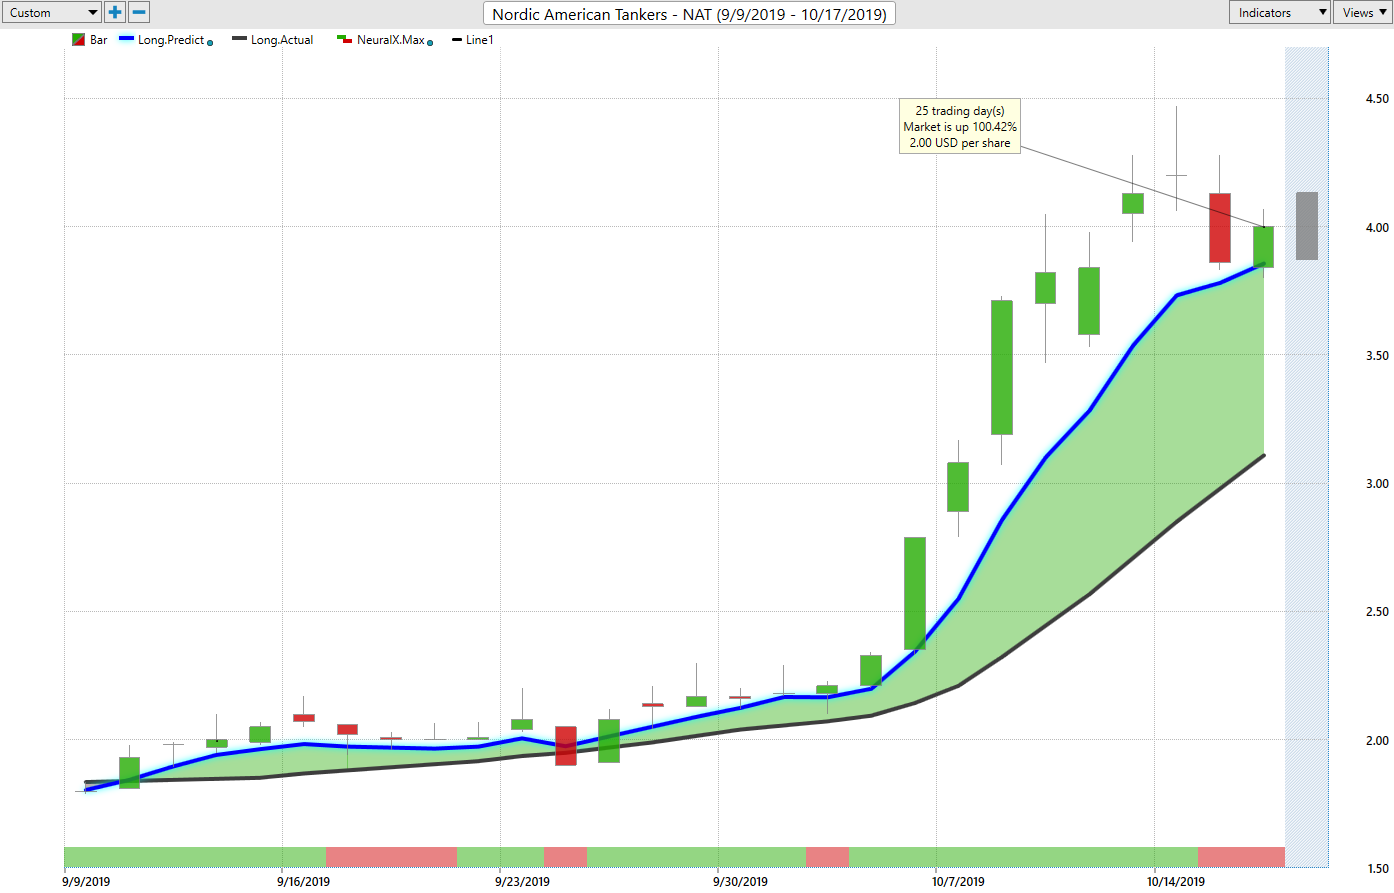
So, you see this market’s up over 84% just in the past 11 trading days from where those predicted lows were hit more recently. So, there’s been a ton of opportunities but of course, you want to know, “How am I going to go ahead and find each one of these trades?” And so, to do that we have this feature of the VantagePoint Intelliscan. So you see here as I go ahead and fiddle with some of my charts where I can actually bring in all of the US stocks into this scanning field and in a very, just a couple of clicks of the mouse here we can go ahead and add our filter and look through some pretty simple metrics here and say, “Okay, well if I’m looking for a new opportunity,” you want that crossover to let’s say to the upside a matching neural index. We’ve got some of these other predictive trend tools where we can set those to get more confirmation of the type of move that we’re looking for.
But you see we’ve got about 38 markets to come in and we can go ahead and open all of these, open up a few of them, ones we’re just interested in, but then say, “Okay, well where is there opportunity in the marketplace and where should I look and how should I look to manage that opportunity moving forward?” So understanding that some of these opportunities you see last for several weeks if not even several months but you have that guidance each and every day to say, “Okay, well you as a trader how do you want to go ahead and make those adjustments day-to-day as the environment changes?” And the predicted highs and lows are going to move around and let you know how to get the best out of each one of these opportunities.
So, really great opportunities out there all throughout the marketplace. We had a big sell-off, markets then rip around and start moving higher. So, a lot of things to the upside and to the downside but very clearly you want to know, “Where should I be pushing those opportunities? If I do want to go ahead and get long where should I be looking?” And it’s very clear to identify those areas where there’s going to be that continuation of a trend in a more probability you get involved in that nice move. So, once again this has been our hot stocks outlook for October 18th, 2019 thank you all for watching. Best of luck to the traders out there in the market. Thanks again and bye for now.


