


Hot Stocks Outlook for the Week of
September 27, 2019
The Hot Stocks Outlook uses VantagePoint’s market forecasts that are up to 87.4% accurate, demonstrating how traders can improve their timing and direction. In this week’s video, VantagePoint Software reviews forecasts for Advanced Auto Parts(AAP), Lexicon Pharmaceuticals(LXRX), Eagle Materials(EXP), and Shopify(SHOP).
This Week’s Hot Stocks Outlook
Good afternoon traders and welcome back to the Hot Stocks Outlook for September 27th, 2019. Hope you all are having a great week out there in the financial markets and as always, plenty to cover in this week’s Hot Stocks Outlook.
Advanced Auto Parts(AAP)
So, we’re going to go ahead and start out here with shares of Advance Auto Parts. We’ve got Lexicon Pharmaceuticals, Eagle Materials, and Shopify and we’re actually going to go ahead and highlight some of the features related to scanning for new opportunities, so how you identify new trades to get involved in.
But starting here with Advanced Auto Parts, what we have here is daily price actions. Each one of these candles represents a full and complete trading day and that’s how the software works. It generates new forecast after the trading day occurs, but right up against all of that price data, you see that there is a black line and a blue line.
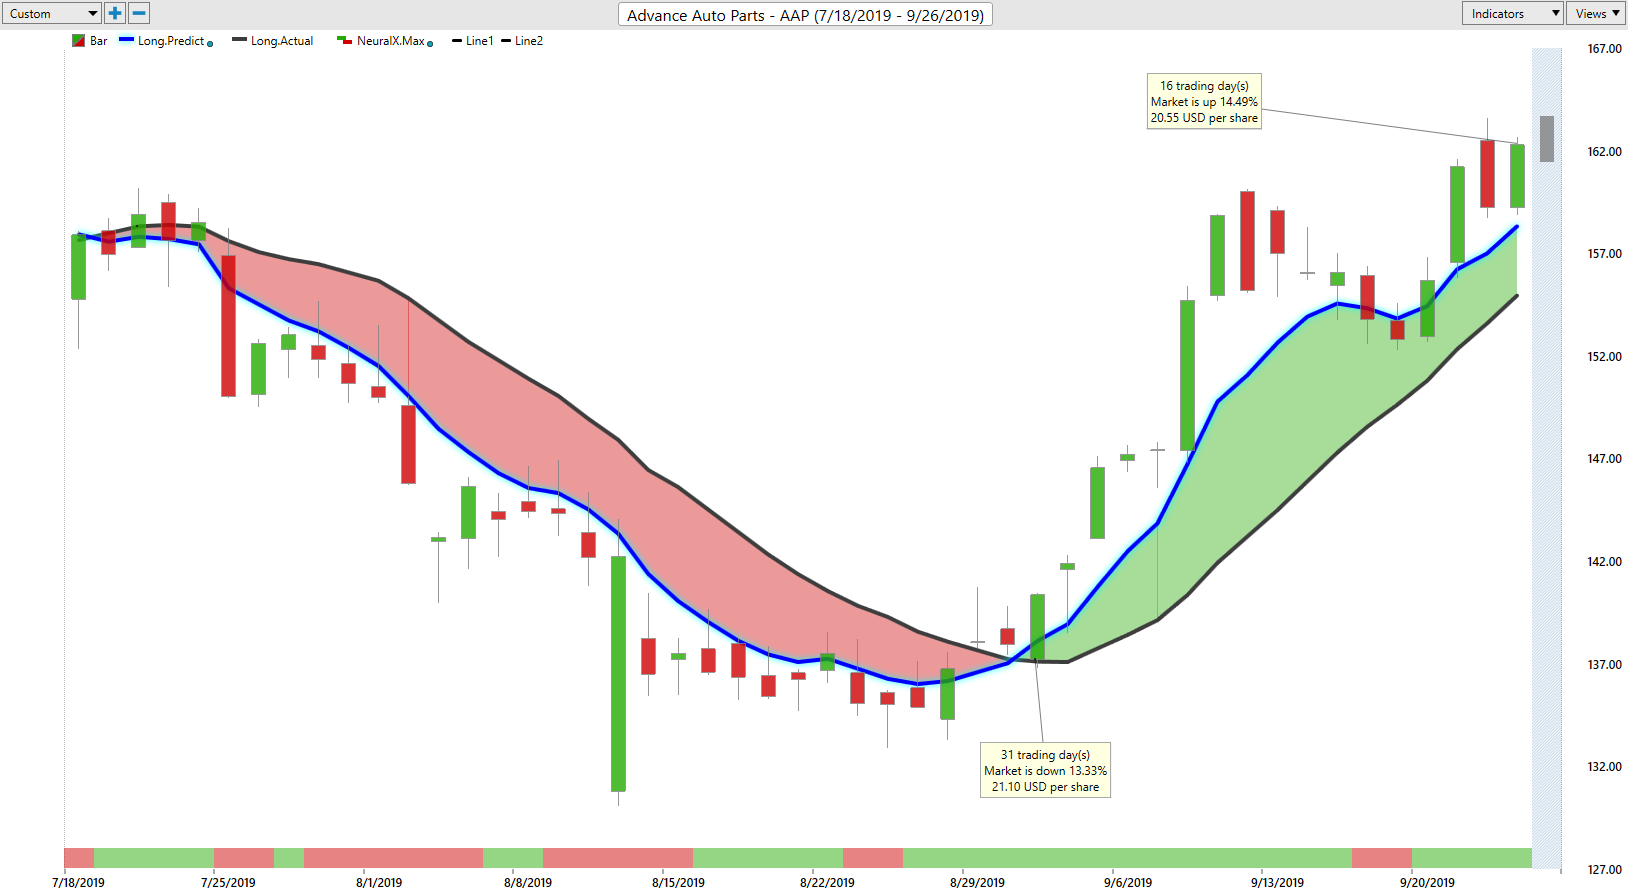
Now, the black line that you see on the chart there, that is a regular simple moving average. We refer to it as the actual simple moving average, and that is an extremely common technical indicator. If you look at any brokerage platform or charting service, very easy to just look at a simple moving average by taking the last 10 close prices, add them all together, divide it by 10, but the problem with a tool like that is that it is really only looking at past prices. So, it’s only just being dragged around by the previous close. And also it only looks at the one market in question. So it’s going to be a lagging indicator. It’s really just going to be reacting to what’s already occurred in the market.
And of course, as traders, we want to know what’s going to happen next. And so what we’re able to do is actually compare that black line, or that black value on the chart, to this blue line that you see. And for that value to be generated each and every evening VantagePoint is performing what’s called intermarket analysis, meaning it’s not just looking at the past prices of the one marketing question, it’s actually looking it up to 35 related markets that are known to drive and influence the target market that you’re getting ready to trade.
So, that can be things like ETF groups, that can be other related stocks that can be very important macro markets like the S&P 500, the Nasdaq, things like the dollar index, commodity prices. Think if you want to trade crude oil stock or a gold miner, very important to see those relationships in those other related commodities. And so what it does is it takes all of this information and actually generates future prices, so predictions in the future that haven’t yet occurred and builds that into the value of this moving average, turning it from a lagging indicator into a forward-looking predictive indicator.
So, whenever that predicted moving average crosses above the actual moving average, it’s letting you know that average prices are expected to start moving up, and therefore as a trader, you’re going to look at your strategy and say, “Okay, well how does this fit in? Obviously, I’d want to get it to go long position and then tie that into your overall timeframe. Now, to help with a lot of these other sorts of trade types, we have other tools here. Now if you look at the very bottom of the screen, you’ll see that there’s a line here at the bottom that can go from green to red. Again, that updates every single day and that’s an extremely accurate 48-hour indicator. So, also utilizing the technology of artificial intelligence and neural networks, but a much shorter-term indicator. Looking at those intermarket relationships and saying, short term strength or weakness in the market just over the next 48 hours or a couple of candles here.
Now lastly, you’re provided with a predicted high and low. So now we’re not looking at 48 hours, we’re looking at intraday of predicted high and low level so that you can go ahead, set your limit order, set your profit targets and be more efficient as a trader and have some levels ahead of time. Well before the market occurs, these forecasts come in 6:00 PM Eastern Time the night before, so you know going into the next trading day what you want to be doing. But very simply here we see Advanced Auto Parts, we can see that blue line crossing above the black line, but more importantly, we can take a look at those predicted highs and lows and we can actually see going back how accurate each one of these levels are. So when you understand, ‘Hey, I got a market, I got a directional bias, I want to be long or short.’ You’ve got the guidance here that says, ‘Okay, you can be long, where do you want to be adding your position?’ Certainly down near these predicted loads you see you hit them on occasion, couple days go by, you’ll probably hit a new predicted low and targeting the upside obviously, shooting towards those predicted highs.
Now, obviously when a trend’s in place you can blow past those shorter-term predicted highs, but all you would want to be doing is buying the market, taking profits on those long positions, and you see how this updates each and every day to really make you aware of what the likely volatility is, what your expectations should be, so that you don’t have to run huge amount of risk to get in on the same type of move. So, really nice opportunity here, you see shares of Advanced Auto Parts up 17% just in the past 18 trading days.
Lexicon Pharmaceuticals(LXRX)
So, September’s been a great opportunity at the early part of the month to go ahead and get long in the market and we’ve seen a lot of these markets pay off, the market’s done extremely well, but at the end of September, running into some overbought conditions, getting stuck up there and actually seeing certain markets start turning into downtrend. So, a similar situation though here in Lexicon.
So, the beginning of September, you’re going to see a lot of these crossovers and trends emerge at the same time, letting you know there’s a lot of strength or a lot of weakness in the markets here, but very clearly your crossover to the upside neural index very strongly here up at a one, you see once it goes down to this bearish condition, you get that weakness, and that’s what lets you know there’s likely to be some volatility around this area, maybe take some profit, get a better price after you’ve been involved in this really nice up trend to the upside here. But looking at these daily predicted highs and lows, we see how this works moving forward. You know a really great guide here of saying, “Okay well, look at these predicted low levels because we’re come out of the range there, but again you see you actually gap down here trading higher.”
Again, hitting these predicted lows, hitting these predicted values each and every day and a really nice opportunity to go ahead and without a huge amount of risk, understand, “Look, I want to go ahead and be long in the market, I’ve got these levels each and every day to guide me as far as where I should be getting involved in the position, possibly adding to the position, this has been an enormous move.” And you just see how very clearly these forecasts are of saying, “Look, the trend is up, neural index saying over these subsequent 48 hour periods expect some strength and this thing really takes off this market up 160% in the month of September and just the past 18 trading days.
Eagle Materials(EXP)
So again, you see more of these opportunities where at the beginning of September, stocks start to turn up and you can get involved in these up trends, trail your stops and make a lot of money to the upside here. So here’s Eagle Materials crossover to the upside here, very similar condition. You see that when this neural index gets bearish, what I like to do is just understand that you’re likely to trade below the predicted moving average. We’ve got this highly accurate predicted average moving forward, but when that neural index goes bearish, expect to trade a little bit below this value. But the trend you see still very much to the upside as that blue line has a huge amount of separation over the black line indicating that average prices are still expected to move higher. Sure, there’s going to be some volatility, but of course, if the trend is up, you want to remain in that trend and you see that within a couple of days of any sort of weakness, that trend resuming very strongly to the upside and meeting some new highs.
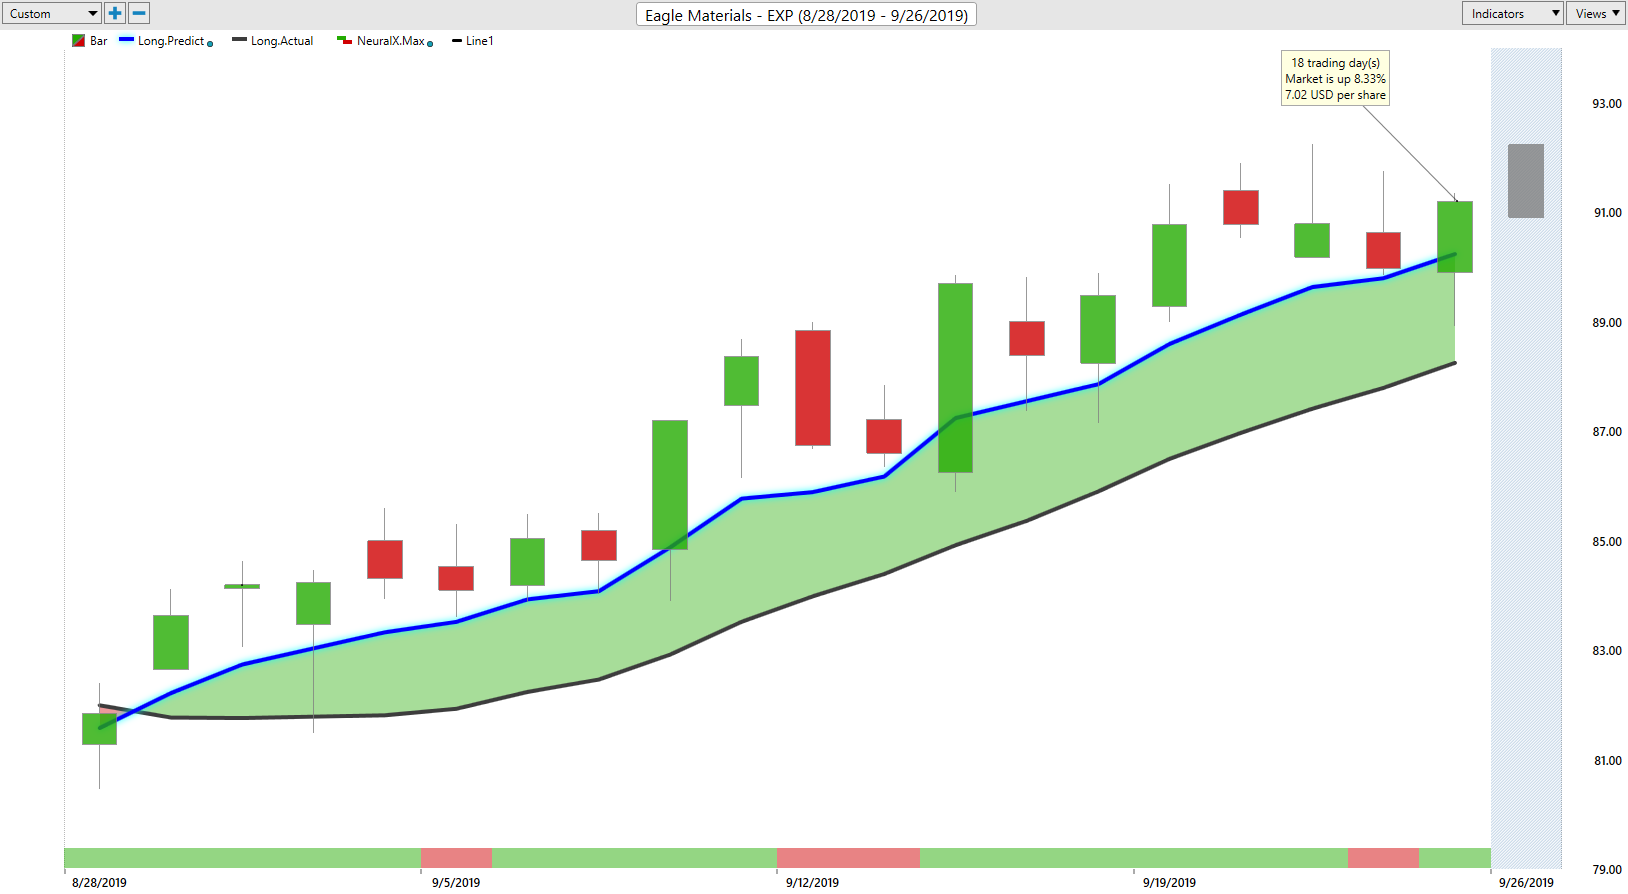
So again, we can look at those predicted levels here and just understand that where do you want to be buying in at? Well, we’re trying to buy in at the lower half of these ranges at these predicted levels and only go long, only take bullish trades to the upside, whether you’re a swing trader, a trader, so holding out for the longer term, or even a short term trader. A day trader needs to understand what’s the overall trend and where’s a good level to get in.
So, you see this market up about 12% in the last 21 trading days, and again, you see how many of these markets started to turn up at the beginning of September and that’s where the scanning features can really help you identify that there’s a bullish wave coming in here and a lot of different sectors in the marketplace, it makes sense to position my portfolio to the bullish side, but there are those opportunities where you’re going to see some weakness as well.
Shopify(SHOP)
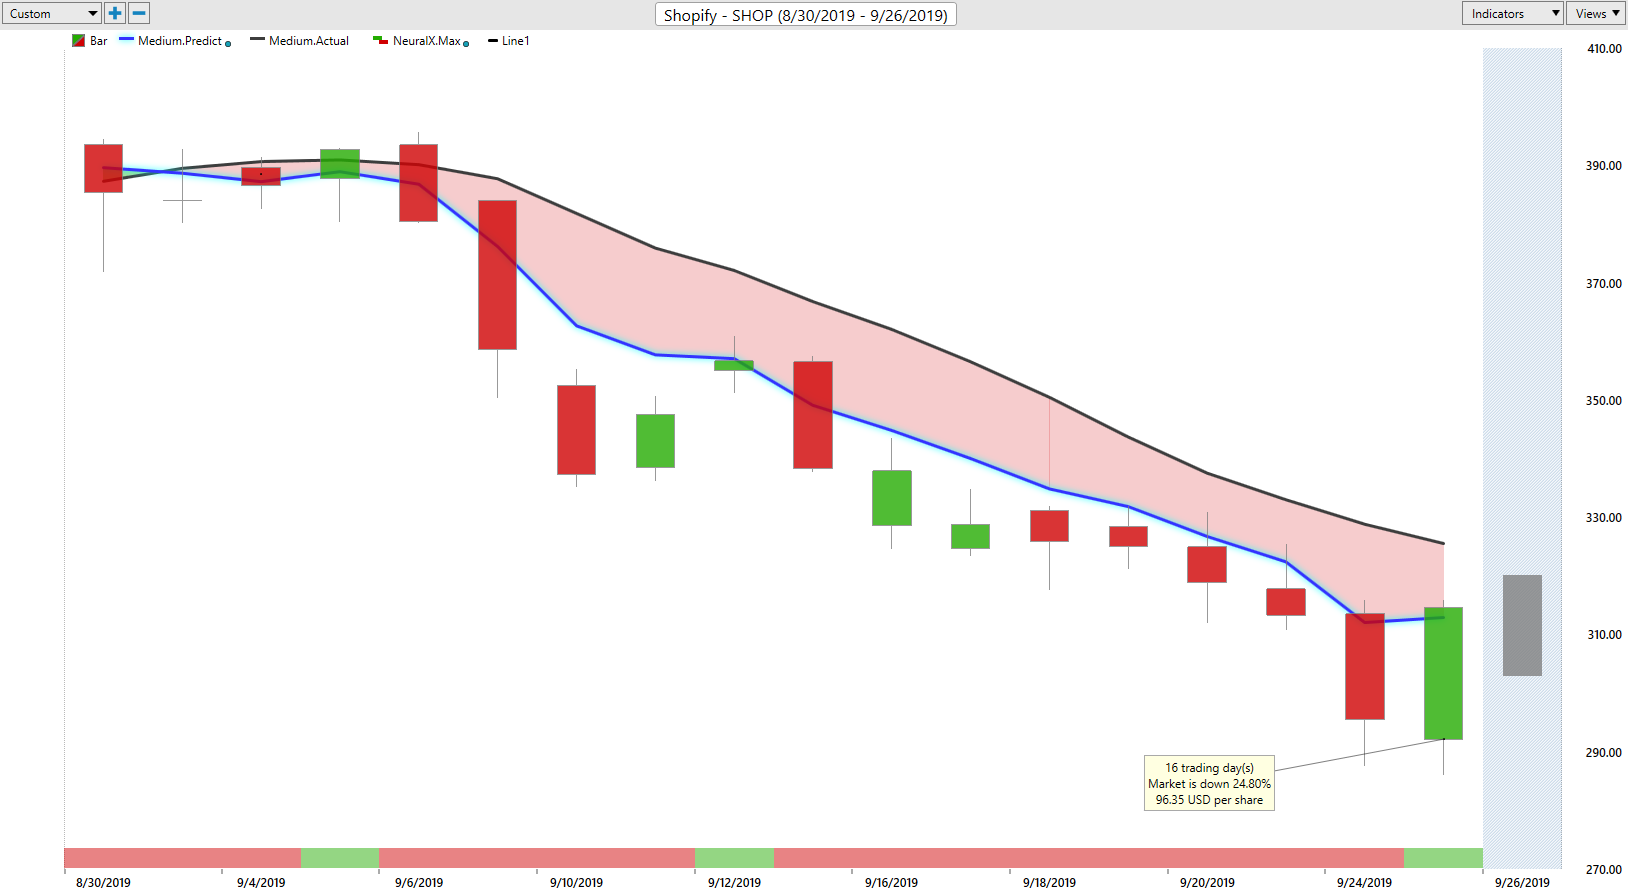
So if you’re looking for places to go ahead and get long in September, certainly one of those places is not shares of Shopify, as we see at the beginning of September, getting a crossover to the downside indicating that this market is expected to move lower.
Again, you see that neural index getting up to a bullish signal there and you get that little bit of intraday volatility move towards the upside there, you move to the bullish side in this case of the predicted moving average, but the trend is decidedly down very clearly. You don’t want to be taking long positions in a market such as this in looking to hedge your portfolio. So, If you can find some places where you can go ahead and not only get long, but also pepper that portfolio with some shorts as well, really regardless of what happens in the marketplace, you’re likely to get involved in a nice move here. So you see this market down over 19% in just the past 16 trading days. And that’s very important because let’s say in September you see all these bullish opportunities come through and you say, “Well, I really want to go ahead and hedge my portfolio.”
A lot of traders, what they’ll do is they’ll go in and maybe buy some puts on the same stocks that their longest protection, well, why not buy puts on a stock that actually looks weak. So, we can actually go in and I’ll go ahead and show you how some of these scanning features work. But if we go in and we can open up this, and I’m just going to open up a new one, so literally just the default views within VantagePoint here, but what we can do is go ahead and drag all of the markets that we’re treating.
See, I’ve just gone ahead and dragged all the US stocks into this area. You could do the same thing with futures, the Forex market, ETF’s, even cryptocurrencies, Canadian stocks, and what we can do is we’ve got this filter here and so we can say, “Okay, well, maybe I want to go ahead and look for a place to go and hedge my portfolio. A place where we can go ahead and exploit the bearish side of the marketplace, having seen all these bullish opportunities come through on the upside. Well, you get this list, we see about 43 markets have come through that saying there’s a been a fresh crossover to the downside, all of your trend indicators are directionally positioned to the downside, and what you want to do is you can open up all these stocks and say, “Okay, well, where is there good opportunity for me to go ahead and initiate a new short position?”
See, here are the shares of DocuSign, we’ve got a fresh crossover the downside, the neural index has been bearish a couple of days, but really, more importantly, you’ve got these tools like the predicted highs and lows to help guide you moving forward. So, understanding where it makes sense and is appropriate to add to that short position and also take some short term profits near those predicted lows as an intraday trade.
So, really great opportunities all throughout the equity space, but you want to go ahead and be prepared, have a tool that’s going to get you in ahead of these big breakouts and moves we see DocuSign here, another stock did really well in September, but we’re seeing some of that environment change. You want to be prepared for it and make sure that you’re making money really regardless of what happens to the broader equity space. So once again, this has been our Hot Stocks Outlook for September 27th, 2019. Thank you all for watching. Best of luck and bye for now.


