AMC Entertainment Holdings, Inc. (AMC)
This week’s stock analysis is AMC Entertainment Holdings, Inc. (AMC).
AMC Entertainment Holdings, Inc. is an American movie theater chain headquartered in Leawood, Kansas, and the largest movie theater chain in the world. Founded in 1920, AMC has the largest share of the U.S. theater market ahead of Regal and Cinemark Theatres.
With the COVID-19 pandemic and ensuing economic lockdown AMC was devasted as people stopped going to movies entirely. We wrote an article about this phenomena about a year ago which can be found here. As we reported, in March 2019, the Cinema industry had produced over $200 million in sales. In March 2020, this same industry had produced $5,000 in sales. This 99.99% decline in revenue illustrates the devastating effect that the pandemic has had on the entertainment industry.
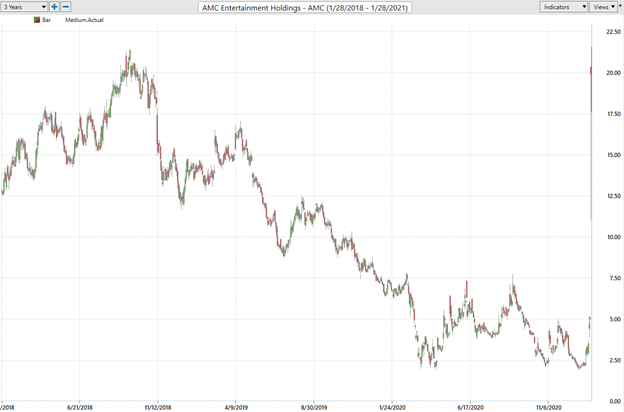
The following 3-year chart of AMC shows an industry that was struggling before the pandemic. The chart shows a series of lower highs and lower lows as we came into 2020. When the economic lockdown was announced AMC continued to flounder. Competitors Regal Theaters and Cineworld chose to reclose all their theaters. This created a huge cash flow problem for AMC and had many analysts proclaiming that the decision to remain open during the pandemic would lead AMC into bankruptcy.
From a pure fundamental standpoint the problem for AMC is that throughout 2020 they warned that there was a very strong risk they would run out of cash and that they were looking to issue more stock or debt to be able to remain afloat and continue meeting their operating expenses.
AMC is further in a bind as movie studios continue to delay the release dates of movies that have already been completed. While AMC remained open and served over two million moviegoers as of the 4th quarter of 2020, that still represents an 85% decline over the previous year.
On the positive side of the financial equation, AMC reorganized its balance sheet and raised an additional $350 million in debt adding to its already 5.5 billion in debt.
Traditionally AMC’s theaters would be viewed as a very valuable cash flow asset if normalcy were to return. However, until that occurs the company is remaining afloat by selling off some theaters in Europe, acquiring more debt and issuing more shares.
While this situation looked quite bleak, the light at the end of the tunnel over the past few weeks is that AMC had proven that it was a survivor of the pandemic and economic lockdown. Since it had been hammered down to three year lows in the past month speculators saw an opportunity to acquire AMC at a large discount to its traditional value.
However there is also something larger at play here with AMC stock. Online trading forums have proven that they have a huge disdain for hedge funds and banks who profit at the expense of the little guy, reminiscent of the Occupy Wall Street movement in Zucotti Park in New York City in 2011. That protest may have ended but its spirit lives on in a distrust of the establishment and its enforcement of a Quantitiative Easing policy that devalues savings and punishes Americans who own no investable assets by devaluing currency. The online trading forums have been scarred by economic policies of the past that make many feel like they are being left behind. When hedge funds began to prey on AMC and promised a bankruptcy before months end, the online trading forums stepped in to try and rescue this centerpiece of Americana culture and forced short sellers to cover their shorts.
So far, 2021 has been the year of the short-sellers getting squeezed hard with some select unloved companies finding new hope and life from Robinhood traders.
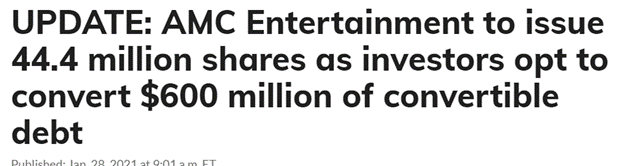
We are huge proponents of studying the annual trading range of any asset that we are looking to engage with. The chart below shows that AMC had traded as high as $7.78 and as low as $1.91 over the last 52 week. That provides us with an annual trading range of $5.87. When we divide the annual range by 52 weeks we can determine that the average weekly trading range is .11 cents. We refer to these numbers as common sense metrics. These values become baseline numbers which we look to outperform using artificial intelligence.
Whenever a stock reaches its 52 week high or low we instinctively know that something “BIG” is occuring. These boundaries are very important markers of defining value. This does not mean that we are automatically buyers when a 52 week low is established. It does mean that as these boundaries are approached on a chart that we put the stock on our radar for further study.
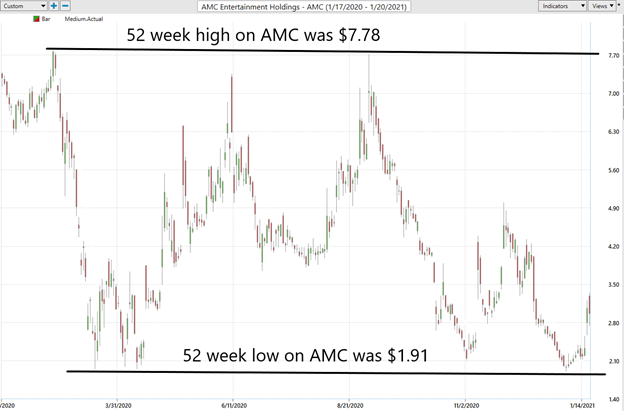
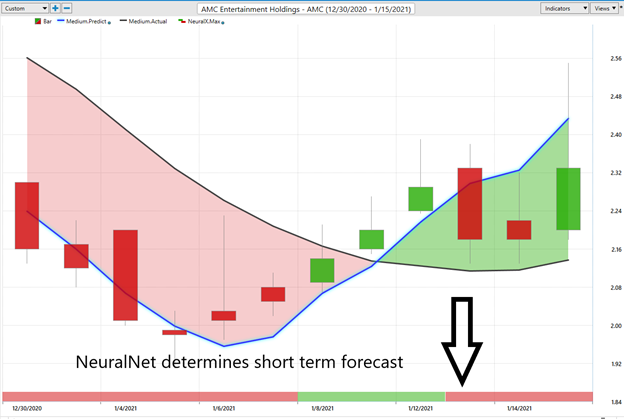
As we entered 2020 AMC was in a firm downtrend. On January 5th AMC posted its new 52 week low at $1.91. Power Traders monitor the Vantagepoint predictive blue line to determine the trend and medium term forecast. On January 7th the slope of the predictive blue line turned up and on January 11th the artificial intelligence signaled an UPTREND forecast when the predictive blue line moved above the black line.
At the bottom of the chart is the Neural Network Indicator which predicts future strength and/or weakness in the market. When the Neural Net Indicator is green it communicates strength. When the Neural Net is Red it is forecasting short term weakness in the market.
Using the Vantagepoint A.I. Software traders were alerted that the ideal value zone on this uptrend was in trying to purchase AMC at or below the predictive blue line on the chart. There were three trading sessions where traders could have purchased AMC between the price of $2.71 and $2.13.
Power traders use the predictive blue line in helping to determine both the value zone as well as the trend direction. The slope of the blue line is a forecast of future trend direction. The color of the NeuralNet Index identifies short term strength or weakness in the market.
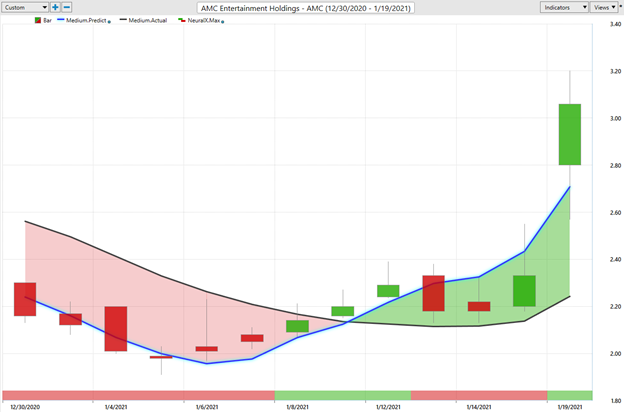
On January 19th, The NeuralNet Index turned green. AMC gapped .47 cents higher on the open and closed at $3.06 on the day.
We advocate that Power Traders cross reference the chart with the predictive blue line and neural network indicator to create optimal entry and exit points.
Power Traders are always looking to apply both the neural network and a.i. to the markets to find statistically sound trading opportunities.
So, what exactly happened here?
A few days ago, AMC announced that it had raised $917 million in financing that would permit it to fund operations deep into 2021. Accompanying this announcement was a coordinated campaign from sites like Reddit to pressure short sellers who were counting on an AMC bankruptcy. This campaign is referred to as a short squeeze because it requires traders who are short the stock to buy it back at higher prices, driving the price to parabolic levels.
While AMC is now on steadier footing financially after improving its balance sheet, the company is still burning through cash very quickly. Until crowds feel safe to return to crowded movie theaters, AMC’s problems are still very real.
Vantagepoint Power Traders found numerous opportunities to purchase AMC at or below the predictive blue line as the stock trended higher.

At this writing, AMC has traded as high as $20.36. This represents a potential $18.16 profit per share in 12 days. A small 500 share purchase would have resulted in profits of $9,080 on an initial investment of around $1,300.
VantagePoint Software Daily Price Range Prediction
One of the powerful features in the Vantagepoint A.I. Software which Power Traders use on a daily basis is the Price Range prediction forecast.
This forecast is what permits Power Traders to truly fine tune their entries and exits into the market.
At 6;30pm after the market close the software updates and all of the price predictions change based upon what the machine learning, a.i., neural networks, and intermarket analysis anticipate moving forward.
Here is the price chart of AMC during the most recent runup featuring only the Daily Price Range forecast.
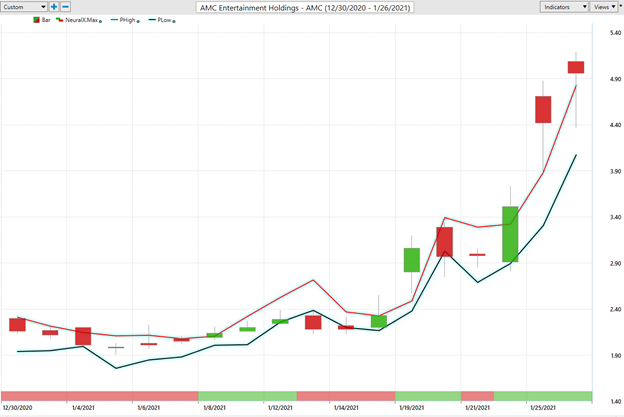
Power Traders use a price level below the predictive low price to place their protective sell stops in the market in case a sudden reversal was to occur. Observe how the predictive price low also provided numerous short term entry opportunities for traders to buy AMC as it was trending higher.
Intermarket Analysis
We live in a global marketplace.
Everything is interconnected.
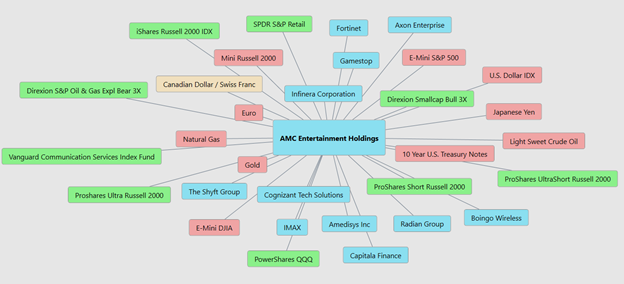
Small changes in Interest rates, Crude Oil Prices, and the Volatility of the dollar amongst thousands of other variables affect the decisions companies must make to survive in these very challenging times. Trying to determine what these factors are is one of the huge problems facing investors and traders.
There is great value to be had in studying and understanding the key drivers of AMC’s price action. This graphic provides a microcosmic view of what factors are driving the entertainment universe and the most statistically correlated assets. These factors are all displayed from a standpoint of statistical correlations which show the strongest interconnectedness of prices.
Power traders have been buying AMC below the predictive blue line and currently have protective sell stops in place in case the market suddenly reverses.
The stock has gained a stunning 839% in the year to date, despite the many challenges facing the world’s biggest cinema operator caused by the coronavirus pandemic. Artificial Intelligence, Machine Learning and Neural Networks have been essential tools for short term traders to participate in that stunning move.
Our suggestion. Follow the a.i. trend analysis and practice good money management on all of your trades.
Let’s Be Careful Out There!
Remember, It’s Not Magic.
It’s Machine Learning.
Disclaimer: THERE IS A HIGH DEGREE OF RISK INVOLVED IN TRADING. IT IS NOT PRUDENT OR ADVISABLE TO MAKE TRADING DECISIONS THAT ARE BEYOND YOUR FINANCIAL MEANS OR INVOLVE TRADING CAPITAL THAT YOU ARE NOT WILLING AND CAPABLE OF LOSING.
VANTAGEPOINT’S MARKETING CAMPAIGNS, OF ANY KIND, DO NOT CONSTITUTE TRADING ADVICE OR AN ENDORSEMENT OR RECOMMENDATION BY VANTAGEPOINT AI OR ANY ASSOCIATED AFFILIATES OF ANY TRADING METHODS, PROGRAMS, SYSTEMS OR ROUTINES. VANTAGEPOINT’S PERSONNEL ARE NOT LICENSED BROKERS OR ADVISORS AND DO NOT OFFER TRADING ADVICE.