Louisiana Pacific Corporation (LPX)
This week’s stock analysis is Louisiana Pacific Corporation (LPX) which highlights an opportunity this month for potential gains. From the cross-over on November 3rd, let’s breakdown how Power Traders exploited this opportunity for short terms gains.
VantagePoint Software Prediction
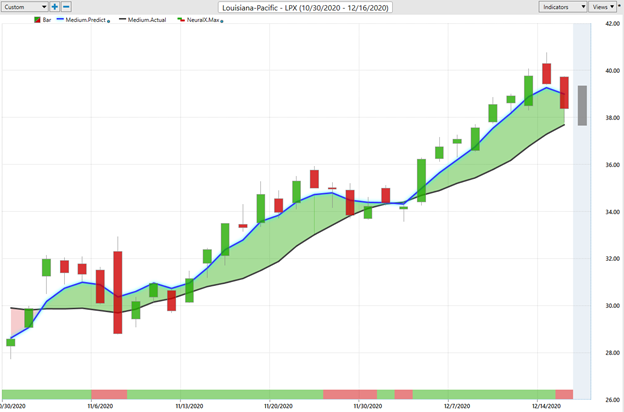
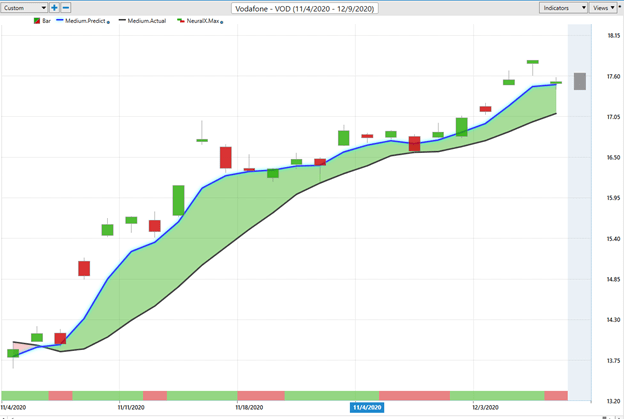
The predictive blue line in the Vantagepoint software is the first indicator that crossed the black line on November 3rd. At this date Louisiana Pacific was trading at $31.97.
Whenever the predictive blue line passes above the black line, the artificial intelligence is indicating that the future price direction of the underlying asset is UP. What occurred on November 3rd is referred to as a GAP in the market. Then on November 3rd opened $1.38 higher than the previous days close and never came down to the previous days trading range. While “gaps” can very exciting if you are already in the market, chasing GAPS is high risk because the majority of the time price action will return to the area where the price gap existed on the chart.
Seasoned traders learn patience by waiting for the market to retrace and fill the gap that was left on the chart on November 3rd. The price level of the gap was between 29.97 and $30.50.
On 11/6/20 The Neural Index turned Red indicating further weakness was expected in LPX. This also coincided with the price gap from 11/3/20 being filled. Please observe how the price retraced on 11/9/20 to a low of $28.78 and within three days the upward trend resumed with LPS trading as high as $31.47.
Power traders are always looking to position themselves in the direction of the upward trend when price drops below the predictive blue line. There were multiple opportunities between 11/6 and 11/13 to purchase LPX below the predictive blue line offering a great time to acquire “value.”
Let’s consider the common-sense metrics: Over the last 52 weeks LPX has traded as high as $40.76 and as low as $12.97. This provides us with an annual trading range of $27.79.
When we divide the annual trading range by 52 weeks, we can determine that the average annual weekly trading range is $.53.
We know that there are roughly 252 trading sessions in a year which tells us that the average trading range for LPX is roughly .11.
Since the initial upward forecast on 11/3/20, the artificial intelligence has captured $8.58 a share in just the last 31 trading sessions.
This upward trend highlights the explosive nature of this trend in LPX and is far beyond what would be considered normal for the stock.
While we will look at earnings on a stock we do not obsess or study a companies earnings very closely. This is because we are using Vantagepoint Software as a trading tool and not as a means of finding long term buy and hold investments. LPX generates $1.71 a share in earnings per share.
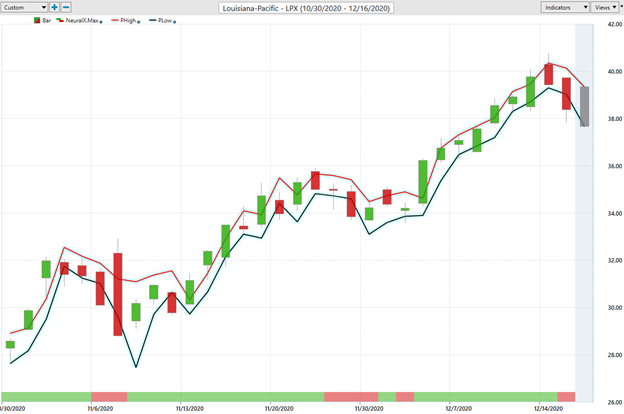
One of the most important features in using Vantagepoint Software is the daily trading range forecast. Once we determine that the upward forecast is in place we use the daily trading range forecast to fine tune our entries as well as deciding where we will place our protective limit orders to take profits, or sell stop to avoid losses. Please study the daily range chart provided below which clearly shows the value of this feature in the software.
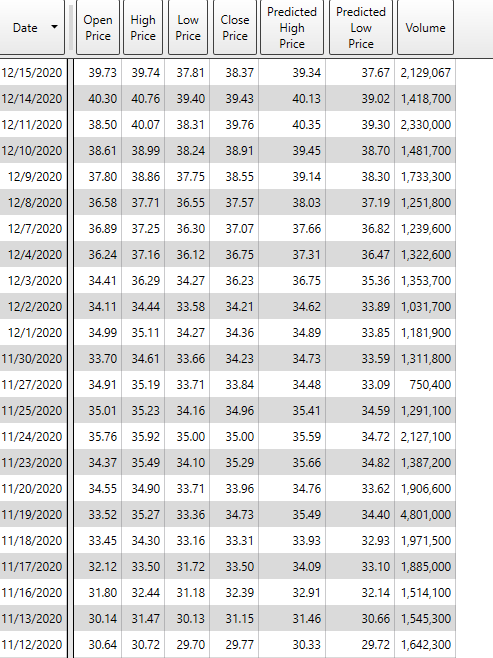
This feature can also be shown as a tabular grid in the software which also includes the trading volume for LPX.
Intermarket Analysis of LPX
One of the unique patented processes of the Vantagepoint software is its ability to analyze the intermarket correlations for stocks and other financial instruments.
This powerful feature quickly highlights the key drivers of an underlying assets price. These key drivers are the statistically most correlated assets to Louisiana Pacific Corporation (LPX).
Here is a quick graphic showing what the key drivers are at the present moment:
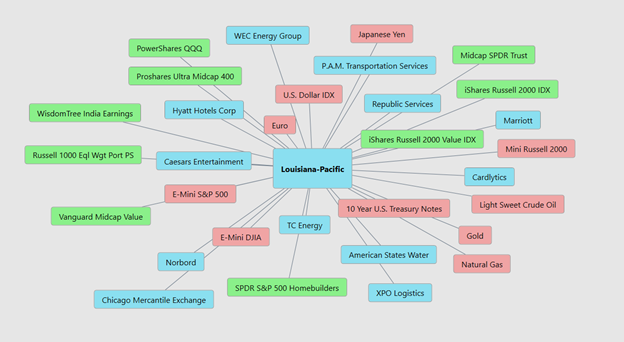
These are all of the stocks, ETF’s, mutual funds and Futures contracts most closely aligned with LPX price movement. This is very useful information because it very quickly allows you to see the ETF’s, mutual funds and commodities that are very tightly aligned with the price movement of LPX
About Louisiana Pacific Corporation (LPX)
Louisiana-Pacific Corporation, commonly known as “LPX”, is an American building materials manufacturer. It was founded in 1973 and is currently headquartered in Nashville, Tennessee. LPX is the world’s largest producer of engineered wood building products. LPX products are sold to builders and homeowners through building materials distributors and dealers and retail home centers. Louisiana Pacific employs over 4900 workers internationally. Louisiana Pacific has 24 mills including 15 in the United States, six in Canada, two in Chile and one in Brazil. LPX has a market cap of $3.915 billion. It trades an average of 1,493,318 shares a day.