PNC Financial Services Group (PNC)
This week’s stock analysis is the PNC Financial Services Group (PNC)
In the world of trading an investing it’s important to break down an opportunity into its individual parts. By doing so, we can determine the strength or weakness of our strategy and consistently analyze it as we seek to improve.
Every opportunity presents the pre-trade analysis, an entry, a holding of the position and an exit. In this particular strategy our focus will be on the exit from PNC which has been a great trade which our power traders focused on over the past few months.
Pre-Trade Analysis
The PNC Financial Services Group, Inc. operates as a diversified financial services company in the United States. PNC is a stock which is widely covered by financial analysts and traders. The 18 analysts offering 12-month price forecasts for PNC Financial Services Group Inc have a median target of 160.50, with a high estimate of 179.00 and a low estimate of 142.00. The median estimate represents a +2.89% increase from the last price of 156. At the present time it appears that PNC is slightly under valued from a fundamental stock perspective.
Whenever we trade or invest, we love to see a widely divergent opinion on a stock as it will usually mean that the asset is very liquid and trades with significant volume. PNC trades on average 2.3 million shares a day.
First off, let’s look at the commonsense metrics. Over the past year PNC has traded as high as 162.74 and as low as 79.41. This equates to a trading range for the entire year of 83.34. When we divide this trading range by 52 weeks, our average weekly trading range is 1.60. This is what has been considered normal for the stock over the last 52 weeks. We look to amplify these metrics for the short-term trades that we engage in.
Banks are a definite hit or miss sector right now. What creates so much uncertainty in the sector is the economic lockdowns due to the pandemic as well as an interest rate environment that leaves you scratching your head wondering how a bank can generate income with long term interest rates near zero percent.
PNC is the nations seventh largest bank with $443 billion is assets. PNC made huge news when it decided to sell of its $17 billion stake in BlackRock the worlds largest asset management firm. This sale marked the end of a 25-year partnership between BlackRock and PNC.
Entry.
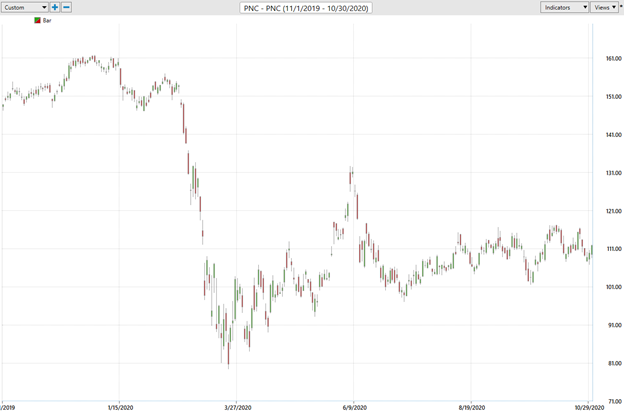
PNC had been trading in a sideways channel for most of 2020. The stock plummeted in March 2020 with the announcement of the pandemic and the economic lockdown. PNC spent the remainder of 2020 trading in a broad sideways channel with a mild upward bias.
On November 2, 2020, one day before the Presidential election, Vantagepoint Intelliscan users were alerted by the artificial intelligence that the trend forecast had changed from DOWN to UP. This occurred when the a.i. predictive blue line moved and closed above price. PNC closed on November 2nd at 114.45 per share.
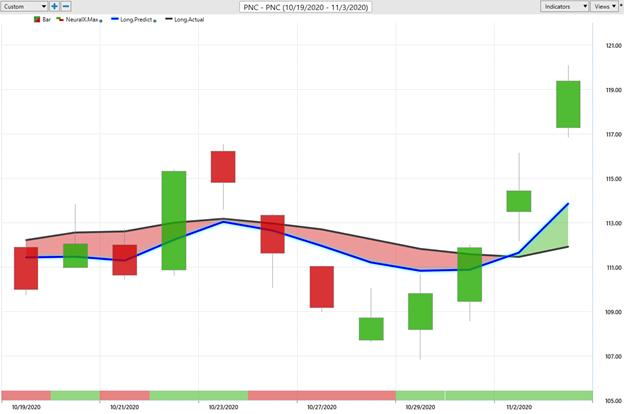
Power Traders identify the predictive blue line as the “value zone.” They look to purchase PNC at or below the predictive blue line. The slope of the predictive blue line also acts as a forecast of the short-term future trend.
Between November 2nd and November 6th, Power Traders had three days where they could purchase PNC at or below the predictive blue line. During this time frame the “value zone was between 113.86 and 115.01.
Power traders use the predictive blue line in helping to determine both the value zone as well as the trend direction.
At the bottom of the chart is the Neural Network Indicator which predicts future strength and/or weakness in the market. When the Neural Net Indicator is green it communicates strength. When the Neural Net is Red it is forecasting short term weakness in the market.
Observe how at the bottom of the chart is the NeuralNet Indicator. It was Red on November 4th indicating short term weakness and immediately turned Green.
The Swing Trade Holding Period
We advocate that Power Traders cross reference the chart with the predictive blue line and neural network indicator to create optimal entry and exit points.
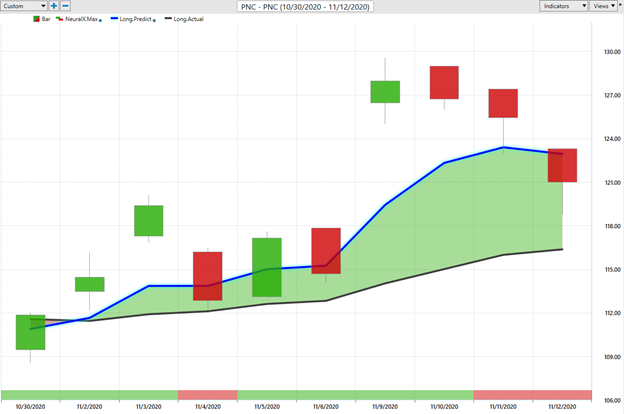
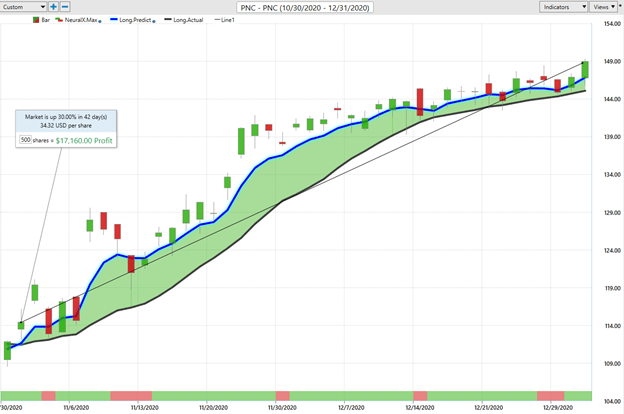
Over the coming two months PNC rallied from the 115 area to 149.31. Notice how the stock price consistently stayed above the predictive blue line. This represented a 30% rally in 42 days. On a 500-share trade it would have generated a $17,600 open profit.
Observe how over these 42 days that the NeuralNet at the bottom of the chart successfully predicted multiple times when short term weakness was expected.
During the Swing Trade Holding period traders use the black line value on the chart as the area where they look to place protective sell stops on their position in case the market quickly reverses.
Learning how to sit on your hands and not do anything is a skill acquired by great traders who know and recognize the implications of a powerful uptrend.
In the Vantagepoint Software the predictive blue line is the indicator that highlights future trend direction. Whenever the predictive blue line passes above the black line, the artificial intelligence is indicating that the future price direction of the underlying asset is UP. The inverse is also true, when the predictive blue line turns below the black line, and it is sloping downward, the A.I. is forecasting that the future trend direction is DOWN.
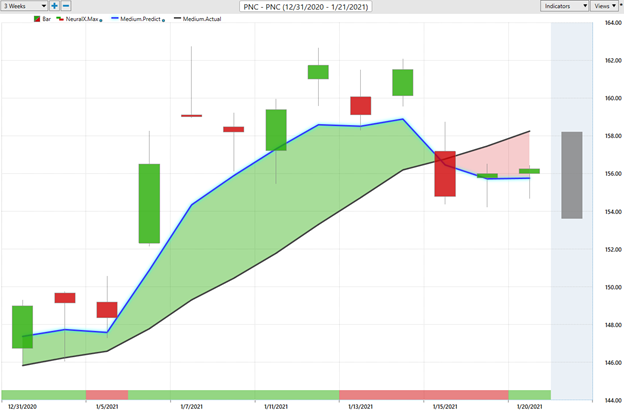
The EXIT
Power Traders continue to monitor the slope of the A.I. predictive blue line, the previous days low as well as the NeuralNet indicator at the bottom of the chart. Usually when all three of these occur it is an indication of a trend change.
Whenever the slope of the blue line turns lower, and closes below the black line, accompanied by a weak close below the previous days low and it is often a powerful forecast of future weakness in the market.
Observe how PNC continued to rally up until January 14th when PNC hit a high price of 162.07. The following day PNC traded sharply lower. The slope of the predictive blue line was down and crossed below the black line indicating a trend reversal. On January 15th PNC closed at 154.78. This provided the EXIT signal for Power Traders to exit the trade with very healthy profits.
Now that traders could have banked profits, we suggest they run the Vantagepoint Intelliscan daily looking for updates on other markets. But they should also continue to monitor PNC for future short-term trading opportunities.
As you study the chart observe how the predictive blue line often acts as very strong support, verifying that strong demand enters the market at the price level where the predictive blue line is defining value.
Intermarket Analysis performed daily during the holding period.
Do you ever wonder what drives price? I am not referring to headline news.
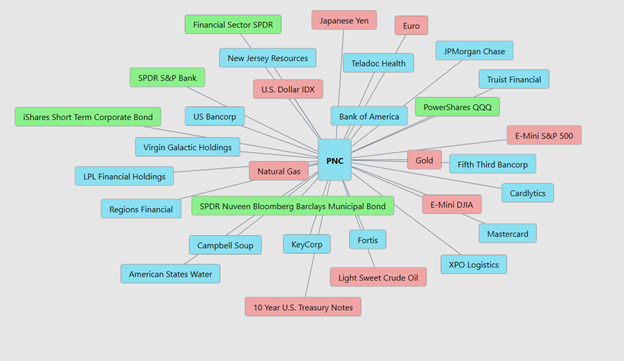
We live in a global marketplace. Everything is interconnected. Interest rates, Crude Oil Prices and the Volatility of the dollar amongst thousands of other variables affect the decisions companies must make to flourish and prosper in these very challenging times.
There is great value to be had in studying and understanding the key drivers of PNC’s price action. This graphic provides a microcosm view of the BANKING Universe. These factors are all displayed from a standpoint of statistical correlations which show the strongest interconnectedness of prices. This simple graphic communicates the ETF’s, Mutual Funds, Commodities, and stocks that are most closely correlated to the price of PNC.
We strongly advise Power Traders to closely monitor PNC for future trading opportunities. Our bias over the longer term is mildly bullish and this would be an attractive trade if PNC were to continue to sell off, move lower and THEN have the a.i. signal an UPTREND short term SWING trade opportunity again.
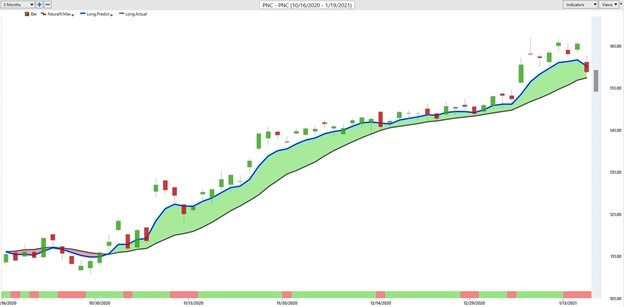
Here’s a graphic of the entire trend which lasted 52 days. It had Power Traders Long at 115. And exiting the position at 154.78 for a total profit $40.70 per share. A 500 share purchase could have netted $20,350.
Let’s Be Careful Out There!
Disclaimer: THERE IS A HIGH DEGREE OF RISK INVOLVED IN TRADING. IT IS NOT PRUDENT OR ADVISABLE TO MAKE TRADING DECISIONS THAT ARE BEYOND YOUR FINANCIAL MEANS OR INVOLVE TRADING CAPITAL THAT YOU ARE NOT WILLING AND CAPABLE OF LOSING.
VANTAGEPOINT’S MARKETING CAMPAIGNS, OF ANY KIND, DO NOT CONSTITUTE TRADING ADVICE OR AN ENDORSEMENT OR RECOMMENDATION BY VANTAGEPOINT AI OR ANY ASSOCIATED AFFILIATES OF ANY TRADING METHODS, PROGRAMS, SYSTEMS OR ROUTINES. VANTAGEPOINT’S PERSONNEL ARE NOT LICENSED BROKERS OR ADVISORS AND DO NOT OFFER TRADING ADVICE.