Vodafone (VOD)
This week’s stock analysis is VODAFONE (VOD) which highlights an opportunity this month for potential gains. From the cross-over on November 6th, let’s analyze how machine learning, neural networks and a.i. could have highlighted a nice swing trading opportunity.
VantagePoint Software Prediction
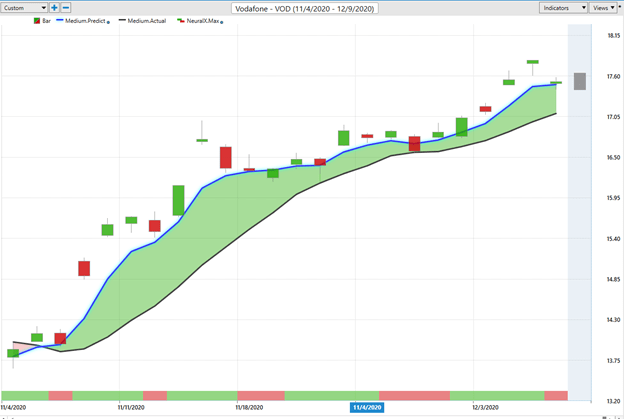
In the Vantagepoint Software the predictive blue line is the indicator that highlights future trend direction. Whenever the predictive blue line passes above the black line, the artificial intelligence is indicating that the future price direction of the underlying asset is UP.
VantagePoint began to highlight signs of a trend change on VOD on 11/5/20. The Neural Index (The Green/Red Bar below the candles) turned green on 11/7/20 accompanied by upward movement in the predictive blue line trend
Please notice how the close on 11/6 was right on the predictive blue line.
These two indicators when paired together provide a very reliable guide for determining future price action as indicated by the explosive move higher in VOD on 11/7/20.
The momentum upward was explosive as VOD rallied and closed above the predictive blue line for the next 6 sessions. Between 11/18 and 11/23 VOD provided the opportunity of latecomers to the trend to purchase the stock at or slightly below the predictive blue line which represents good value in an up trending market.
Let’s consider the common-sense metrics: Over the last 52 weeks VOD has traded as high as $20.53 and as low as $11.46. This provides us with an annual trading range of $9.07.
When we divide the annual trading range by 52 weeks, we can determine that the average annual weekly trading range is $.17.
We know that there are roughly 252 trading sessions in a year which tells us that the average trading range for VOD is roughly .035.
The artificial intelligence has captured $3.40 a share in just the last 22 trading sessions.
This upward advance highlights the explosive nature of this trend in VOD and is far beyond what would be considered normal for the stock.
With the Vantagepoint software as momentum is rising, the Artificial Intelligence signals that the best purchasing opportunities are at or below the predictive blue line. There have been multiple opportunities for entries at this level in this rising trend.
This feature allows ai Power Traders to look for short term swing trading opportunities based upon a pullback on the stock.
Three weeks after the initial entry on the VOD chart, traders are trailing the stock with a protective stop loss to minimize risk on the trade.
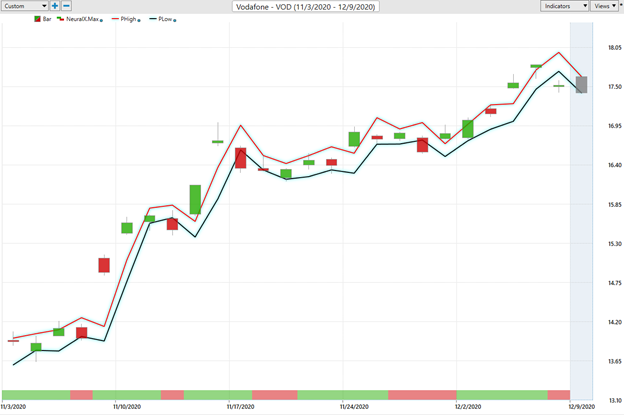
Another extremely valuable aspect of the Vantagepoint software is that it provides forecasts for the next trading days high price and low price. This is an feature allows for short term swing traders to fine tune their order placement when they are looking for a better trade entry and and viable exits.
Intermarket Analysis of Vodafone
One of the unique patented processes of the Vantagepoint software is its ability to analyze the intermarket correlations for stocks and other financial instruments.
This powerful feature quickly highlights the key drivers of an underlying assets price. These key drivers are the statistically most correlated assets to VODAFONE (VOD).
Here is a quick graphic showing what the key drivers are at the present moment:
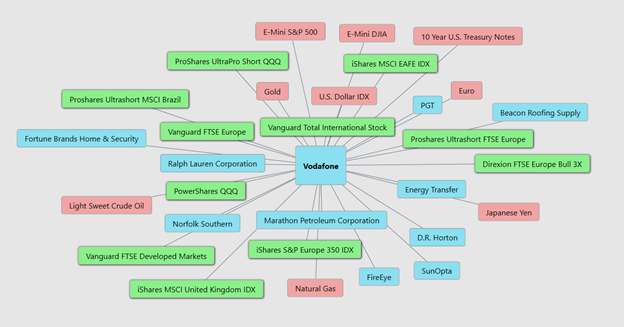
These are all of the stocks, ETF’s, mutual funds and Futures contracts most closely aligned with Vodafone price movement. This is very useful information because it very quickly allows you to see the ETF’s, mutual funds and commodities that are very tightly aligned with the price movement of VOD.
About Vodafone (VOD)
Vodafone Group plc is a British multinational telecommunications company. Its registered office is in Newbury, Berkshire, England and its global headquarters is in London. It predominantly operates services in Asia, Africa, Europe, and Oceania. It generates revenue of $44.97 billion Euros in 2020. As of November 2020, Vodafone owned and operated networks in 22 countries, and had partner networks in 48 further countries.. Average volume in VOD stock is roughly 4,107,000 share per day.