Joe Krutsinger Explains Leading Technical Indicators
New twist on an old indicator

BY JOE KRUTSINGER
You don’t have to be a math whiz to use advanced technology in your trading. But you do have to know how to select the proper inputs for certain markets. This look at one trading tool demonstrates that approach.
As an old hand at technical analysis – I wrote my first trading system in 1976 – I have seen virtually every type of market analysis that is out there. The tools that have been available over the nearly 30 years have changed dramatically from pencil, paper and daily newspaper to powerful hardware and software – and everything in between. Most of these tools can be divided into three groups: do-it-yourself kits, pre-constructed components and stand-alone, all-in-one data analyzers.
To illustrate the process of finding the right tools, we’ll use the experience of one of my clients, “Bob,” who was looking for a technical trading tool that was easy to use, did not require intraday monitoring and could help him become more successful. Bob is market savvy, but tired of using the same indicators that everyone else has been using for years. He wanted something unique that might give him a competitive edge. While there are hundreds of methods, indicators and strategies out there, my findings on one approach might help you identify other tools.
After going through the mounds of material I have saved over the years, I decided to check out what one trading system pioneer, Louis Mendelsohn, had been working on recently.
WHAT’S OLD IS STILL OLD Mendelsohn is probably best known for his ProfitTaker software. It was one of the first commercially available trading software programs for personal computers that performed strategy backtesting and optimization.
I discovered the program in 1985, when I was designing my own systems by hand, and then running them on an Osborne Computer and CalcStar, a precursor to Excel. I was amazed by Mendelsohn’s program; it showed the potential support, resistance, turning points, as well as the minor and major trend directions. This all-in-one tool helped me develop techniques I still use today. Indeed, many computerized trading tools marketed today rely on Mendelsohn’s ground-breaking work in strategy backtesting.
Fast-forward to 2005. Traders are still trying to figure out how to trade and monitor charts while working full-time jobs. But unlike 20 years ago, traders now have access to real-time quotes and up-to-the-second news via the Internet.
While things have changed, many traders use the identical technical indicators in the same way that they have been used for decades.
My goal as a trading consultant and educator is to teach innovative approaches to technical analysis and trading tools. That returns us to Mendelsohn, who has developed a “predicted” moving average. The approach, called VantagePoint, performs intermarket analysis on 10 related markets simultaneously. It then forecasts the moving averages for just one target markets. The prediction is based on how the other nine markets are affecting the target market, as well as internal analysis on the target market.
Mendelsohn uses neural networks to find subtle and often hidden intermarket relationships. His approach has five neural networks imbedded in its design. Neural networks are highly sophisticated models that make predictions based on the values of inputs, in this case the various markets. Inputs are what’s important. In VantagePoint’s case, that would be the intermarket relationships.
An important step when evaluating a trading plan or method is to comb through the tools currently employed by a trader to determine exactly what the new approach might bring to the table. In Bob’s case, he has been using moving averages of various durations.
However, Bob’s moving averages weren’t working out so well. While moving averages filter out the random noise in price data by smoothing price fluctuations, due to its construction, this technical indicator lags behind the market and therefore will always be late in forecasting a trend change.
This means that buy and sell signals based on moving averages occur after the trend has already changed direction. While traders are able to show profits on paper using lagging indicators such as moving averages, my experience suggests that even a several day lag can be very costly and even devastating in real trading due to the stress of weathering the late signals.
Mendelsohn’s approach of forecasting moving averages is appealing, but creating a leading indicator is easier said than done.
For the guy who wants to “roll his own” instead of buying a software package, consider using a Displaced Moving Average.
A type of moving average that attempts to overcome the lag is the displaced moving average. Ordinarily when computing moving averages and using them in some sort of crossover or oscillator approach, the moving average value for Day t (today) is plotted on a price charts again the price of Day t.
When this is done, the lag is evident on a chart as the market trends higher, for instance, and the moving average trails below the actual daily prices. Similarly, when a market reverses abruptly and starts to trend lower, the moving average lags above the actual price and briefly may even continue to increase in value even as the market is declining.
Displaced moving average attempt to eliminate this lag by displacing or shifting the moving average forward in time. In other words, a 5-day moving average value calculated on Day t might be shifted forward so that it is plotted on a price chart to correspond with Day t + 2 (the day after tomorrow) instead. In TradeStation the inputs would be: C,5,2 for a single moving average.
Alternatively, a 10-day moving average might be plotted four days into the future from today to correspond with Day t + 4 instead. (Inputs: C,10,4.)
The assumption behind displacing today’s actual moving average value forward in time is that the future period’s actual moving average that has not yet occurred will, in fact, be equal to today’s moving average value. This is, of course, a very simplistic forecast of a future period’s moving average value. However, it is a forecast; not just a linear extrapolation from past price data such as you achieve by extending a support or resistance trend line to the right of a price chart.
More research and testing of this “substitute” approach needs to be done before a recommendation can be made.
ANALYZING THE APPROACH Here is how Mendelsohn’s approach works: When the predicted moving average for a future date is greater than today’s actual moving average, the market can be expected to move higher throughout that time. Conversely, when the predicted moving average is less than today’s actual moving average, the market is expected to move lower. The difference between the two moving averages measures the strength of the expected move.
For example, a predicted 10-day moving average for four days from today is compared to today’s actual 10-day moving average. If the predicted average is greater than today’s actual average, the market is expected to go up. When the difference reaches a maximum positive number and starts to shrink, this is an early indication that the bullish trend is starting to lose strength and that the market is about to top out and soon turn down.
Then, if the predicted average does cross the actual moving average from above to below so that the difference between them shifts from positive to negative, this confirms that the market is ready to make a top and reverse. Depending on an individual trader’s risk tolerance, as well as his trading style and objectives, he might tighten his stop or close out a trade once the difference narrows even slightly.
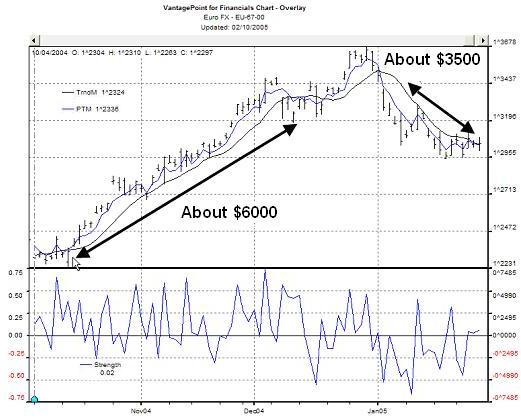 LEADING THE LAGGARDS The predicted moving average (the blue line in the price chart) clearly leads twists and turns in the actual 10-period moving average.Source: VantagePoint Trading Software
More aggressive traders might even reverse positions prior to the crossover actually occurring. Other, more conservative traders might wait for the crossover to take place before putting on a position.
Mendelsohn’s use of predicted moving averages is novel. While it is similar in many ways to the typical moving average crossover methods that we are all familiar with, by forecasting the moving averages Mendelsohn has found a way to overcome their lag and effectively transform this popular technical indicator from a trend-lagging into a trend-leading indicator.
Bernard Baruch, who always bought straw hats in the middle of winter, said you make money and save money by not doing what everyone else is doing. Using leading technical indicators, rather than commonly used lagging indicators, is a good example of not doing what everyone else is doing.
Following Mendelsohn’s approach for the 18 weeks from Oct. 1, 2004, through Feb. 10, 2005, we can see how well this works. The strategy generated four trades in that span: one huge winner, one big winner, one so-so winner and one small loser. All in all, it made about $12,000 trading one forex cross or futures contract. The approach worked because it captured trends early.
“Leading the laggards” (page 49) shows a crossover strategy comparing a predicted 10-day simple moving average for four days in the future with today’s actual 10-day moving average for the euro. Notice that the actual 10-day moving average lags behind both the predicted average and the market.
BETTER STOP PLACEMENT Using the same technology that allows the moving average forecast, this approach also can predict the next day’s high and low on the target market. Precise accuracy is not necessary to help traders identify entry and exit points and set trailing stops. In Bob’s case, he is working with a relatively small account and considers himself a conservative trader, so he adopts stops.
Depending on each market and depending on each trader’s own risk tolerance, the dollar amount of the stop can differ.
Rather than using a fixed dollar stop, Bob can use these high/low predictions. For instance, the predicted high/low range can be used on subsequent days to move his trailing stops. So, if Bob is long the euro and based on the forecasts the target market is expected to continue to keep rising, he might set his stop a few ticks below the predicted low to act as a support level.
Traditional support and resistance trendlines are used by too many traders and their stops often are bunched together and frequently get hit. Using a predicted high or low to set stops may lessen the likelihood of being stopped out during intraday price swings in the market. Look at an actual euro chart of these predicted highs and lows (see “Will the real high rise?” left).
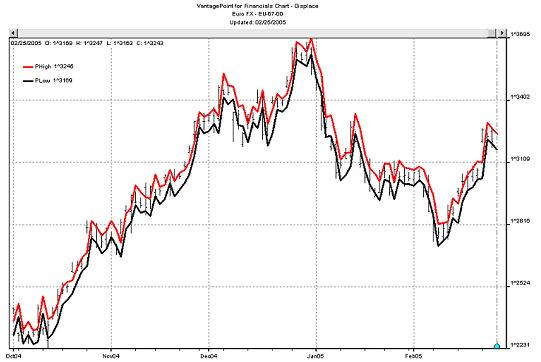 WILL THE REAL HIGH RISE? The predicted high and low reliably bracket the actual high or low of the following trading day, providing good guidance for stop placement.Source: VantagePoint Trading Software
Using the predicted high and low for setting stops during the period from October 2004 to early February 2005 would have worked quite well. The difference here is when the trend direction and high/low forecasts for the euro were generated, data from nine related markets were considered – not just the euro market.
The related markets that work so well in predicting the moving average and the high and low of the euro are the British pound, the U.S. dollar index, the eurodollar, the euro cash market, the Comex Gold Index, the Japanese yen, the Swiss franc, the S&P 500 and 10-year U.S. Treasury notes.
It is unrealistic to expect any indicator, regardless of its construction, to be able to tell you what the future trend direction of a market will be with complete accuracy. The Holy Grail has yet to be found, because it just doesn’t exist. There is no magic bullet but a lot of research, hard work and lessons learned can help you avoid common pitfalls and gain a competitive edge.
Joe Krutsinger, CTA, has developed proprietary trading programs for numerous clients and brokerage firms and is a featured speaker and teacher at seminars and meetings worldwide.
Reprinted from Futures Magazine Copyright © 2005 Futures Magazine Group Office 833 W. Jackson 7th Floor, Chicago, Ill. 60607 (312) 846-4600, Fax (312) 846-4638