Some companies chase the next big thing. GE Aerospace builds the machines that keep the global economy moving. Every day, thousands of commercial and military aircraft rely on GE engines to transport people, cargo, and critical supplies around the world. That places the company at the center of two powerful long-term growth markets: commercial aviation and defense.
GE Aerospace wasn’t always this focused. For decades, General Electric operated as a sprawling conglomerate with businesses ranging from finance to healthcare to power generation. Management eventually recognized that investors reward specialization, not complexity. By separating those businesses, GE Aerospace emerged as a pure-play aviation company with one clear mission: becoming the world’s premier aircraft propulsion and services provider.
The company generates revenue in two ways. First, it designs and manufactures aircraft engines for commercial airlines, military aircraft, and business aviation. Second—and perhaps more importantly—it services those engines for decades after they’re delivered. Every inspection, overhaul, replacement part, and maintenance contract produces recurring, high-margin revenue that creates a predictable stream of cash flow long after the original engine is sold.
That recurring service business is one of GE Aerospace’s greatest competitive advantages. Designing and certifying a modern jet engine requires billions of dollars, years of engineering, and an extraordinary safety record. Very few companies possess the technology, manufacturing expertise, and global support network needed to compete at this level. Those high barriers to entry help protect GE’s market position while making it difficult for new competitors to gain meaningful share.
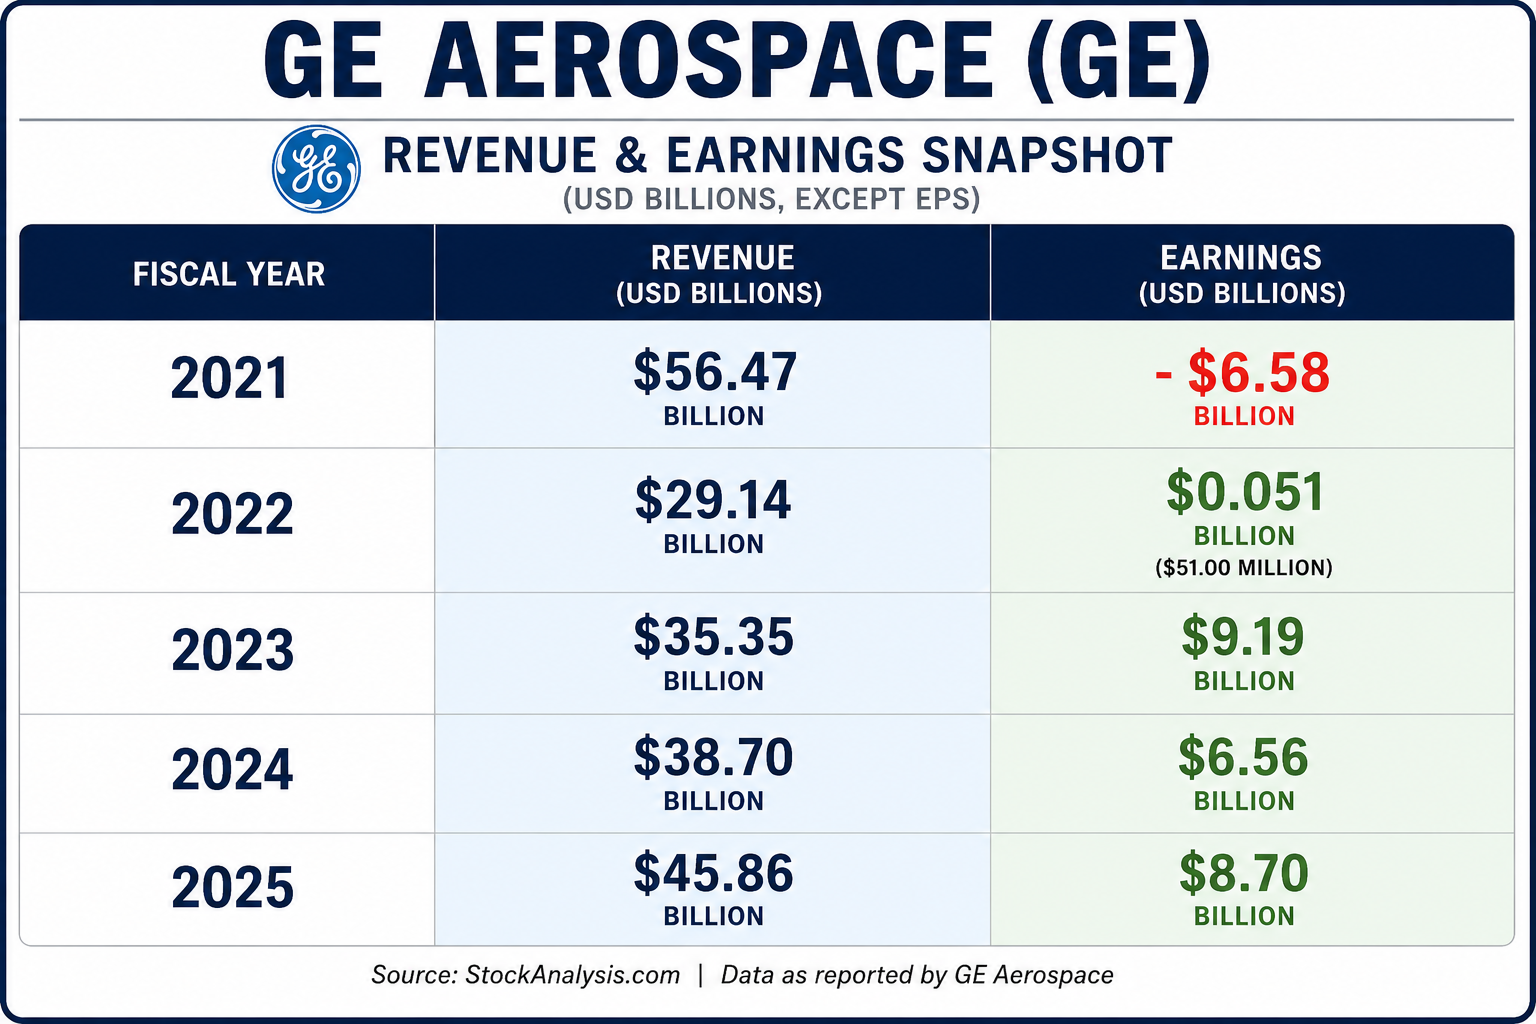
GE Aerospace’s financial transformation has been remarkable. After posting a $6.58 billion loss in 2021, the company returned to profitability in 2022 before generating $9.19 billion in earnings during 2023. Although earnings moderated to $6.56 billion in 2024, they rebounded to $8.70 billion in 2025 as revenue climbed to a record $45.86 billion. The combination of steadily rising sales, consistently strong profitability, and disciplined execution suggests management has successfully transformed GE Aerospace into a more focused, financially stronger business that is well positioned to benefit from the long-term growth in commercial aviation and defense markets.
Several long-term trends continue working in the company’s favor. Global air travel is expanding, airlines are replacing aging fleets with more fuel-efficient aircraft, and governments worldwide continue investing in defense capabilities. At the same time, aircraft manufacturers are working through record order backlogs, creating years of future demand for engines and the lucrative aftermarket services that follow. These are structural trends that extend well beyond the next quarter or even the next year.
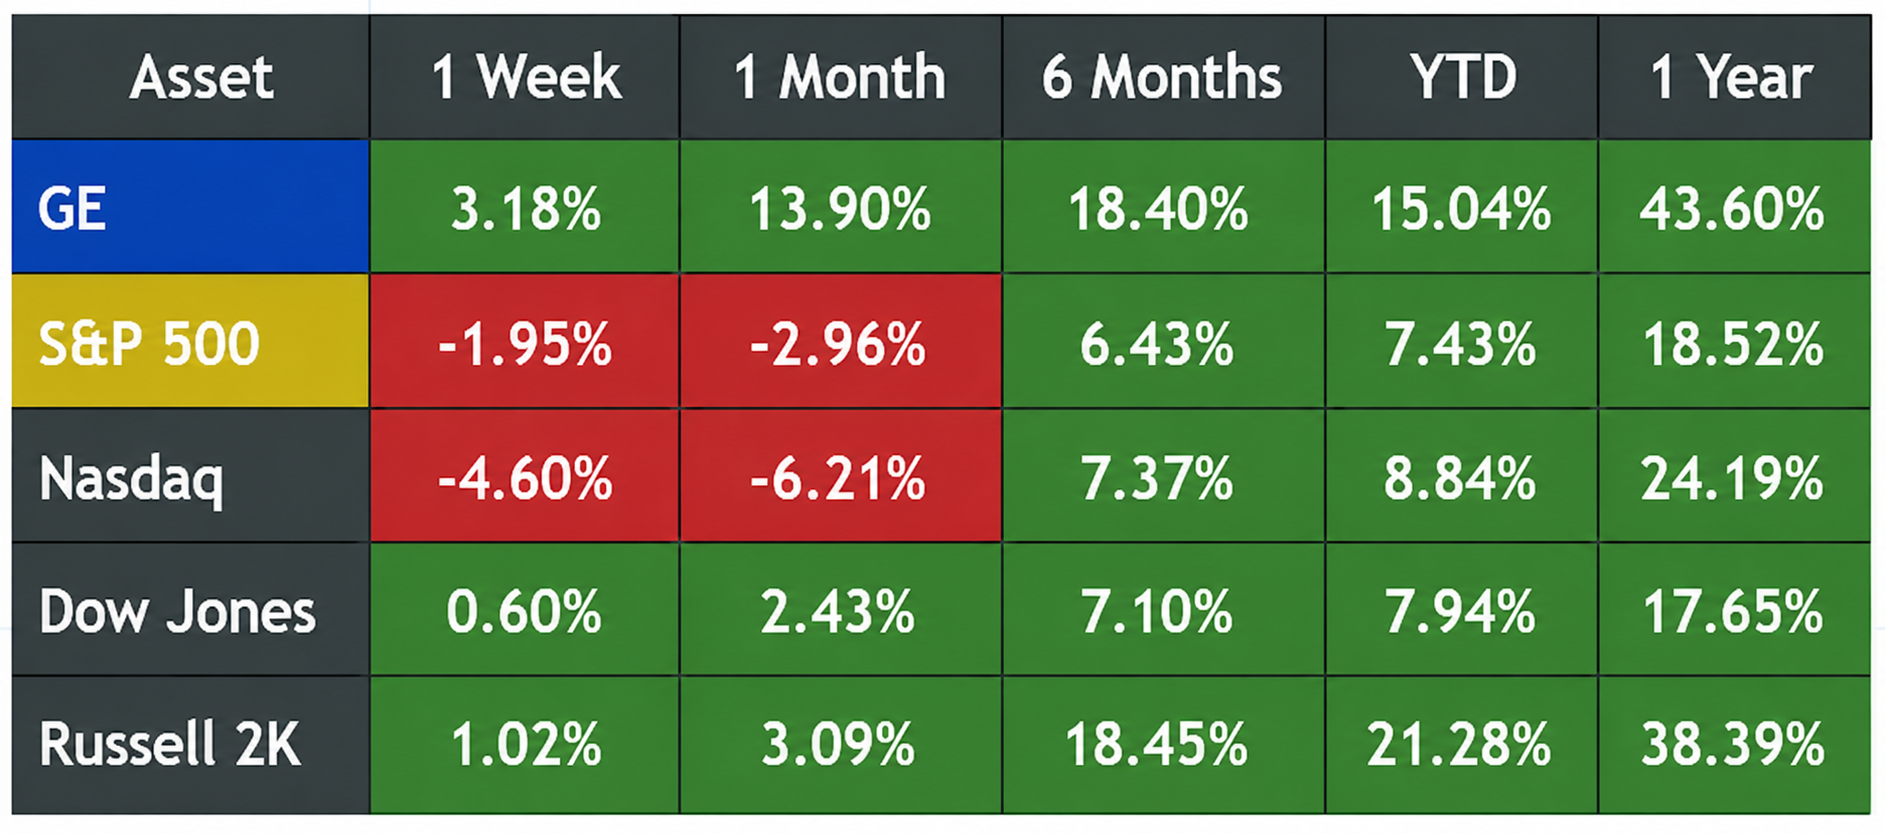
The attached performance graphics reinforce that fundamental story. GE has consistently outperformed the major market averages across multiple timeframes, suggesting institutional investors continue accumulating shares. Stocks rarely trade near their 52-week highs by accident. They get there because improving fundamentals, rising earnings expectations, and growing investor confidence reinforce one another over time.
No investment is without risk. Supply chain disruptions, slower aircraft deliveries, changing defense priorities, or an unexpected economic slowdown could all affect future growth. But based on the company’s transformation, improving financial performance, and leadership in one of the world’s most technologically demanding industries, GE Aerospace appears well positioned to benefit from the continued expansion of global aviation for years to come.
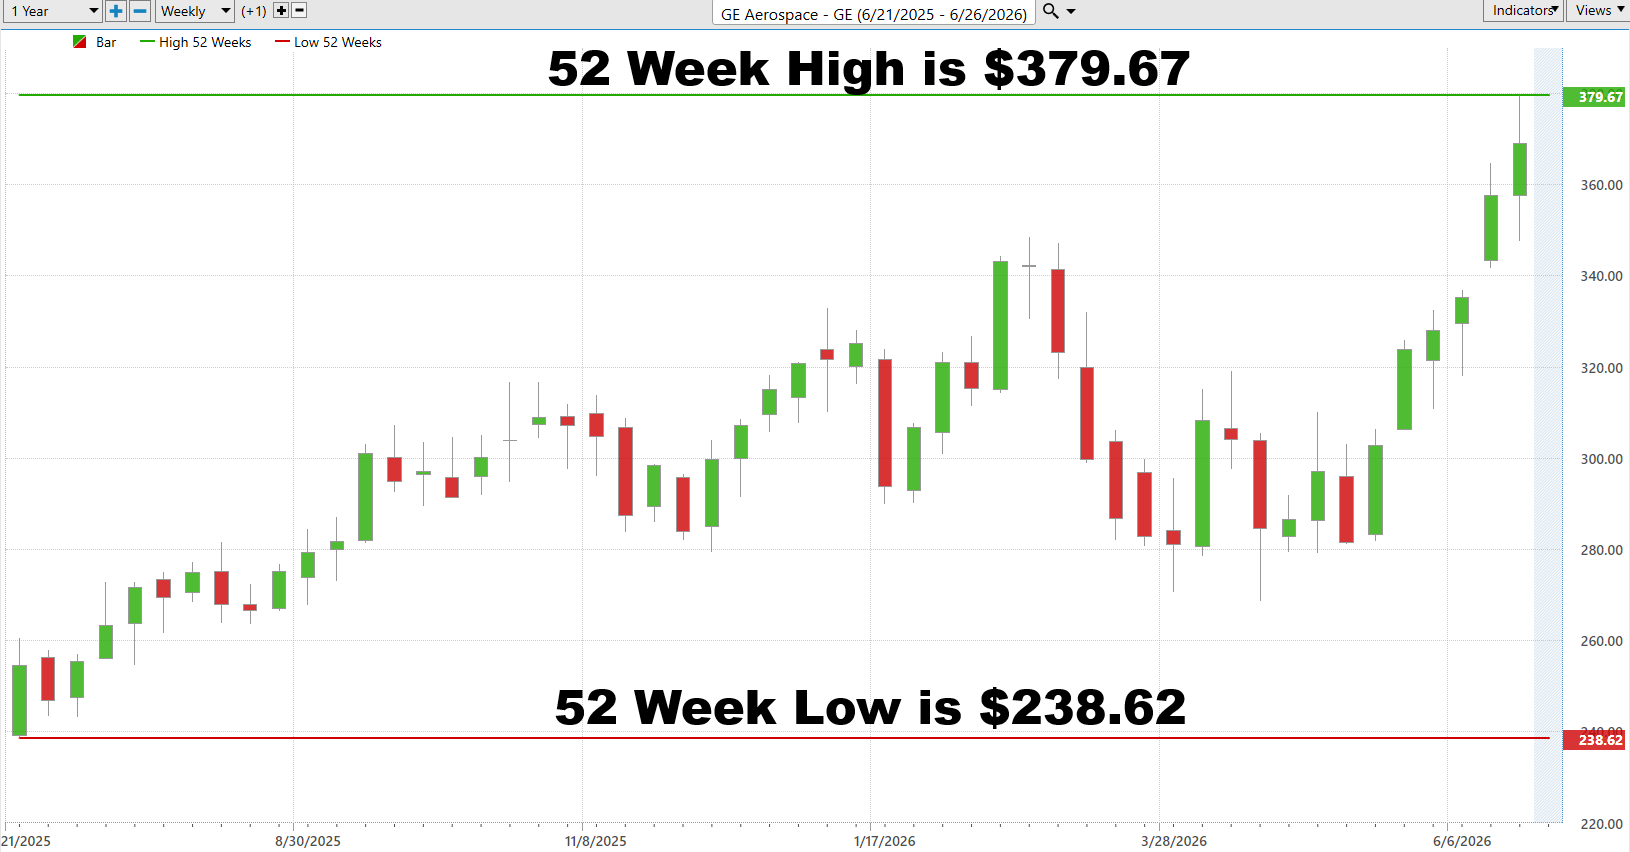
Wall Street has an odd habit of calling stocks “expensive” precisely when they’re proving everyone wrong. It’s a bit like refusing to buy a winning racehorse because it’s already crossed the finish line a few times. GE Aerospace has traded between $243.34 and $379.67 over the past year and recently closed at $369.00—just 2.8% below its 52-week high. That isn’t the behavior of a stock begging for sympathy. It’s the behavior of a company investors keep reaching into their wallets to own.
The most important number isn’t the distance from the high. It’s the distance from the low. GE now sits more than 51% above its worst level of the past year, which tells you buyers have been far more determined than sellers. That’s what institutional accumulation looks like. Mutual funds, pension funds, and hedge funds don’t spend months building large positions in companies they expect to disappoint. They buy strength because strength has an annoying tendency to continue longer than skeptics believe possible.
Could GE pull back? Absolutely. Every strong stock eventually pauses long enough for television commentators to declare the rally dead before it inconveniently starts climbing again. But until the stock begins making lower highs and lower lows, the evidence continues pointing in one direction. GE isn’t hanging around its 52-week high because investors are nostalgic. It’s there because the market believes the company’s future looks considerably better than its past.
Every stock has a personality. One of the best ways to understand that personality is to examine its largest uninterrupted advances and declines over the past year. The attached graphics reveal that GE Aerospace has repeatedly produced powerful rallies ranging from approximately 10% to more than 40%, while its corrections have generally been limited to 11% to 22% before buyers stepped back in. That asymmetry is encouraging because it shows the stock has historically rewarded patient investors far more than it has punished them.
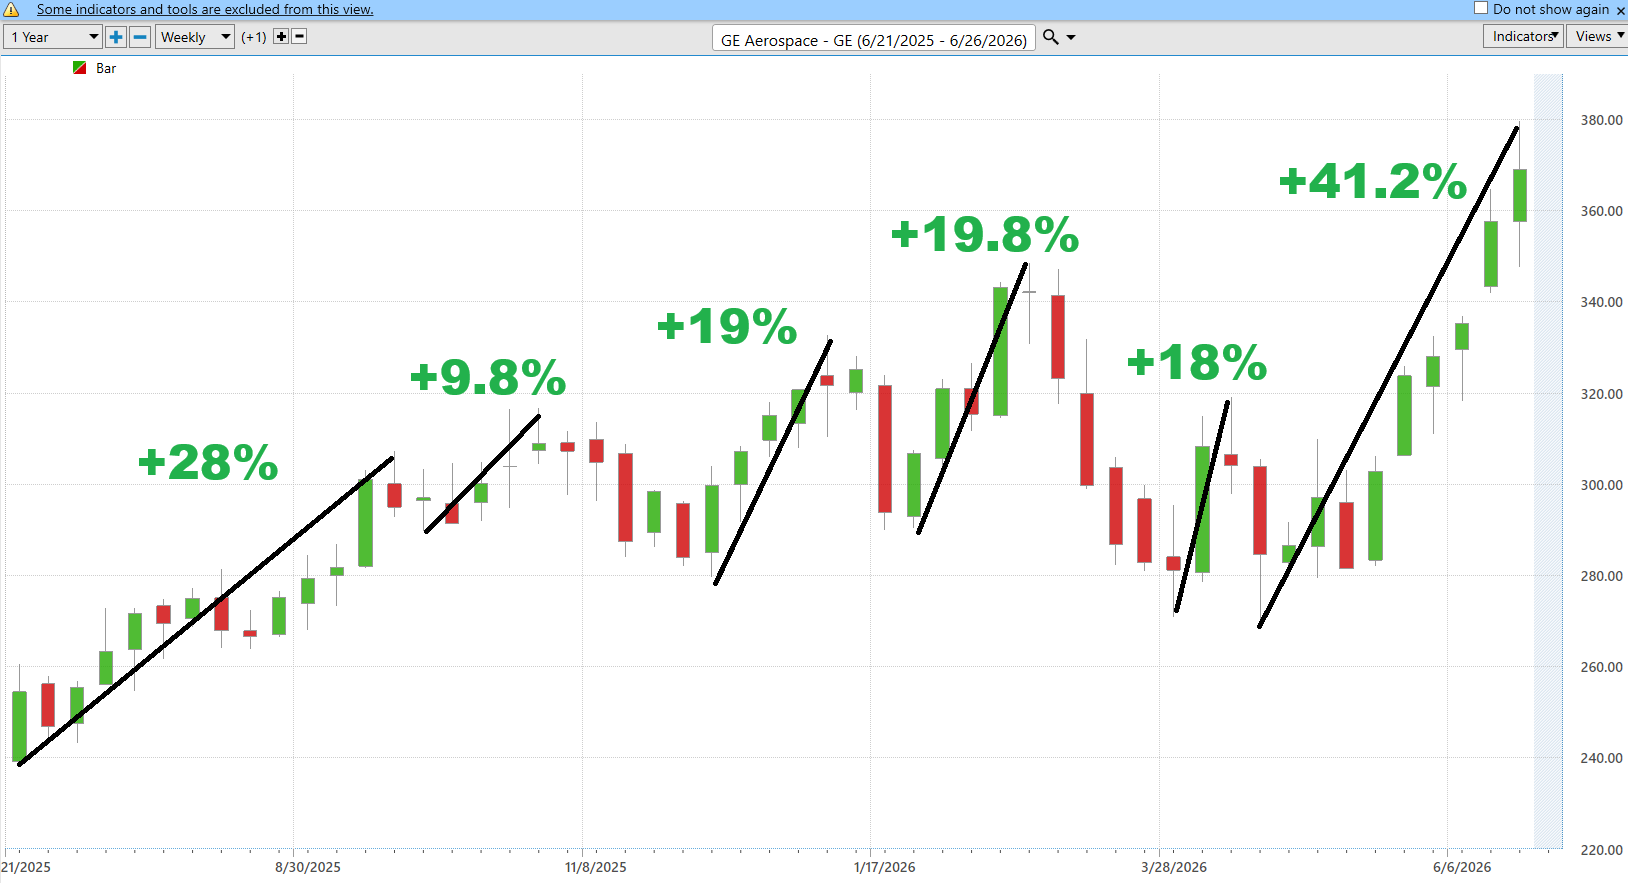
The Best-Case Scenario chart demonstrates that GE has consistently built higher highs following periods of consolidation. These rallies weren’t isolated events fueled by speculation. They occurred against a backdrop of improving earnings, expanding margins, strong commercial aviation demand, and continued institutional buying. While history never guarantees future performance, it does establish what a stock has been capable of achieving when business fundamentals and investor sentiment align.
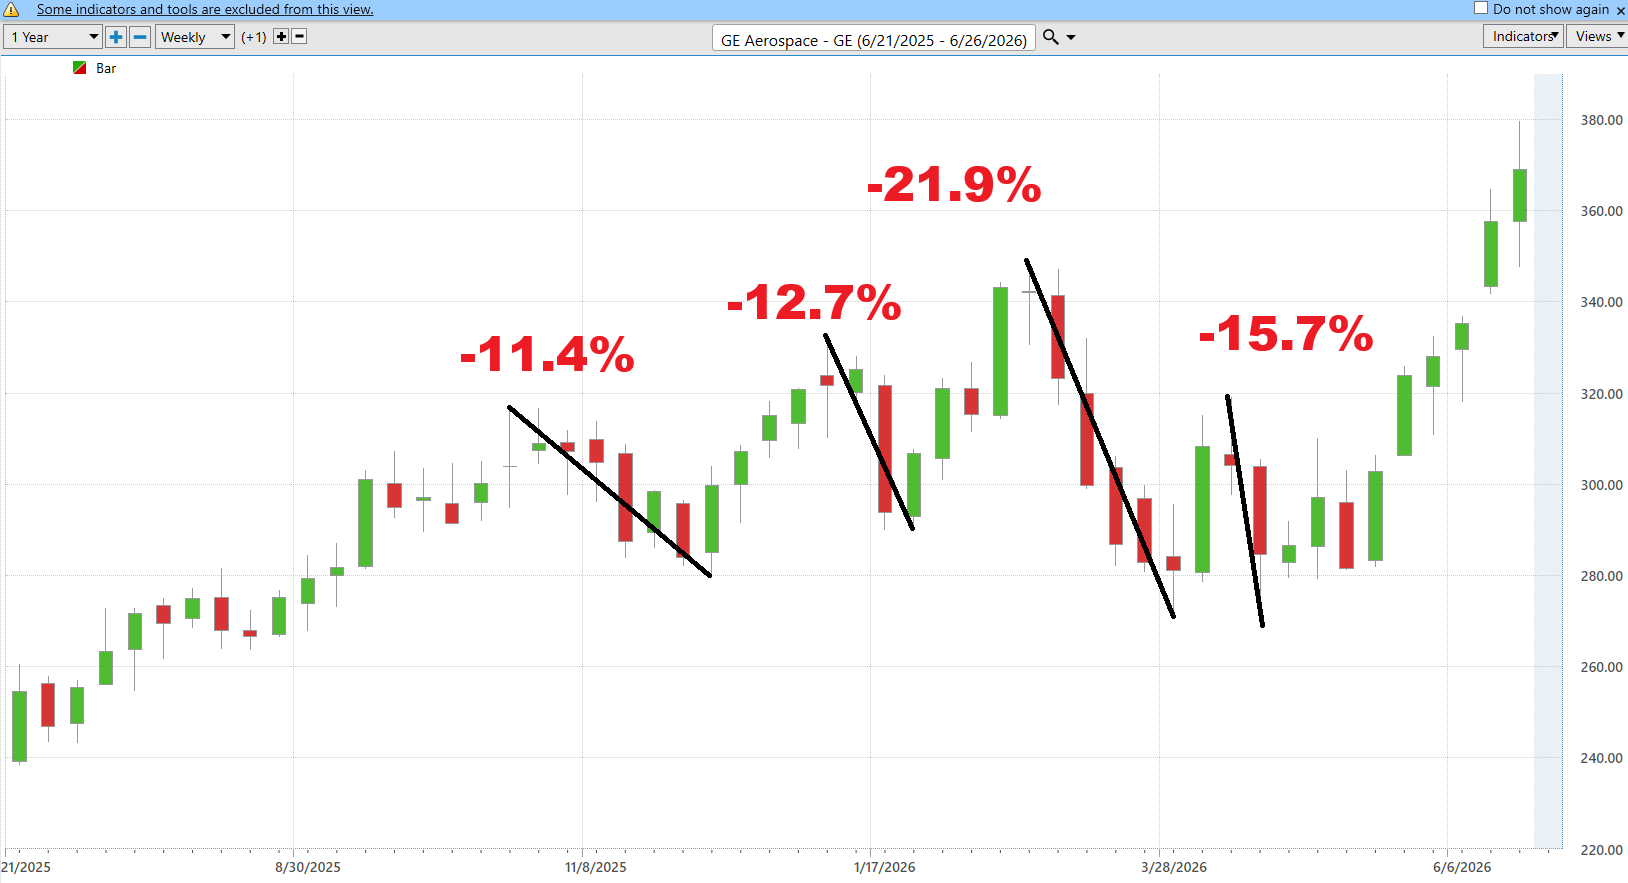
The Worst-Case Scenario chart provides an equally valuable perspective. Every strong stock experiences periods of profit-taking, and GE has been no exception. Its largest pullbacks over the past year ranged from roughly 11% to 22%, yet each correction ultimately attracted new buyers and gave way to another advance. That pattern suggests institutions have consistently viewed weakness as an opportunity to accumulate shares rather than a reason to abandon the company’s long-term outlook.
The lesson is straightforward. Successful traders don’t prepare only for the upside—they prepare for the downside as well. GE’s history suggests that meaningful rallies have substantially outweighed its corrections, but investors should still expect periodic volatility along the way. Understanding both the stock’s upside potential and its historical downside risk allows traders to manage expectations, position size, and risk more effectively while staying focused on the longer-term trend rather than short-term market noise.
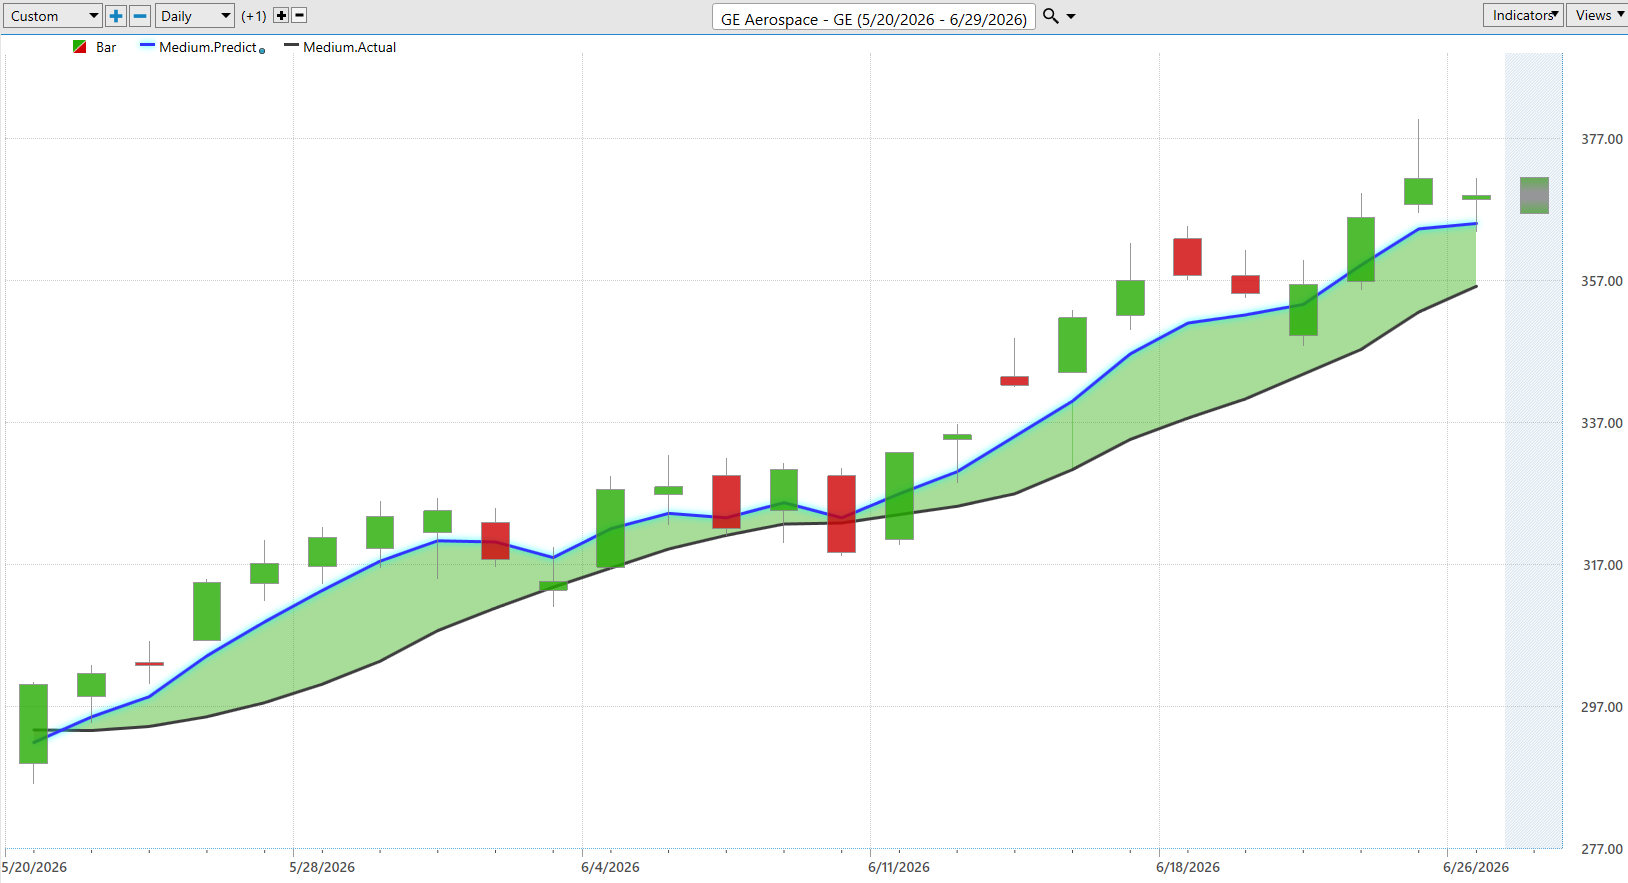
Price tells you where a stock has been. The Predictive Blue Line attempts to identify where momentum is headed next. Rather than reacting to yesterday’s news, it measures whether the underlying trend is strengthening or weakening before those changes become obvious on the price chart.
The attached Predictive Blue Line graphic remains firmly bullish. The indicator continues trending higher alongside GE’s rising share price, suggesting the stock’s upward momentum remains intact. When the Predictive Blue Line rises in concert with price, it often indicates that buyers continue controlling the intermediate-term trend rather than simply reacting to short-term news.
This signal also aligns with GE’s strong fundamentals. Improving earnings, expanding margins, and persistent outperformance versus the major market averages are being confirmed by positive price momentum. When technical signals and business fundamentals point in the same direction, traders gain greater confidence that the prevailing trend has a higher probability of continuing.
While the Predictive Blue Line focuses on the direction of the trend, the Neural Index measures the probability of that trend continuing over the next 48 to 72 hours. Think of it as an early warning system. It doesn’t predict the size of the next move—it estimates whether buyers or sellers currently hold the short-term advantage.
The attached Neural Index remains in a positive configuration, indicating that buyers continue to control the near-term outlook. This is particularly encouraging because it confirms the bullish message already being sent by the Predictive Blue Line. When both indicators agree, traders gain a higher level of confidence that the prevailing trend remains intact.
This confirmation also aligns with GE’s strong relative performance. The stock continues outperforming every major U.S. equity benchmark while trading near its 52-week high. When improving fundamentals, strong price action, and predictive indicators all point in the same direction, the probabilities generally shift in favor of the existing trend rather than a reversal.
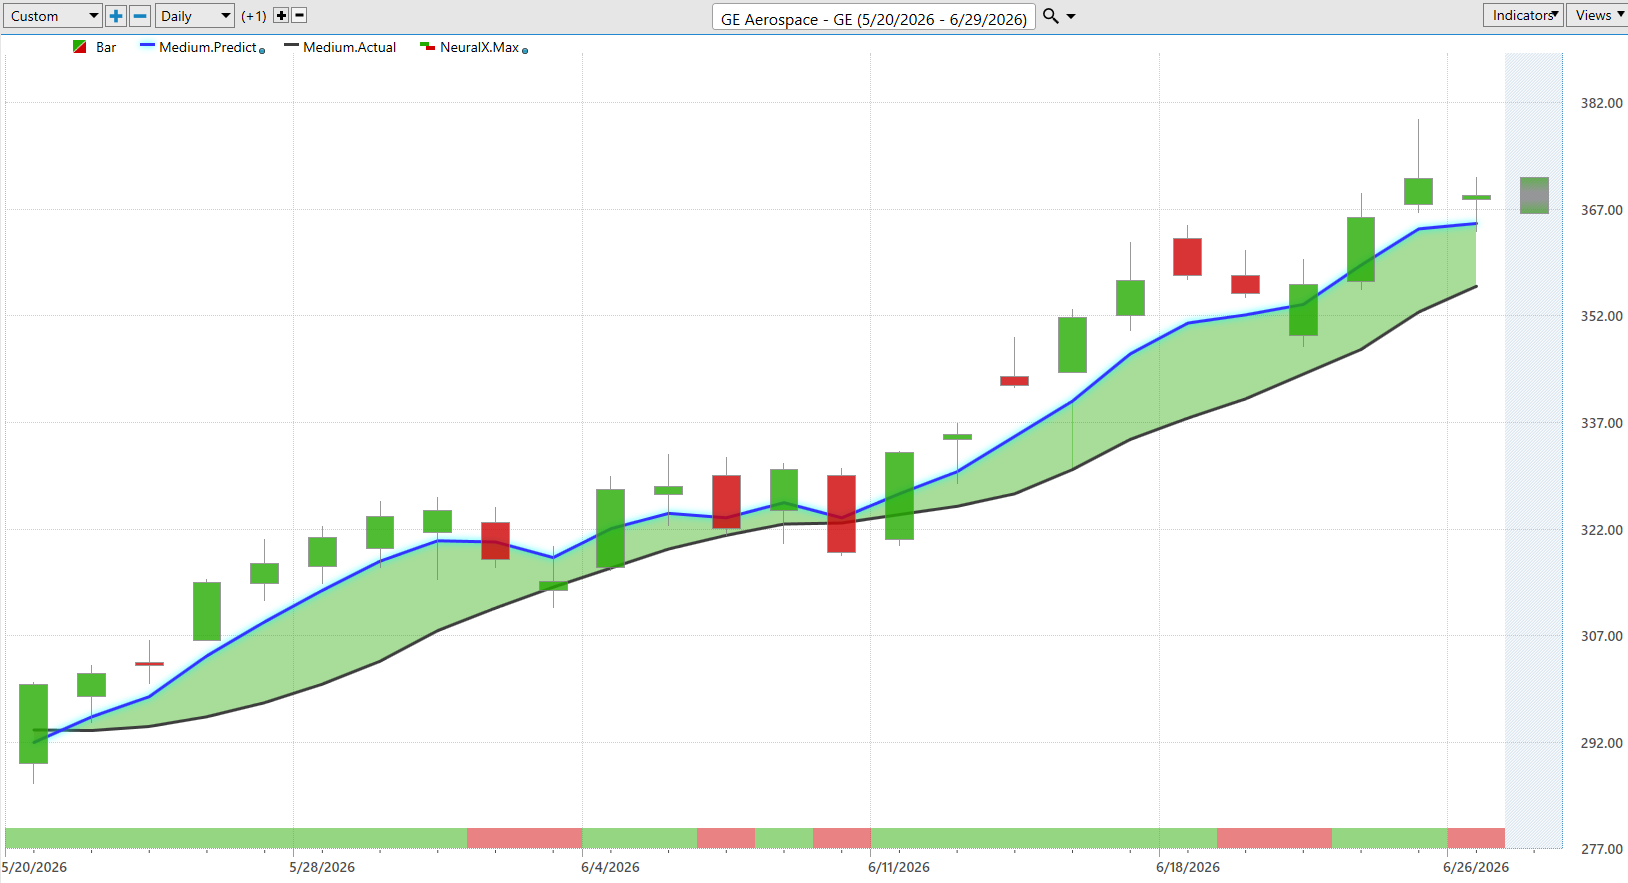
Of course, probabilities are never guarantees. The Neural Index can change quickly as new market information emerges. But based on its current reading, the short-term outlook continues to favor the bulls, suggesting GE remains one of the stronger names for traders looking to align themselves with momentum rather than fight it.
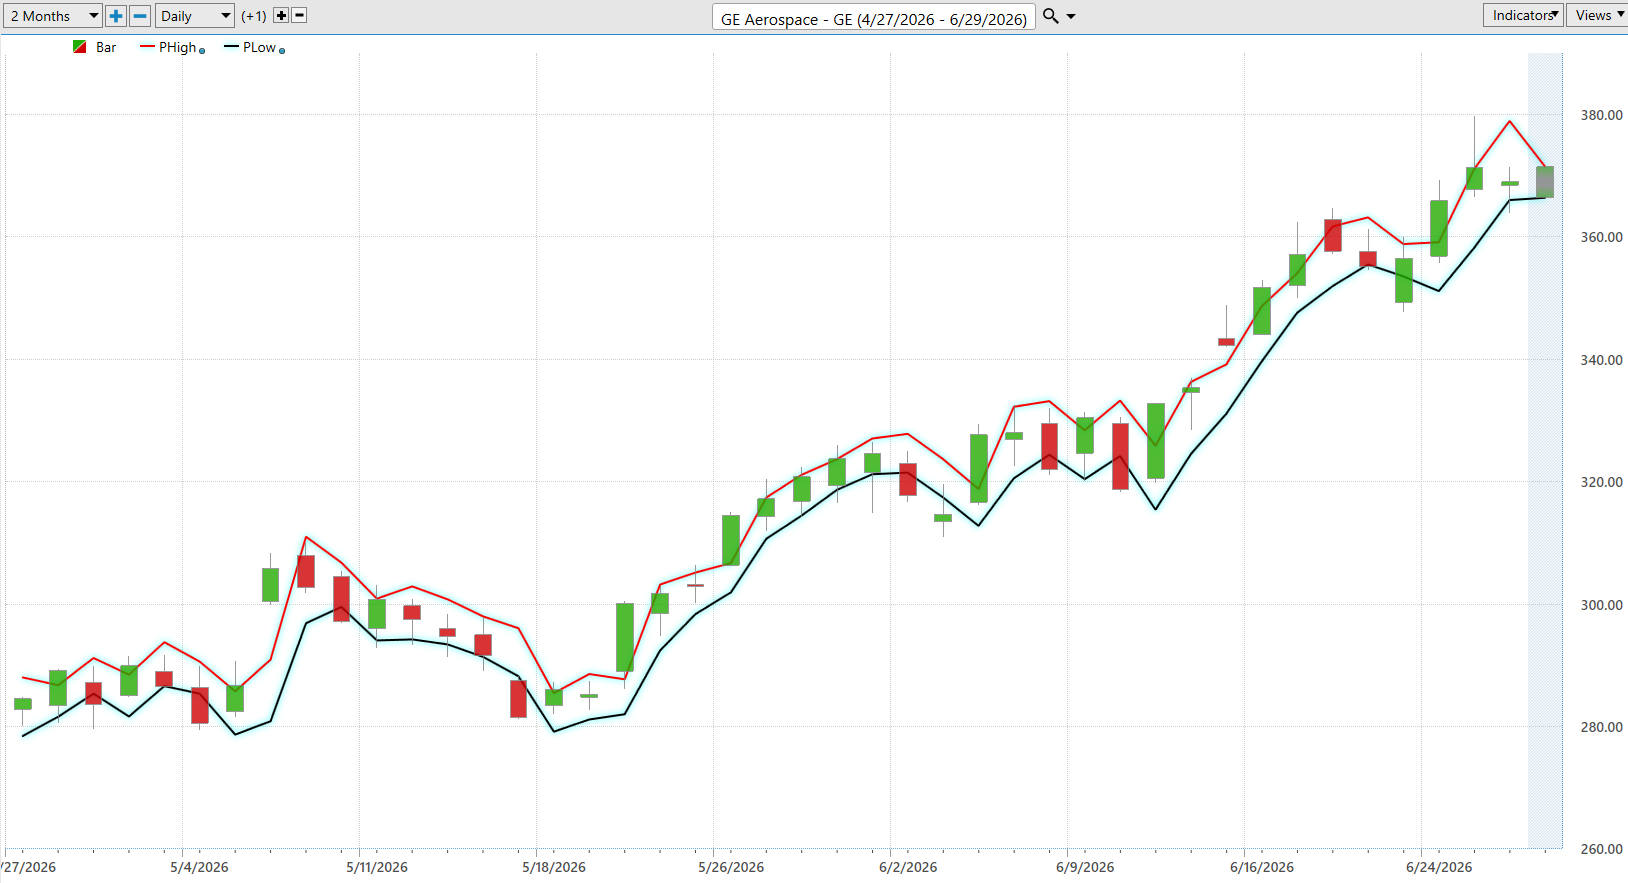
The Daily Range Forecast continues to support GE Aerospace’s bullish intermediate-term outlook. Both the predicted high and predicted low have been trending steadily higher throughout the past two months, confirming that the market continues to assign progressively higher value to the stock. More importantly, price has respected these predictive boundaries with remarkable consistency, suggesting buyers remain firmly in control. Rather than accelerating into an unsustainable advance, GE has been stair-stepping higher, pausing briefly before resuming its climb—a pattern that often characterizes healthy institutional accumulation.
Looking ahead, traders should pay close attention to the forecasted trading range rather than focusing solely on the next closing price. As long as the projected high and projected low continue advancing together, the prevailing uptrend remains intact and pullbacks toward the lower end of the forecast range may present favorable buying opportunities. A decisive break below the projected low would be the first indication that momentum is beginning to weaken, while continued closes near the upper portion of the projected range would reinforce the bullish outlook. For now, the Daily Range Forecast suggests the path of least resistance remains higher, with buyers continuing to control both the short-term and intermediate-term trend.
GE Aerospace continues to demonstrate the qualities institutional investors look for in a long-term market leader: accelerating revenue, strong profitability, expanding cash flow, and a business model built around decades of recurring service revenue. Commercial aviation demand remains healthy, defense spending continues to provide an additional tailwind, and management has maintained a disciplined focus on operational execution following the company’s transformation into a pure-play aerospace business. Technically, the picture remains equally constructive. GE is trading near its 52-week high, outperforming every major U.S. equity benchmark, while the Predictive Blue Line, Neural Index, and Daily Range Forecast all continue supporting the prevailing uptrend.
Our outlook remains constructive, but disciplined. After a strong advance, periods of consolidation and profit-taking should be expected, particularly if earnings expectations become overly optimistic or broader market conditions deteriorate. However, as long as GE continues delivering consistent financial results and the predictive indicators remain aligned, the longer-term trend continues to favor the bulls. Investors should resist the temptation to chase extended rallies and instead look for high-probability opportunities that develop during normal pullbacks within the broader uptrend, always managing risk with the understanding that preserving capital is just as important as growing it.
Use the VantagePoint Daily Range Forecast to isolate short term trading opportunities.
Practice great money management on all of your trades.
Ready to learn more about forecasting stocks and options days before anyone else with up to 87.4% proven accuracy? Attend a FREE LIVE CLASS.
Let’s Be Careful Out There.
It’s not magic.
It’s machine learning.
THERE IS A SUBSTANTIAL RISK OF LOSS ASSOCIATED WITH TRADING. ONLY RISK CAPITAL SHOULD BE USED TO TRADE. TRADING STOCKS, FUTURES, OPTIONS, FOREX, AND ETFs IS NOT SUITABLE FOR EVERYONE.IMPORTANT NOTICE!
DISCLAIMER: STOCKS, FUTURES, OPTIONS, ETFs AND CURRENCY TRADING ALL HAVE LARGE POTENTIAL REWARDS, BUT THEY ALSO HAVE LARGE POTENTIAL RISK. YOU MUST BE AWARE OF THE RISKS AND BE WILLING TO ACCEPT THEM IN ORDER TO INVEST IN THESE MARKETS. DON’T TRADE WITH MONEY YOU CAN’T AFFORD TO LOSE. THIS ARTICLE AND WEBSITE IS NEITHER A SOLICITATION NOR AN OFFER TO BUY/SELL FUTURES, OPTIONS, STOCKS, OR CURRENCIES. NO REPRESENTATION IS BEING MADE THAT ANY ACCOUNT WILL OR IS LIKELY TO ACHIEVE PROFITS OR LOSSES SIMILAR TO THOSE DISCUSSED ON THIS ARTICLE OR WEBSITE. THE PAST PERFORMANCE OF ANY TRADING SYSTEM OR METHODOLOGY IS NOT NECESSARILY INDICATIVE OF FUTURE RESULTS. CFTC RULE 4.41 – HYPOTHETICAL OR SIMULATED PERFORMANCE RESULTS HAVE CERTAIN LIMITATIONS. UNLIKE AN ACTUAL PERFORMANCE RECORD, SIMULATED RESULTS DO NOT REPRESENT ACTUAL TRADING. ALSO, SINCE THE TRADES HAVE NOT BEEN EXECUTED, THE RESULTS MAY HAVE UNDER-OR-OVER COMPENSATED FOR THE IMPACT, IF ANY, OF CERTAIN MARKET FACTORS, SUCH AS LACK OF LIQUIDITY. SIMULATED TRADING PROGRAMS IN GENERAL ARE ALSO SUBJECT TO THE FACT THAT THEY ARE DESIGNED WITH THE BENEFIT OF HINDSIGHT. NO REPRESENTATION IS BEING MADE THAT ANY ACCOUNT WILL OR IS LIKELY TO ACHIEVE PROFIT OR LOSSES SIMILAR TO THOSE SHOWN.


