






This week’s AI stock spotlight is Five Below ($FIVE)
Five Below began in 2002 when David Schlessinger and Tom Vellios built a store around a beautifully simple idea: young people like cool stuff, parents like cheap stuff, and everybody enjoys believing they got a bargain. The company evolved from the original “five dollars or less” concept into a broader extreme-value retailer, including merchandise above $5, without abandoning its treasure-hunt personality. It survived the pandemic, expanded e-commerce, endured a nasty merchandising slowdown, changed CEOs, and then rediscovered growth under Winnie Park, who took over in December 2024. Today Five Below has more than 2,000 stores in 47 states. It matters to traders because this formerly wounded growth retailer has turned into one of retail’s more interesting comeback stories, and Wall Street is now debating whether the comeback has become a genuine transformation.
Five Below sells inexpensive merchandise aimed heavily at kids, teens, families, and adults who occasionally discover they urgently require a miniature basketball hoop, candy the color of nuclear waste, or a Bluetooth gadget they did not know existed five minutes earlier. Most products remain between $1 and $5, although the company now sells higher-priced value merchandise as well. Its merchandise categories include Candy, Style, Party, Room, Create, Tech, Sports and New & Now.
Financially, the business can be viewed in three broad merchandise groups. On a trailing basis, Leisure is the biggest, at roughly $2.3 billion, followed by Fashion and Home at roughly $1.54 billion and Snack and Seasonal at approximately $1.23 billion. The trick is not merely selling cheap merchandise. The trick is constantly finding new merchandise that makes customers come back to see what has changed. A stale Five Below is just a warehouse full of plastic. A good Five Below is a treasure hunt with a cash register.
The company is headquartered in Philadelphia and is led by CEO Winnie Park. $FIVE currently lists approximately 24,600 employees. Park brought more than three decades of retail experience, including CEO roles at Forever 21 and Paper Source. Competitors range from Dollar Tree and Dollar General to Walmart, Target, TJX and specialty retailers competing for the same discretionary dollar. Five Below’s distinction is that it combines value with novelty. Dollar stores sell things you need cheaply. Five Below would prefer to sell you things you suddenly decide you need.
The financial history explains why Wall Street has become interested again. Revenue has marched upward remarkably consistently, while earnings have been bumpier. That distinction matters. Opening stores can manufacture revenue growth. Producing more profit from those stores is what proves the machine actually works.
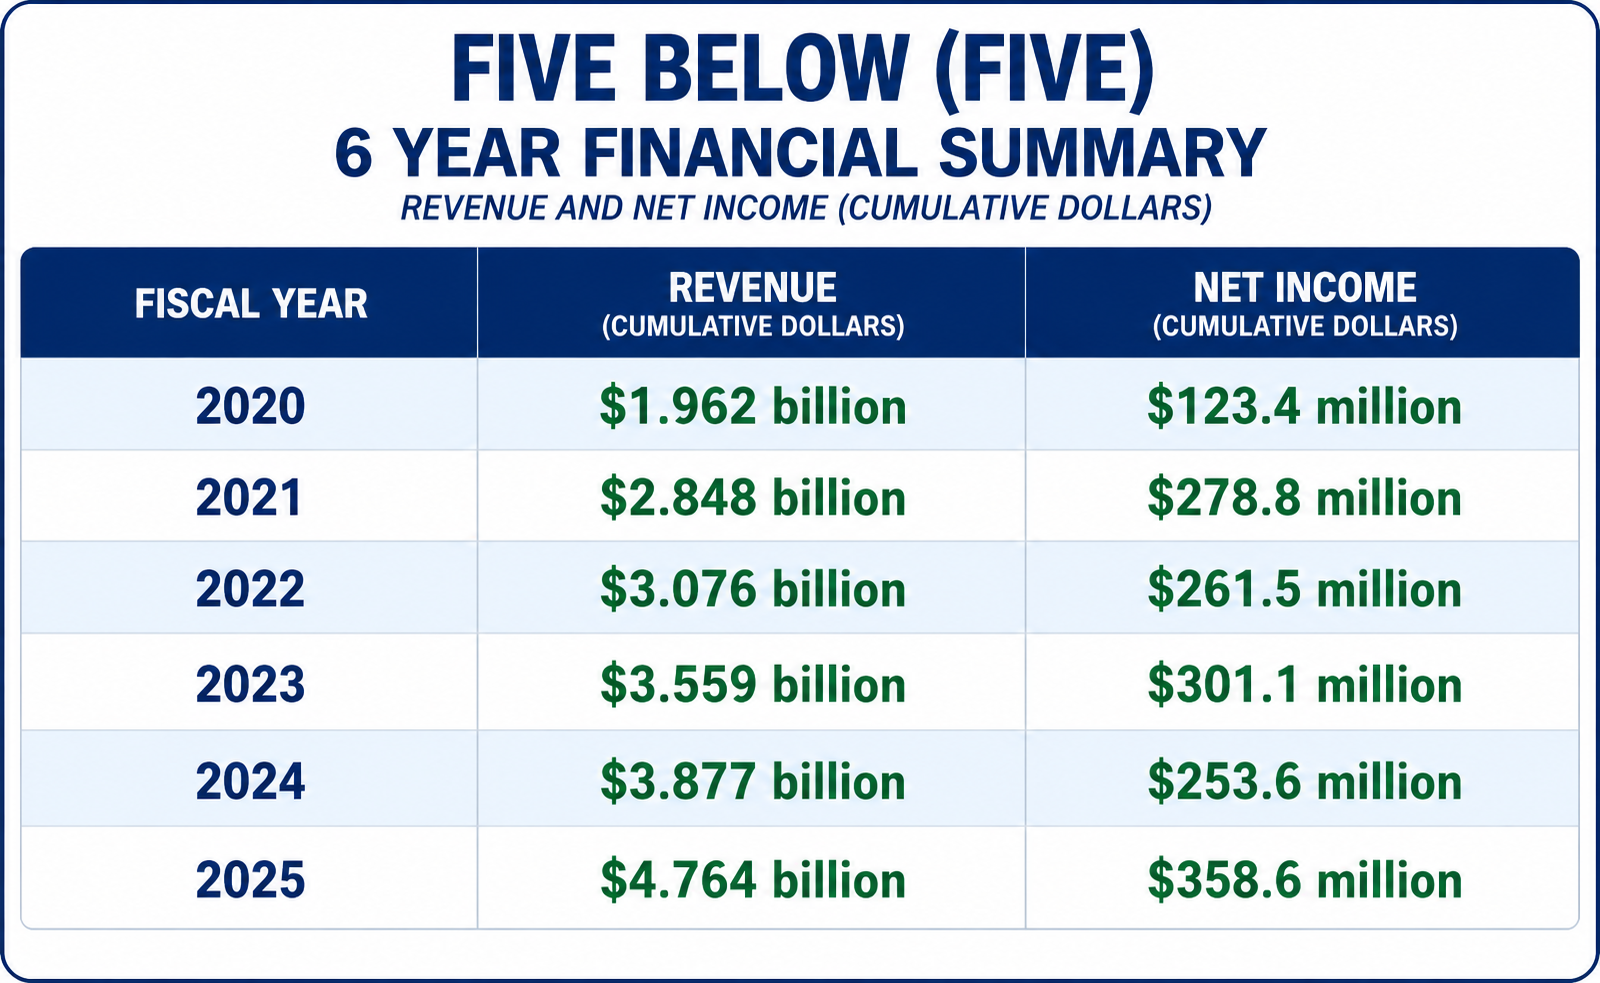 The numbers tell a simple story: Five Below knows how to grow sales, but profits have taken the scenic route. Revenue climbed from $1.96 billion in 2020 to $4.76 billion in 2025, an increase of roughly 143%, while net income rose from $123.4 million to $358.6 million, nearly tripling. But notice the bumps. Earnings slipped in 2022 and again in 2024 even as revenue kept climbing, telling traders that more stores and more sales do not automatically mean better profitability. The encouraging part is 2025: revenue jumped sharply and net income surged 41%, suggesting that Five Below may finally be turning its expanding sales machine into substantially more bottom-line profit.
Traders are really asking two questions now. First, was the extraordinary recent comparable-sales growth temporary, driven partly by viral merchandise, easy comparisons and hot products, or has management permanently improved merchandising and store execution? Second, how much of that improvement is already reflected in the stock price? Those are considerably more useful questions than asking whether children will continue buying candy.
The evidence supporting the bulls is impressive. First-quarter fiscal 2026 sales jumped 32.5% to $1.286 billion. Comparable sales increased an extraordinary 22.7%. Operating income rose to $154.2 million from $50.8 million, and net income increased to $123.1 million from $41.1 million. Management consequently raised its full-year outlook to $5.40 billion to $5.48 billion in sales and $480 million to $502 million in net income. That is not merely a good quarter. That is the sort of quarter that forces analysts to reopen their spreadsheets and discover that yesterday’s price target has become today’s embarrassment.
The most important news of the last 30 days has therefore been less about corporate press releases and more about Wall Street changing its opinion. Jefferies recently upgraded Five Below to Buy and reportedly raised its target from $210 to $350, arguing that the improvement is structural rather than merely the result of viral products. Mizuho also raised its target to $260 from $220. Reports have highlighted strong back-to-school demand, improving store traffic and Five Below’s ability to capitalize on popular intellectual property and social-media trends.
Some of this optimism is obviously priced in. Through August 24, FIVE had gained approximately 17.3% over three months and 36.6% year to date. The SPDR S&P Retail ETF, XRT, gained only about 7.6% over the comparable three-month period and roughly 4.2% year to date. FIVE is not merely participating in a retail rally. It is mugging the retail index and taking its lunch money.
Why? Earnings acceleration, huge comparable-sales growth, improving margins, stronger cash generation, successful merchandising and the belief that Winnie Park’s turnaround is becoming repeatable. The viral merchandise helped get attention, but the stock’s continued strength suggests investors increasingly believe there is a better operating system underneath the toys.
That is also where Wall Street could be wrong. Analysts have a charming habit of discovering “structural improvement” after a stock has already doubled or tripled. The stock now trades around 30 times trailing earnings and the high-20s on forward estimates. At those multiples, “pretty good” can become disappointing very quickly.
The upside opportunity is straightforward. If comparable sales remain materially positive while store expansion continues and margins hold, earnings could grow faster than the market currently expects. Five Below has demonstrated that its store concept still has room to expand, recently passing 2,000 locations, and management continues to describe substantial geographic white space. The biggest upside surprise would be evidence that double-digit or near-double-digit comparable growth persists after the viral-product comparisons become tougher. That would support the argument that the company has genuinely changed.
The biggest risk is exactly the same thing wearing a fake mustache. Expectations are high. Management guided second-quarter comparable sales growth to approximately 7% to 9%, dramatically below Q1’s 22.7%, although still excellent by ordinary retail standards. If traffic weakens, hot products fade, tariffs squeeze merchandise margins, or management guides cautiously for the holidays, investors may suddenly remember that they are paying a growth-stock valuation for a retailer selling inexpensive merchandise.
The catalyst calendar is unusually simple. September 2, 2026 is the big one: second-quarter results after the close, followed by the 4:30 p.m. ET conference call. September 15 brings CEO Winnie Park and CFO Dan Sullivan to the Goldman Sachs Global Consumer and Retail Conference. There is also a CFO appearance at Barclays on September 9. Earnings matter most because traders will finally discover whether the spectacular first quarter was an opening act or the whole fireworks show. The conferences matter because management will get an early opportunity to discuss trends following the report.
The company is performing extremely well. The stock knows it. That means the risk is no longer whether Five Below can recover. The risk is whether the business can improve quickly enough to justify what traders are already paying for that recovery.
FIVE therefore looks best suited to momentum and growth traders comfortable with volatility, not bargain hunters searching the clearance rack. The trend can continue if comparable sales remain healthy, traffic stays strong, margins hold and management demonstrates that the merchandising improvement is repeatable rather than fashionable.
The early warning sign is simple: watch comparable sales and margins before listening to the story. If those weaken together, especially alongside cautious guidance, respect the message. Retail fashions change quickly. Wall Street fashions change faster. And at roughly 30 times earnings, Five Below may sell cheap merchandise, but nobody should confuse the stock itself with something from the five-dollar bin.
Wall Street Analysts Annual Forecasts
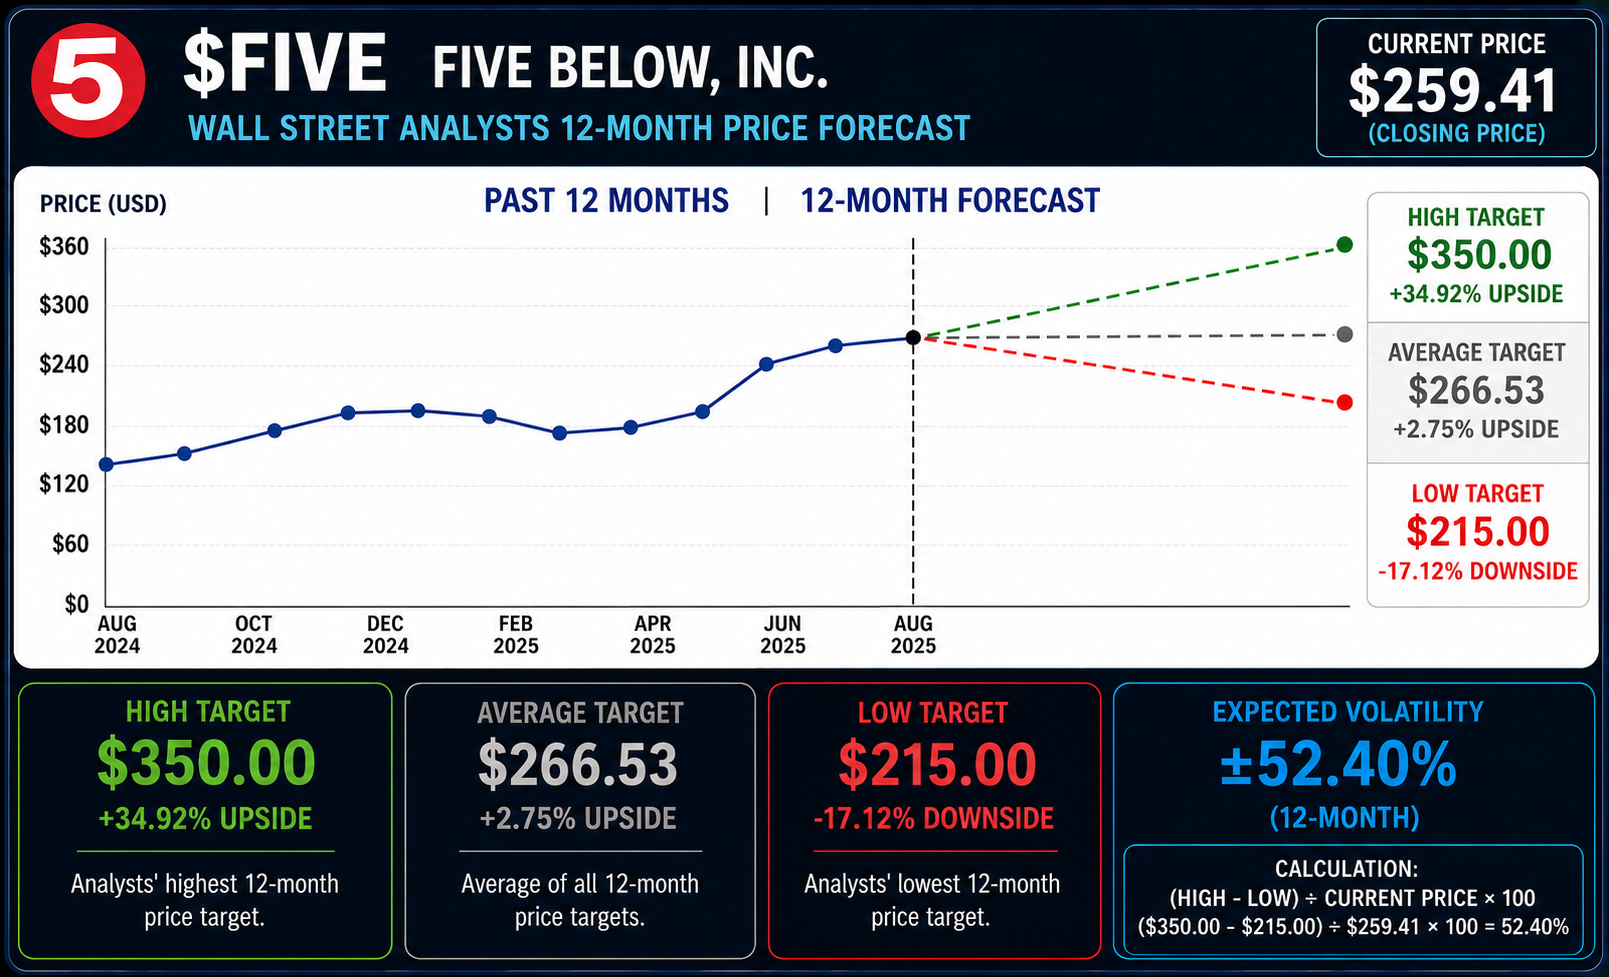
Before deciding whether to be bullish or bearish on Five Below, it helps to see what Wall Street’s professional fortune-tellers are saying. These analysts watch FIVE constantly, study the financial statements, question management and then somehow arrive at answers separated by $135. The most bullish target is $350. The most bearish is $215. With FIVE closing at $259.41, that is an enormous range of opinion. Wall Street is not confused about whether Five Below sells inexpensive merchandise. It is confused about how much investors should pay for the company’s growth. That disagreement is valuable because volatility becomes less abstract when the people paid to understand the company cannot agree on what it is worth.
The math makes the disagreement impossible to ignore. Take the $350 high target, subtract the $215 low target, and divide the $135 difference by the current $259.41 price. You get an analyst-disagreement reading of approximately 52.4%. Meanwhile, the average analyst target of $266.53 sits only about 2.7% above the current price. That may be the most important number on the page. FIVE has rallied so aggressively that the stock has nearly caught Wall Street’s consensus forecast. The analysts are no longer debating whether the turnaround has happened. They are debating how much good news is already baked into the price.
For traders, that’s where things get interesting. FIVE has powerful momentum, improving fundamentals and exceptional relative strength, but the average analyst is effectively saying, “Wonderful company. Now what?” The opportunity lies in the enormous gap between consensus and the $350 bull case. Strong earnings, continued comparable-sales growth, improving margins and higher guidance could force analysts to raise targets and chase the stock upward. Disappointment could send the argument rapidly toward the bears because expectations are already high. This remains a momentum trader’s setup, but 52.4% disagreement among Wall Street analysts is a giant reminder that conviction and certainty are two entirely different things.
52 Week High and Low Boundaries Analysis
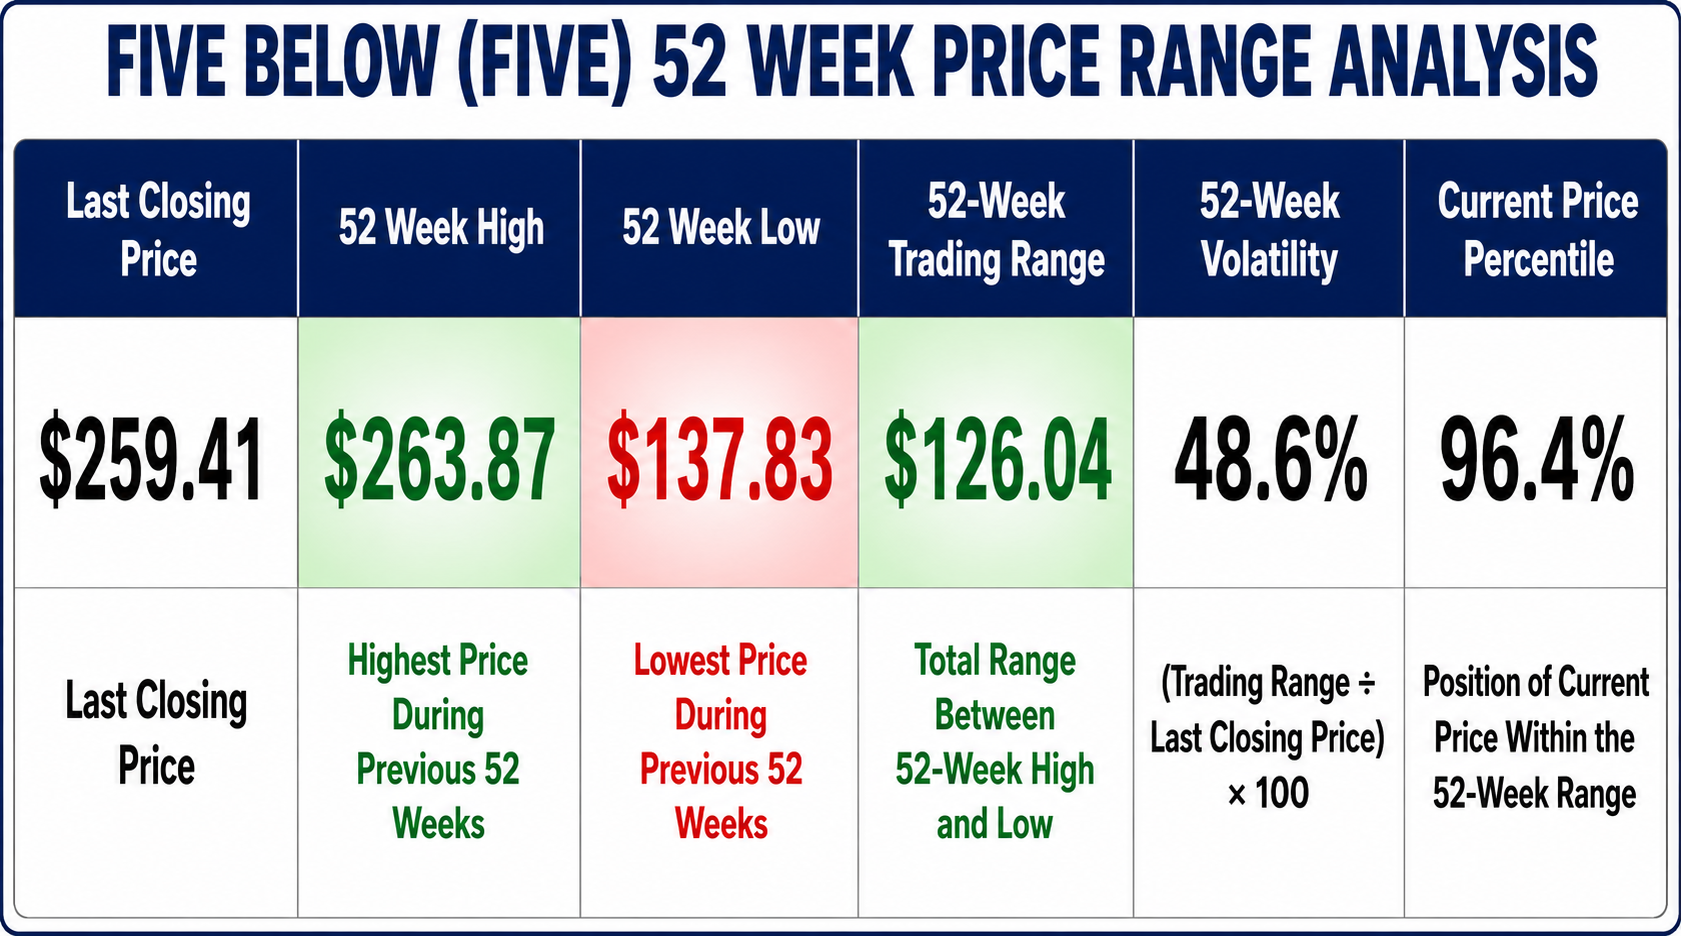
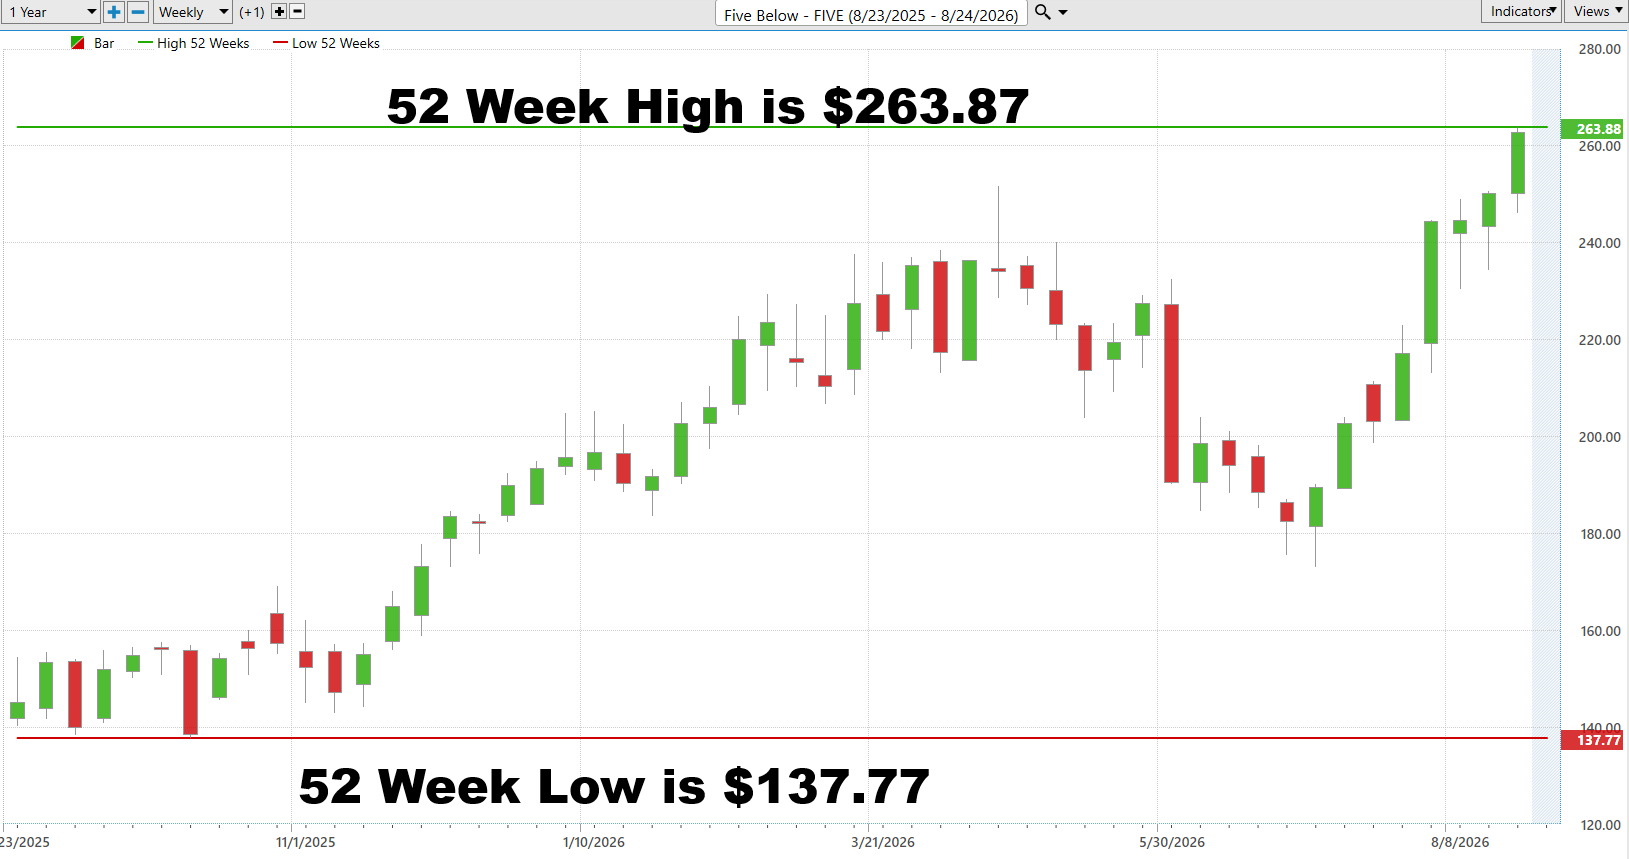
Another powerful way to understand volatility is to forget predictions and study what FIVE has already done. Over the past 52 weeks, the stock traveled from roughly $137.83 to $263.87, a massive $126.04 trading range. Divide that range by the current $259.41 price and you get a historical volatility proxy of 48.6%. Put simply, FIVE covered a distance equal to nearly half its current price during the past year. Today it sits in the 96.4th percentile of that range, just $4.46 below its 52-week high. That tells you immediately where the pressure is. Buyers are in control, momentum is strong, and FIVE is behaving like a leader.
The midpoint of the 52-week range is approximately $200.85. What matters is what happened next. FIVE broke away from that middle zone and marched toward the top of its range. If we use the stock’s 48.6% historical volatility as a rough stress test and apply it around the $200.85 midpoint, we get extreme theoretical boundaries of roughly $298 and $103. Those are not forecasts. They simply remind us that this stock has demonstrated an ability to travel a very long distance when momentum gets moving.
Now comes the part traders need to respect. FIVE is strong, but strength and safety are not the same thing. At the 96th percentile of its annual range, you’re buying very close to territory where every buyer over the previous year has eventually stopped buying. A clean breakout above $263.87 would put FIVE into new 52-week-high territory and confirm that the trend remains intact. A rejection at the highs followed by sustained weakness would tell us something has changed, with the $200.85 midpoint becoming an important longer-term reference point. For momentum traders, the setup remains attractive because price is doing exactly what strong stocks are supposed to do. But with a 48.6% historical range, risk management is not optional. The trend says stay interested. The volatility says stay disciplined.
Best-Case/Worst-Case Analysis
Five Below has been teaching traders an expensive lesson: a powerful trend does not travel in a straight line. The best-case chart shows repeated advances of roughly 13% to 52%, while the worst-case chart shows corrections ranging from about 10% to 25%. That is the personality of FIVE. When buyers take control, they can move this stock a long way. But when momentum breaks, the exits can get crowded quickly.
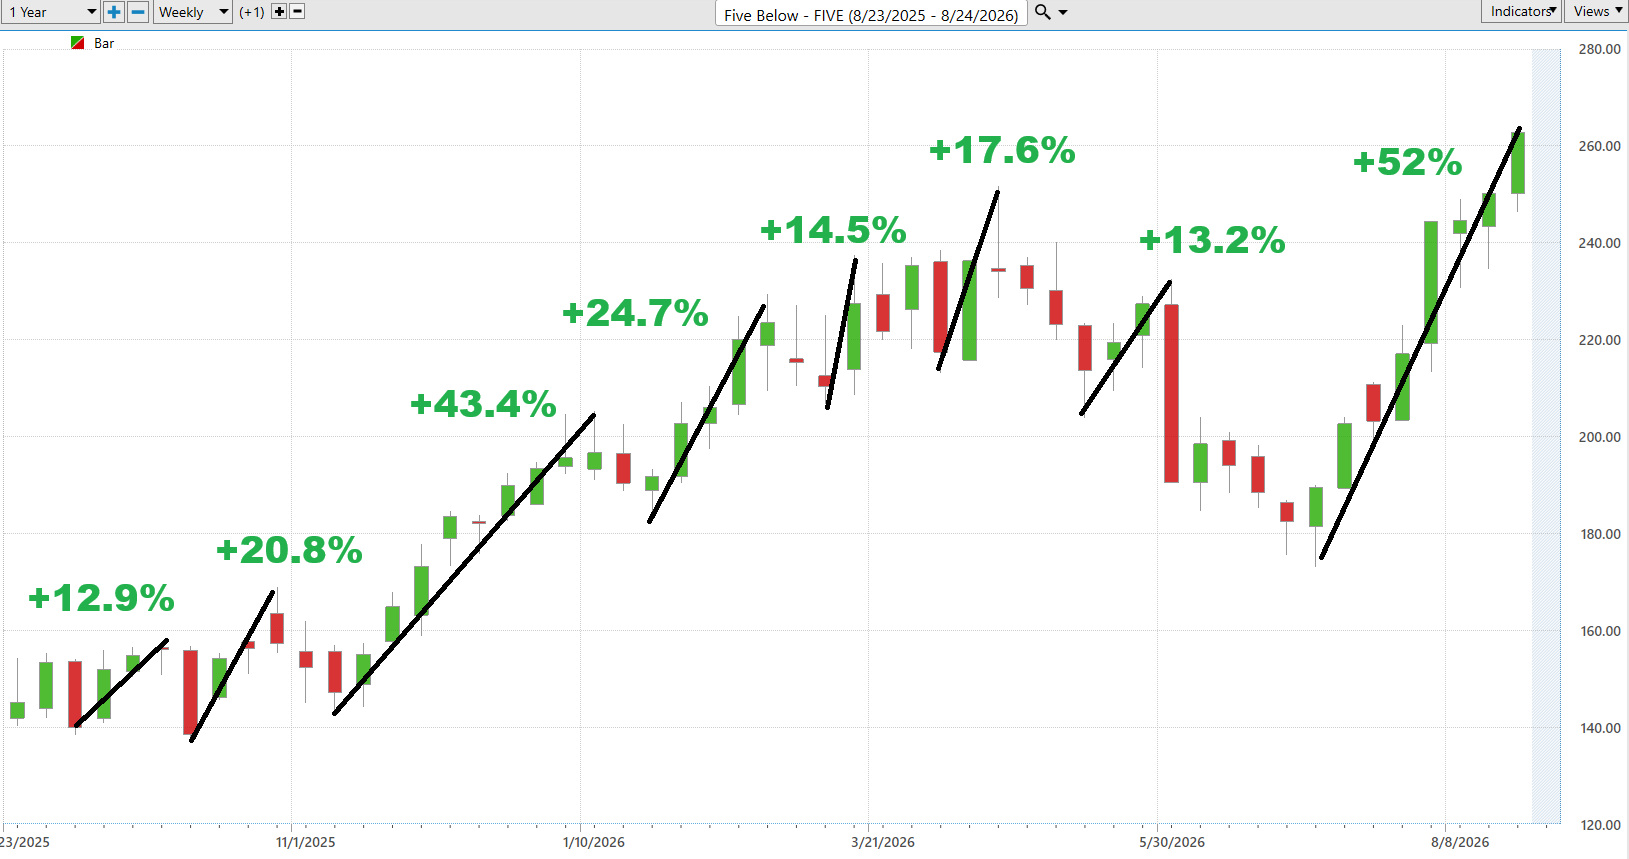
FIVE has rallied from roughly the mid-$170s to above $260 in its latest major advance, approximately 52%, the strongest advance highlighted on the chart. More important than any single percentage is the pattern: the stock has repeatedly recovered from corrections and gone on to establish higher price territory. Earlier advances on the chart ranged from approximately 13% to 43%, demonstrating that FIVE has historically rewarded traders who recognize when momentum has reasserted itself. With the stock now challenging its 52-week high near $263.87, a decisive breakout would tell us buyers are still willing to pay up. There is no historical resistance above a fresh 52-week high. That opens the door to price discovery.
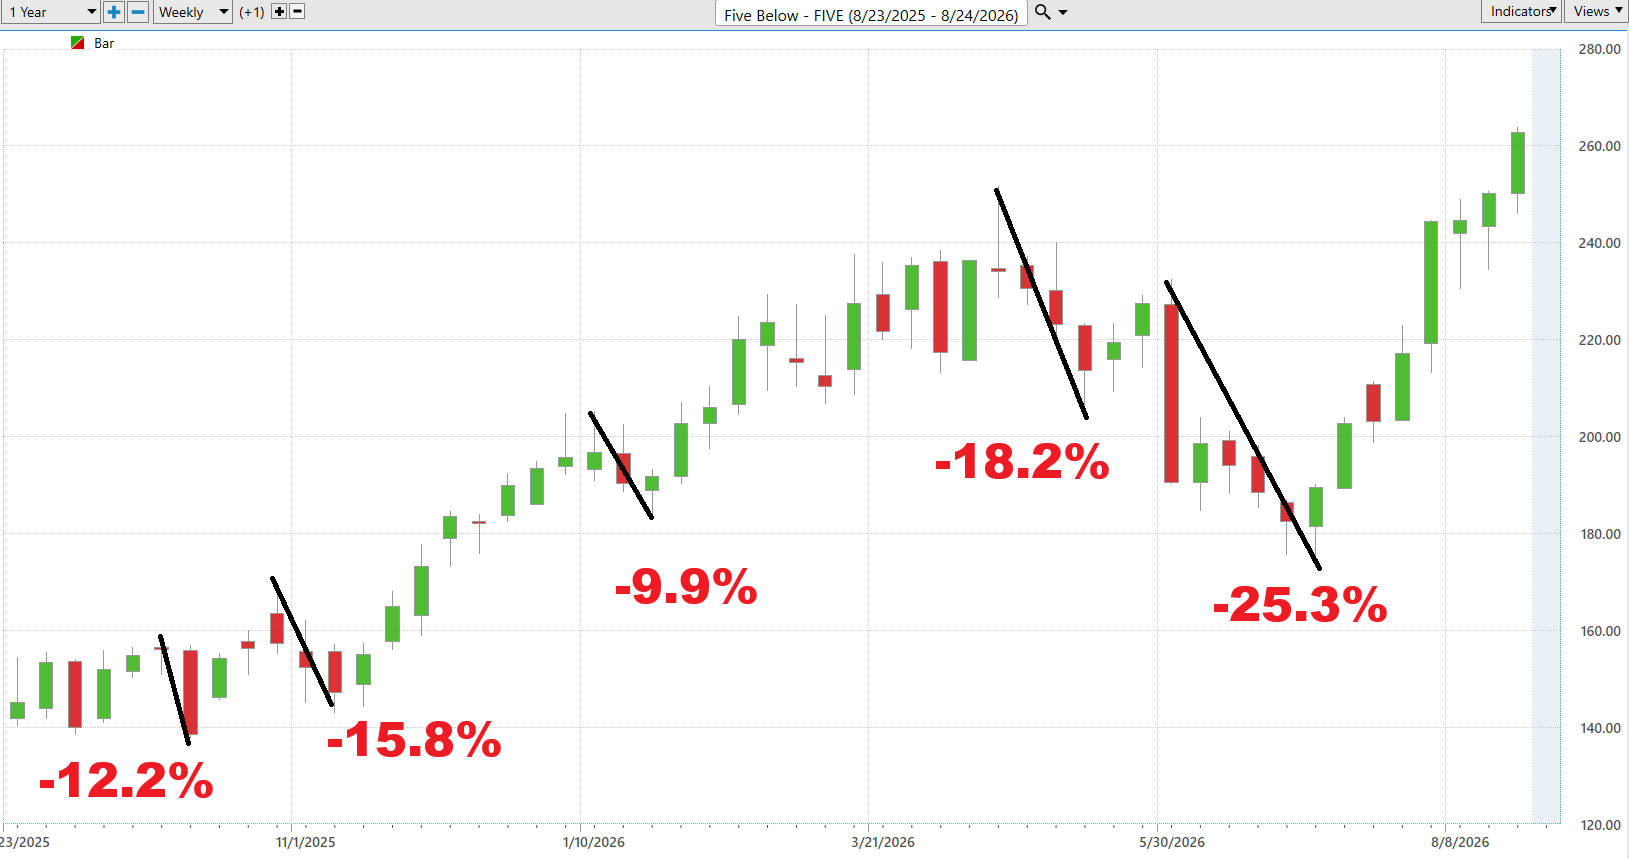
But here’s what the bulls cannot afford to ignore. FIVE bites. The worst-case chart shows several meaningful corrections, ranging between 10% and 25%. The important lesson is not whether the next correction will be 10% or 25%. Nobody knows. The lesson is that double-digit declines have been a normal part of owning this trend. Most revealing was the roughly 25% correction before the latest rally. The stock got hit hard, found buyers, and then exploded higher. That tells traders two things at once: FIVE has tremendous recovery power, and tremendous downside volatility.
So here’s the line in the sand. As long as FIVE continues making higher highs and buyers aggressively defend meaningful pullbacks, the bulls own the field. A clean move above $263.87 strengthens that argument. The danger appears when the character changes: rallies become weaker, previous breakout areas fail to hold, and sellers begin producing lower highs and lower lows. That would tell us the stock is no longer merely correcting inside an uptrend. It may be transitioning into something more dangerous.
The biggest mistake here would be looking at FIVE near its highs and concluding that the stock is safe. It isn’t. Strength is not safety. The historical record on these charts says FIVE can deliver spectacular advances and painful corrections inside the same larger trend. Momentum traders have the advantage while price keeps confirming the bullish thesis, but they also need an exit plan before the market gives them a reason to use it.
That’s the trade in one sentence: respect the rocket, but remember what happens when the engine cuts out.

Five Below is not merely beating the market. It is separating from it. Over the past year, FIVE gained 84.65%, compared with 19.23% for the S&P 500, 21.92% for the Nasdaq, 18.32% for the Dow, and 28.68% for the Russell 2000. That is enormous relative strength. The important point is not simply that FIVE went up. It went up dramatically more than every major benchmark on this scoreboard. When a stock outperforms this broadly over a full year, traders should pay attention because institutional money is clearly treating it differently from the average stock.
The shorter time frames make the story even more interesting. FIVE is up 34.10% year to date, versus 11.94% for the S&P 500, and it has gained 25.20% in just the past month, compared with only 3.56% for the S&P. Over the latest week, FIVE added another 7.62% while the S&P fell 0.51%, the Nasdaq dropped 0.92%, and the Russell 2000 lost 0.86%. That’s exactly what traders want to see in a leader. The market gets soft, but the stock keeps attracting buyers. Even over six months, where the advantage is narrower, FIVE still leads every major benchmark shown.
The takeaway is simple: FIVE has relative strength across every measured time frame. Annual, six months, year to date, monthly and weekly, the stock beats the S&P 500 in every column. That does not mean chase it at any price. Strong stocks can correct hard, and FIVE’s own history proves that. But until this relative-strength pattern begins breaking down, the evidence says traders should treat weakness as something to study for opportunity rather than automatically assuming the run is over. Price is voting, and right now FIVE is winning the election by a landslide.
VantagePoint AI Predictive Blue Line
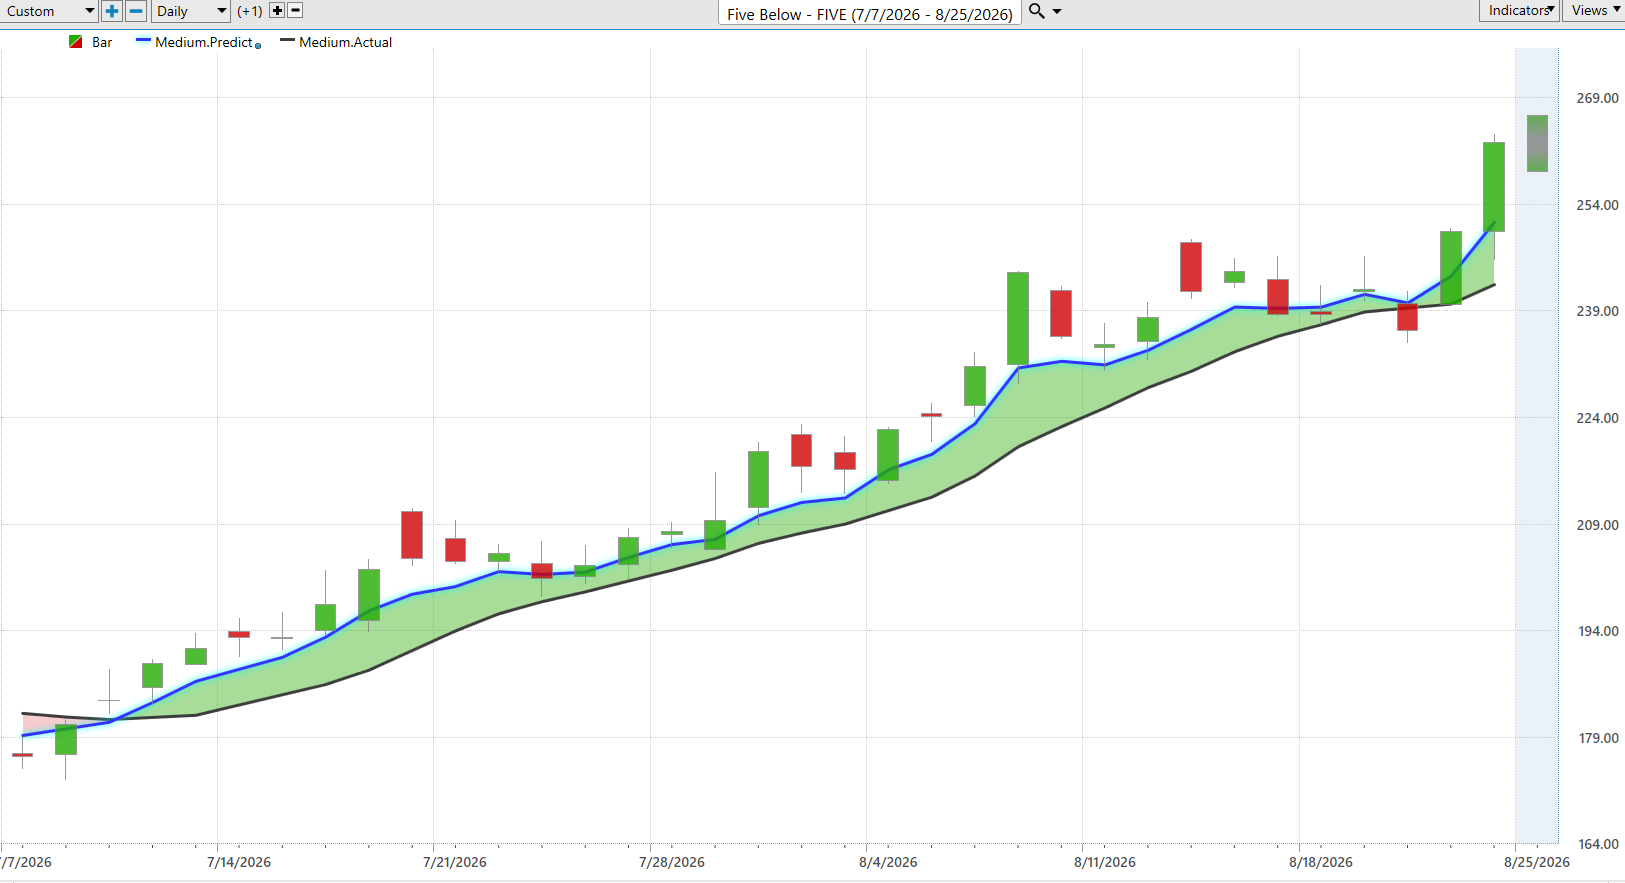
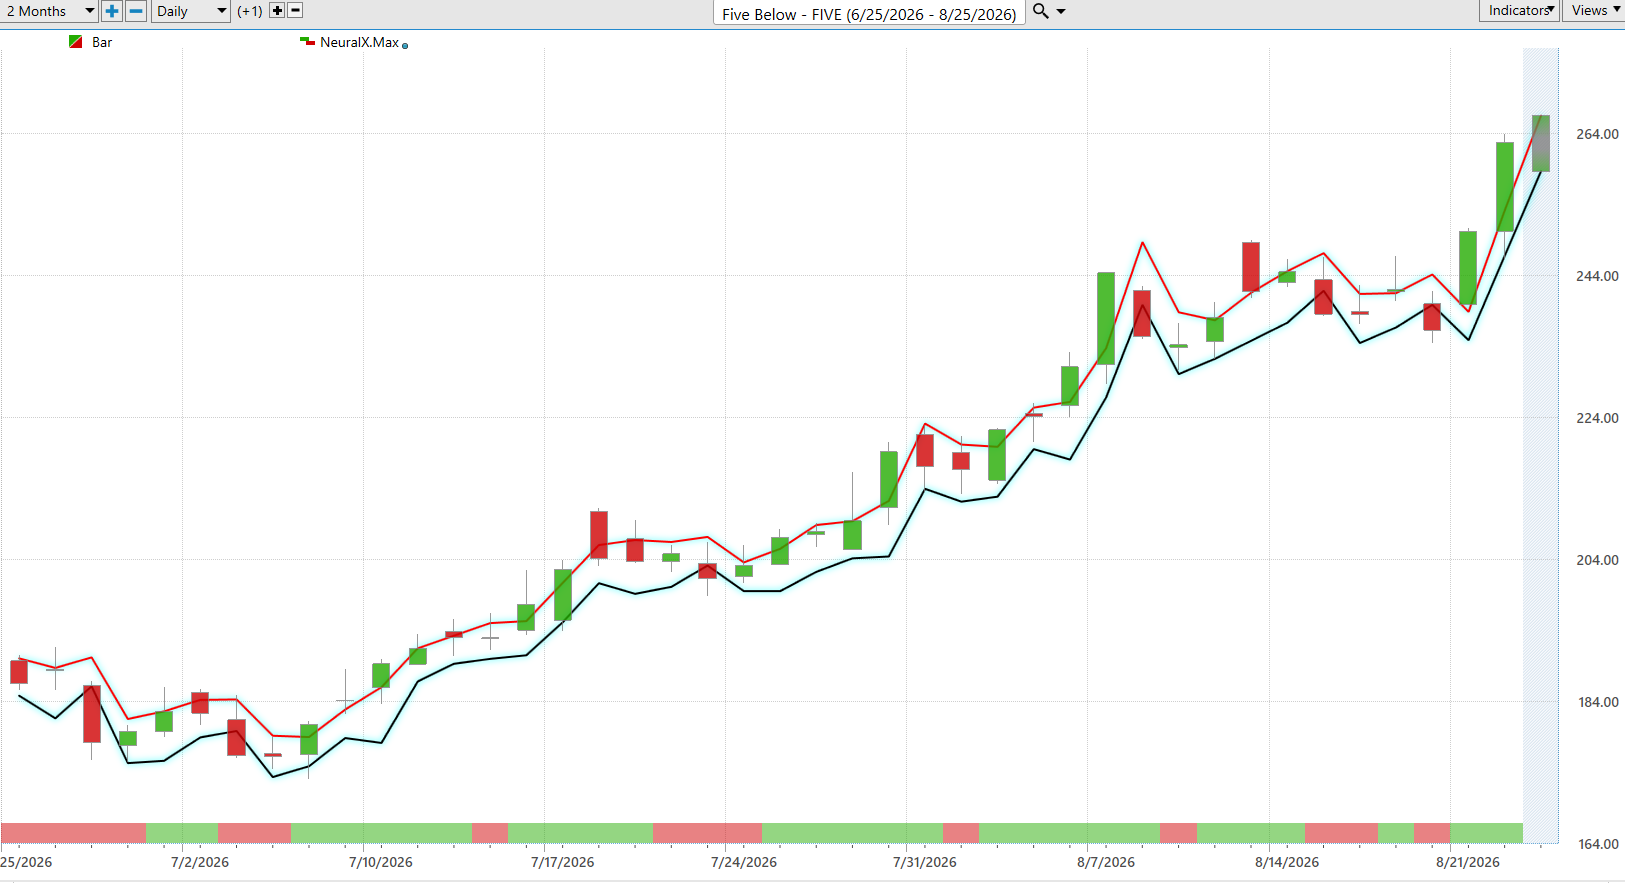
The Predictive Blue Line is telling us something traders should never ignore: the trend is up, and it has been up for weeks. The blue line represents VantagePoint’s predicted moving average, while the black line represents the actual moving average. When the blue line moves above the black line and both begin rising, the market is essentially putting up a big green road sign saying buyers have the advantage. On FIVE, that bullish relationship began early in July and has remained remarkably persistent. Price climbed from roughly the $180 area to above $260 while the Predictive Blue Line continued marching higher.
But here’s where this gets interesting. Watch the distance between the blue and black lines. When the blue line stays above the black line, the forecast is stronger than the recent historical trend. When that gap expands while both lines are rising, bullish momentum is accelerating. That’s exactly what we see on the right side of this chart. After a brief period of compression around the $239 area, the Predictive Blue Line turned sharply higher again and pulled away from the black line as FIVE exploded toward new highs. That is confirmation. The prediction is not fighting the price action. It is moving with it.
For traders, the message is simple: don’t argue with a rising Predictive Blue Line. As long as the blue line remains above the black line and its slope remains positive, the evidence favors the bulls and pullbacks deserve attention as potential opportunities rather than automatic reasons to sell. The first warning would be the blue line flattening while price struggles to advance. A stronger warning would be the blue line turning down and crossing beneath the black line. Until that happens, FIVE remains in a powerful predictive uptrend. The price is making new highs, the Predictive Blue Line is rising, and the indicators are confirming each other. That’s the kind of alignment traders want on their side.
VantagePoint AI Neural Index
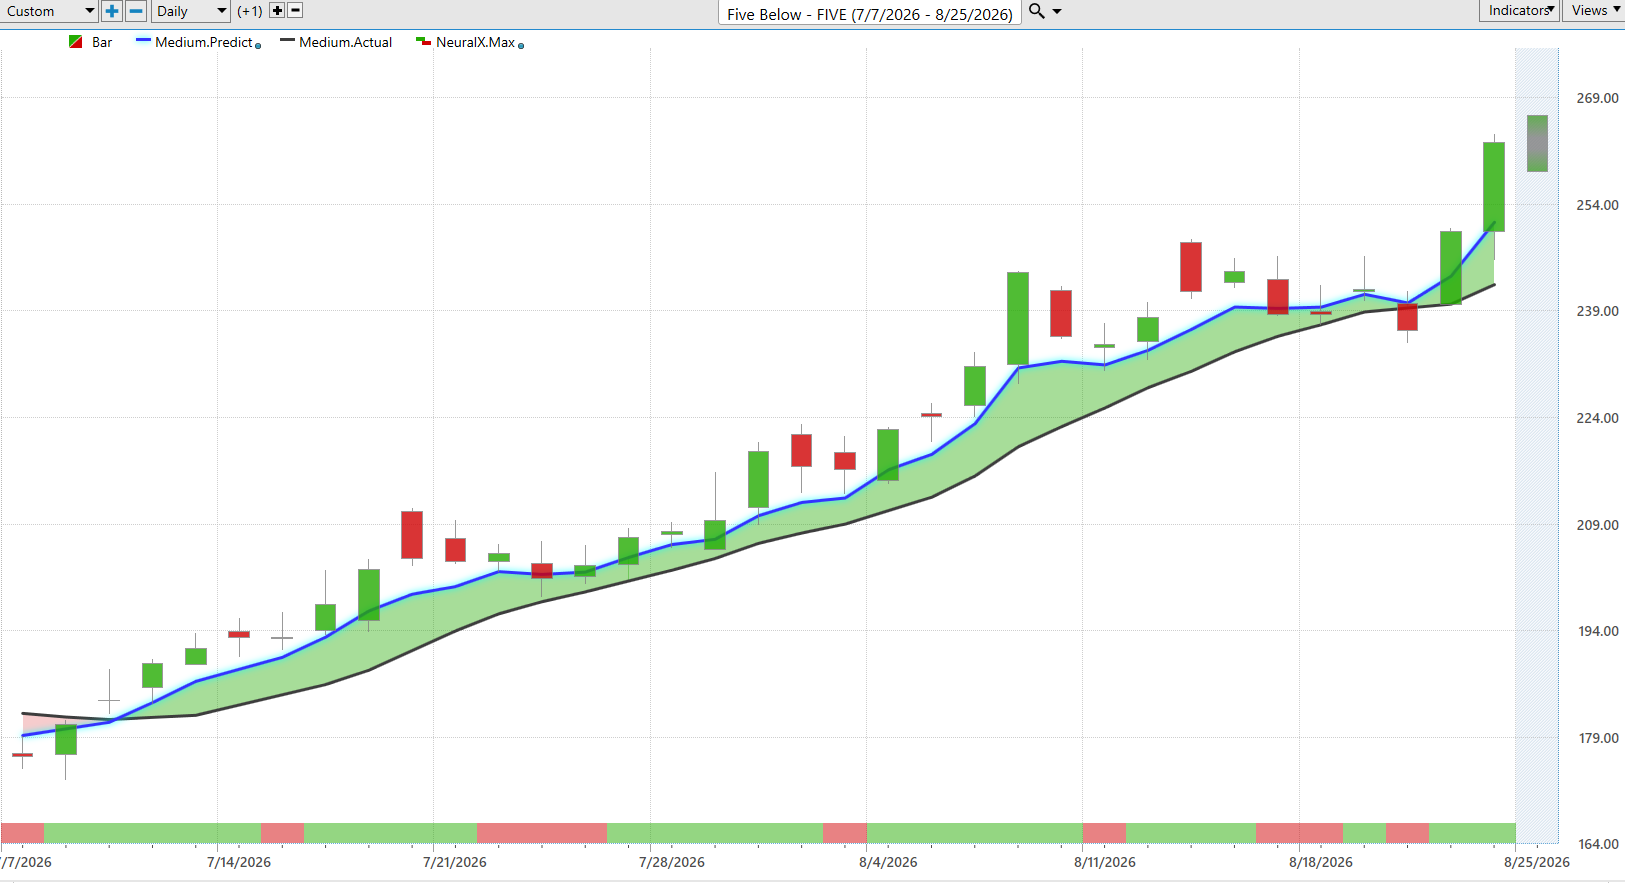
The Neural Index adds an important second layer to the FIVE story because it is designed to forecast short-term price strength or weakness over roughly the next 48 to 72 hours. Green signals indicate anticipated strength, while red signals warn of potential short-term weakness. That distinction matters. The Predictive Blue Line tells us the broader trend, while the Neural Index helps traders judge whether the immediate market conditions are confirming or contradicting that trend.
What stands out is how often the Neural Index turned temporarily bearish without destroying the larger advance. All of these signals were opportunities to position in $FIVE at better prices. FIVE experienced several red periods as the stock climbed from roughly $180 toward $260. Those signals often coincided with pauses or pullbacks, but the Predictive Blue Line generally remained above the black actual moving average and continued rising. That is an important lesson for traders. A red Neural Index inside a strong bullish trend is a warning about short-term weakness, not automatically a signal that the entire trend has reversed. The stronger message arrives when both indicators agree.
And right now, they agree. At the far right of the chart, the Neural Index is green, the Predictive Blue Line is rising sharply above the black line, and FIVE has surged into new high territory. That is what we call double confirmation. The longer-term predictive trend and the short-term forecast are pointing in the same bullish direction. Traders should still respect how extended the stock has become, but until the Neural Index turns red and the Predictive Blue Line begins flattening or rolling over, the artificial intelligence is telling us the same thing price is telling us: the buyers still have control.
VantagePoint AI Daily Range Forecast
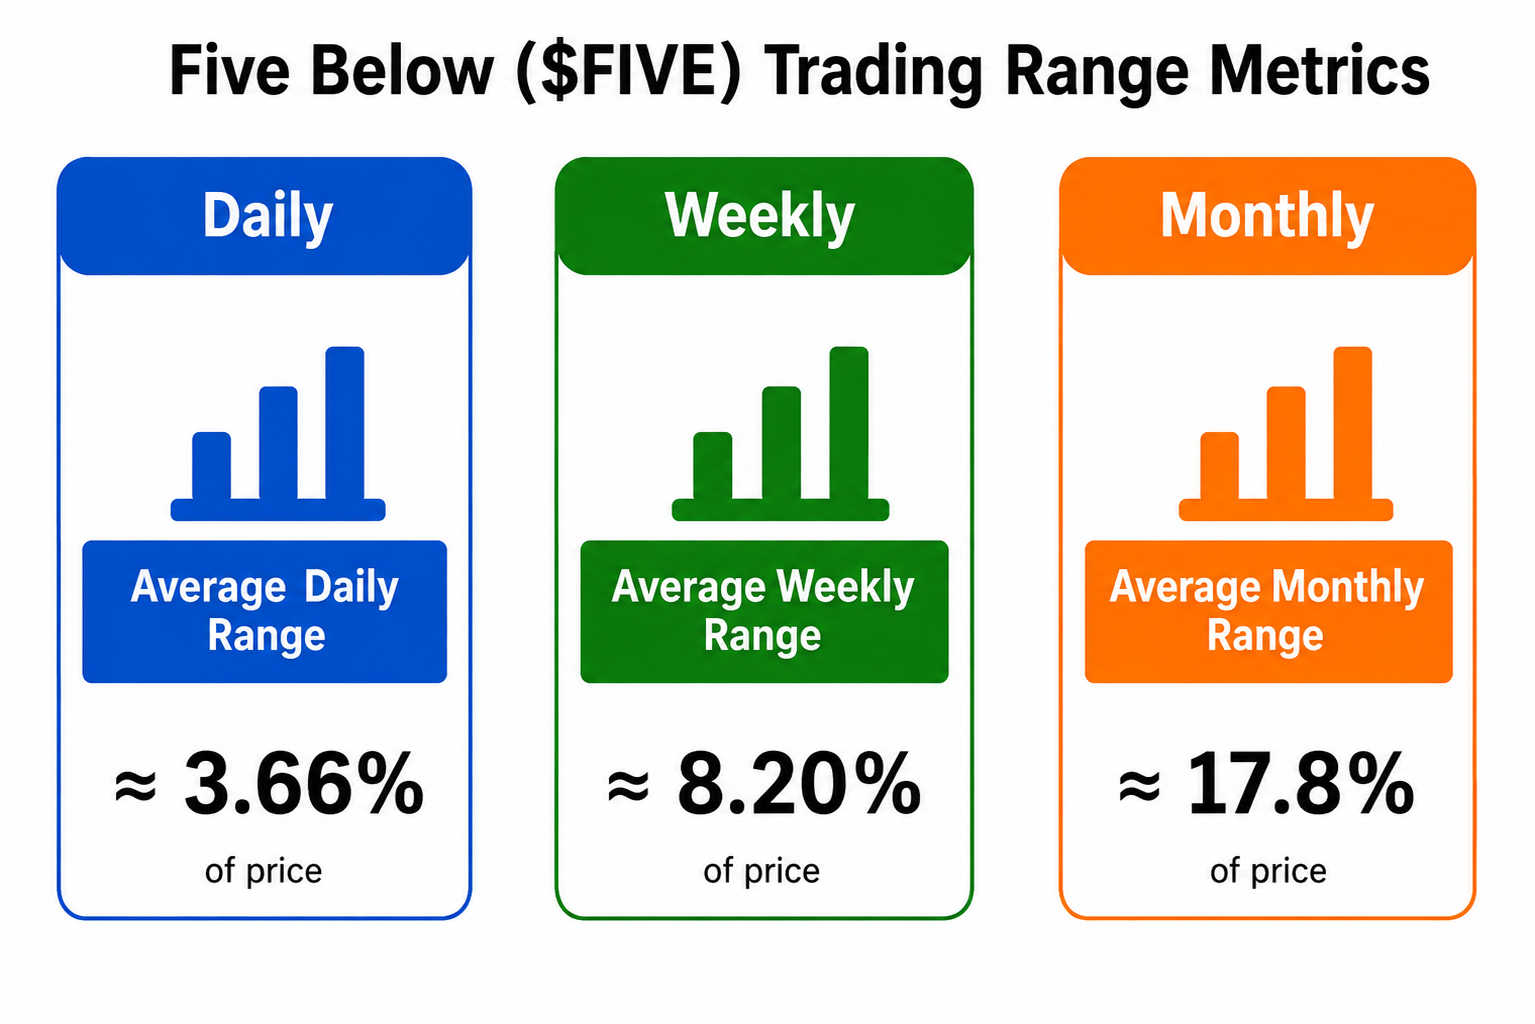
The Daily Range Forecast is where prediction becomes practical. Five Below is not a quiet stock. Its average trading range is approximately 3.66% per day, 8.20% per week, and 17.8% per month. Those numbers tell traders something important before the opening bell: FIVE routinely gives you room to make money, but it also gives you plenty of room to be wrong. A 3.66% average daily range means that on a $260 stock, a normal day’s high-to-low movement can represent roughly $9.50. That is not a forecast that FIVE will move $9.50 tomorrow. It is a useful measure of the territory this stock has historically been capable of covering.
This is where VantagePoint’s Daily Range Forecast becomes especially valuable. On the chart, the predicted high and predicted low create a forecast range around each trading session. Instead of asking the vague question, “How high can FIVE go today?” the trader gets defined price boundaries to work with. Look closely at the past two months and you can see price repeatedly operating within or around those predicted boundaries as FIVE advanced from the $180 area toward $260. The forecast does not eliminate uncertainty. Nothing does. Its purpose is more useful than that: it turns uncertainty into a measurable range where traders can plan entries, targets, stops and risk before emotion enters the conversation.
The real advantage comes when the Daily Range Forecast is combined with the other predictive indicators. FIVE’s larger trend is strongly bullish, the stock has pushed toward new highs, and the Neural Index at the far right of the chart is green. In that environment, the predicted low becomes particularly interesting as a potential value zone during temporary weakness, while the predicted high provides a logical area for traders to consider taking profits or tightening risk. But remember the numbers on the first graphic: 3.66% daily, 8.20% weekly and 17.8% monthly. FIVE has been rewarding trend traders handsomely, but it carries enough natural movement to punish anyone who confuses a strong trend with a risk-free trade. The forecast gives you the boundaries. The trend tells you which side deserves your attention.
Intermarket Analysis
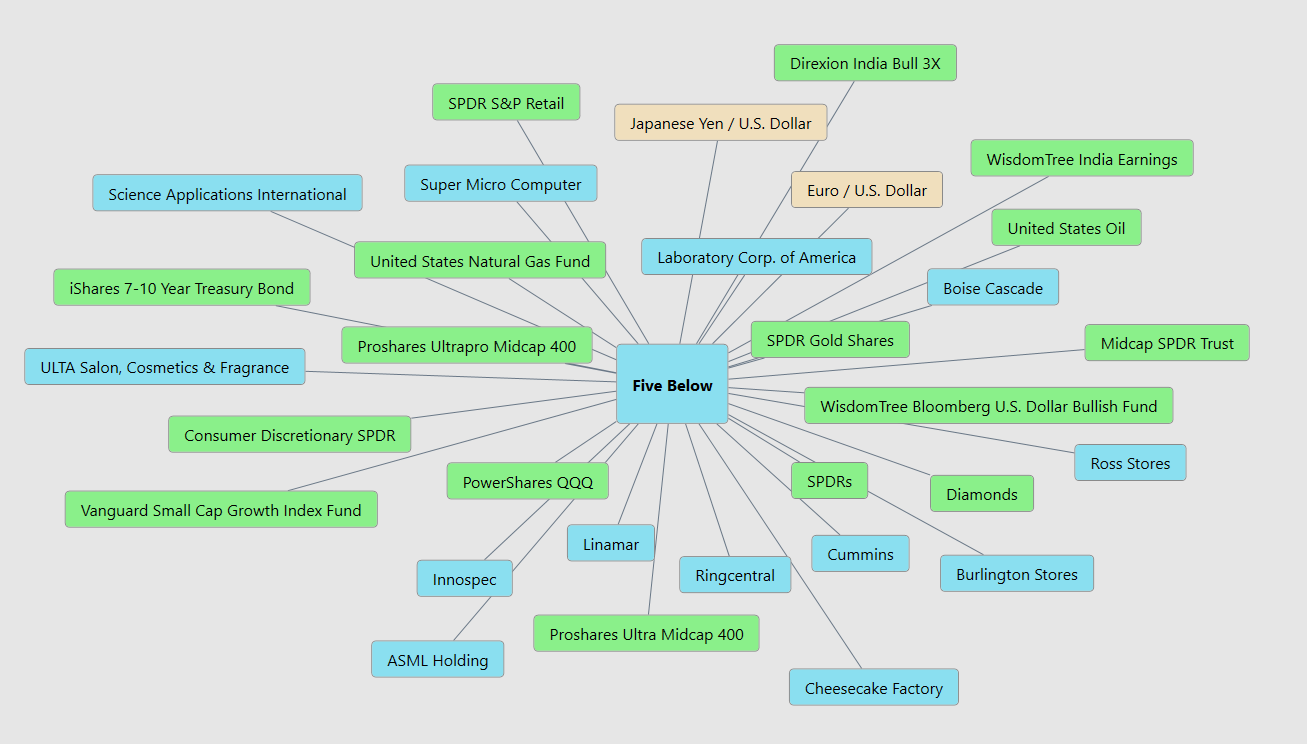
Intermarket analysis is like looking under the hood instead of simply admiring the paint job. FIVE does not trade alone. The graphic shows connections to consumer discretionary and retail markets, small and mid-cap stocks, QQQ, Treasuries, gold, oil, natural gas, the U.S. dollar and major currencies. It also connects FIVE with individual companies including Ross Stores, Burlington Stores, Ulta Beauty, Cheesecake Factory, Super Micro Computer and Laboratory Corporation of America. The important point is not that each market causes FIVE to rise or fall. Rather, VantagePoint’s intermarket analysis identifies markets with meaningful statistical relationships to FIVE’s price behavior. And buried inside these relationships traders will often discover other market gems they were not originally watching.
The picture is unusually broad. FIVE’s price action is connected not simply to retail competitors but to interest rates, currencies, commodities, technology, consumer stocks and broader equity indexes. That matters because a retailer’s fortunes can change when borrowing costs move, consumers become more cautious, energy costs change, or money rotates between growth and defensive assets. At the same time, FIVE has been displaying powerful independent strength, recently pushing toward the top of its 52-week range while outperforming the major indexes. The network tells us what to watch. Price and predictive indicators tell us whether those relationships are presently helping or hurting.
For traders, that makes intermarket analysis an early-warning system. If FIVE remains strong while its important related markets and predictive indicators continue confirming the move, confidence in the trend increases. If those relationships begin deteriorating while FIVE continues making new highs, that divergence deserves attention because the stock may be running ahead of its supporting forces. Right now, FIVE’s own evidence remains impressive: price is near its 52-week high, relative strength is exceptional, the Predictive Blue Line is rising, and the Neural Index is bullish. That argues for respecting the trend, while using the intermarket network to watch for cracks before they become obvious on the price chart. Strong trends rarely travel alone.
 Our Suggestion
Five Below presents one of those situations traders love and fear at the same time: the fundamentals are improving and the market has already noticed. Revenue increased from $1.962 billion in 2020 to $4.764 billion in 2025, while net income increased from $123.4 million to $358.6 million. The important change is that 2025 brought acceleration on both lines. Revenue increased roughly 23%, while net income jumped approximately 41% based on the figures in this study. That matters because FIVE’s earlier growth was not always accompanied by consistent earnings growth. The fundamental question now is whether management can keep expanding the store base and comparable sales while protecting margins. If it can, the market has a legitimate reason to continue rewarding the shares.
Five Below’s management sounds confident because it has been delivering results, not simply making promises. First-quarter sales rose sharply, comparable-store sales were strong, earnings exceeded management’s previous guidance, and the company raised its full-year outlook. Management believes merchandising, marketing and store execution are improving, but it remains cautious about inflation, fuel costs, tariffs, consumer spending and tougher comparisons later in the year.
The important issue for traders is that expectations have risen with the stock price. Management has provided bullish full-year guidance, while Wall Street is now expecting another strong quarter. FIVE has been rewarding that optimism with exceptional relative strength and a move toward 52-week highs. That creates a higher hurdle. A good quarter may no longer be enough. Traders should pay particular attention to comparable-store sales, margins and whether management maintains or raises guidance.
The technical evidence is even harder to ignore. FIVE gained 84.65% over the past year, compared with 19.23% for the S&P 500, and it is outperforming the S&P across every period in our comparison, including six months, year to date, one month and one week. At $259.41, the stock sits in roughly the 96th percentile of its 52-week range, just below the $263.87 high. The Predictive Blue Line is rising above the actual moving average, while the Neural Index is bullish, giving us double confirmation. The Daily Range Forecast adds an important warning: FIVE historically moves approximately 3.66% daily, 8.20% weekly and 17.8% monthly. This is powerful momentum attached to meaningful volatility.
Wall Street provides perhaps the clearest picture of the opportunity and the argument against it. Using the targets supplied in this study, analysts range from $215 to $350, with an average target of $266.53. The $135 spread represents approximately 52% of FIVE’s current price, showing enormous disagreement about what comes next. More telling, the consensus target is only modestly above the current market price. In other words, FIVE has largely caught Wall Street’s average forecast while the most optimistic analysts still see substantial upside. That creates opportunity, but it also raises the burden of proof. Earnings, comparable-store sales, margins and guidance increasingly need to justify what the stock price has already anticipated.
Our suggestion is therefore to respect the trend without chasing the story blindly. FIVE currently checks many of the boxes we want in a market leader: improving fundamentals, exceptional relative strength, price near 52-week highs, bullish predictive indicators and strong momentum. A decisive move through $263.87 would establish fresh 52-week highs and strengthen the bullish case. But this stock has also demonstrated repeated double-digit corrections, including a decline of roughly 25% during the past year. At the 96th percentile of its annual range, the risk is no longer hidden.
The next earnings report is expected September 2, 2026, after the close, making it the next major test of the bullish thesis. Management has earned credibility, but now it must continue delivering against increasingly demanding expectations.
Practice great money management on every trade, and use the VantagePoint AI Daily Range Forecast to identify short-term trading opportunities while keeping risk firmly under control.
It’s not magic.
It’s machine learning.
Disclaimer: THERE IS A HIGH DEGREE OF RISK INVOLVED IN TRADING. IT IS NOT PRUDENT OR ADVISABLE TO MAKE TRADING DECISIONS THAT ARE BEYOND YOUR FINANCIAL MEANS OR INVOLVE TRADING CAPITAL THAT YOU ARE NOT WILLING AND CAPABLE OF LOSING.
VANTAGEPOINT’S MARKETING CAMPAIGNS, OF ANY KIND, DO NOT CONSTITUTE TRADING ADVICE OR AN ENDORSEMENT OR RECOMMENDATION BY VANTAGEPOINT AI OR ANY ASSOCIATED AFFILIATES OF ANY TRADING METHODS, PROGRAMS, SYSTEMS OR ROUTINES. VANTAGEPOINT’S PERSONNEL ARE NOT LICENSED BROKERS OR ADVISORS AND DO NOT OFFER TRADING ADVICE.