



This week’s AI stock spotlight is Frontline PLC ($FRO).
Frontline PLC began in 1985 as a crude-oil tanker company built around the global transportation of oil and petroleum products. Over several decades, the company developed into one of the largest publicly traded tanker operators, with a fleet concentrated in the largest crude-oil shipping categories. Today, the company matters to traders because it sits at the center of a volatile tanker-market cycle: revenue and earnings can move sharply as daily freight rates change, but Frontline has just reported the strongest quarterly profit in its history, declared substantial shareholder distributions, and pushed its share price toward a fresh 52-week high.
All market data in this report is as of the market close on September 15, 2026. All share price, per share, market cap, analyst target, and 52-week range figures should be confirmed against the final data source immediately before publication. Revenue, net income, adjusted profit, EBITDA, vessel rates, fleet data, dividend, and vessel-sale figures are based on Frontline’s latest reported results unless otherwise noted.
Frontline is an international tanker shipping company focused on the transportation of crude oil and refined petroleum products. It serves oil companies, refiners, commodity traders, and other customers through a fleet of vessels that can operate in spot markets and time-charter arrangements.
Frontline is a global tanker shipping company that transports crude oil and refined petroleum products through major maritime trade routes. It generates revenue by chartering its vessels, with daily earnings heavily influenced by tanker supply, global oil movements, vessel utilization, refinery activity, shipping distances, and the spot-market environment. The fleet spans three major categories: Very Large Crude Carriers, or VLCCs, Suezmax tankers, and LR2/Aframax tankers. VLCCs serve the largest long-haul crude-oil routes, Suezmaxes provide major crude-carrying capacity across a wider range of ports, and LR2/Aframax vessels provide exposure to smaller crude and refined-product markets.
The company is headquartered in Hamilton, Bermuda, and is led by Chief Executive Officer Lars H. Barstad. Frontline expects to operate a fleet of 77 vessels after remaining newbuilding deliveries and planned vessel sales, including 40 VLCCs, 19 Suezmaxes, and 18 LR2/Aframax tankers. The average fleet age is approximately 6.6 years, the fleet is ECO designated, and 69% of vessels are fitted with scrubbers. Competitors include International Seaways, DHT Holdings, Teekay Tankers, Okeanis Eco Tankers, and other global tanker owners. Frontline’s distinction is its scale in large tanker categories, combined with a comparatively young fleet, an active fleet-renewal strategy, and a dividend policy that can return meaningful cash to shareholders when tanker conditions are favorable.
The financial history explains why Wall Street’s relationship with Frontline has been complicated. Revenue traveled from approximately $749.4 million in fiscal 2021 to $1.43 billion in fiscal 2022, then increased to $1.80 billion in fiscal 2023 and $2.05 billion in fiscal 2024 before declining to approximately $1.97 billion in fiscal 2025. Net income tells an even more cyclical story. The company recorded a modest loss in 2021, then earned approximately $476 million in 2022, $656 million in 2023, $496 million in 2024, and $379 million in 2025. The distinction matters. Frontline’s financial history is really two stories: a cyclical recovery story that accelerated from 2022 through 2024 and a freight-rate normalization story in 2025, before a powerful new rate environment emerged in 2026. Revenue declined approximately 4% in fiscal 2025, but the company remained highly profitable. The business was not retreating from its market. It was responding to the movement of the tanker cycle.
Here is the number that the annual table hides. On a quarterly basis through the second quarter of 2026, Frontline generated $659.2 million in net income, the strongest quarterly profit in the company’s history. That one GAAP quarter exceeded the company’s full-year net income for fiscal 2025 and nearly matched the entire fiscal 2023 profit of approximately $656 million. That is not an adjusted measure, and it is the single clearest piece of evidence that the current tanker-rate environment is producing extraordinary operating leverage.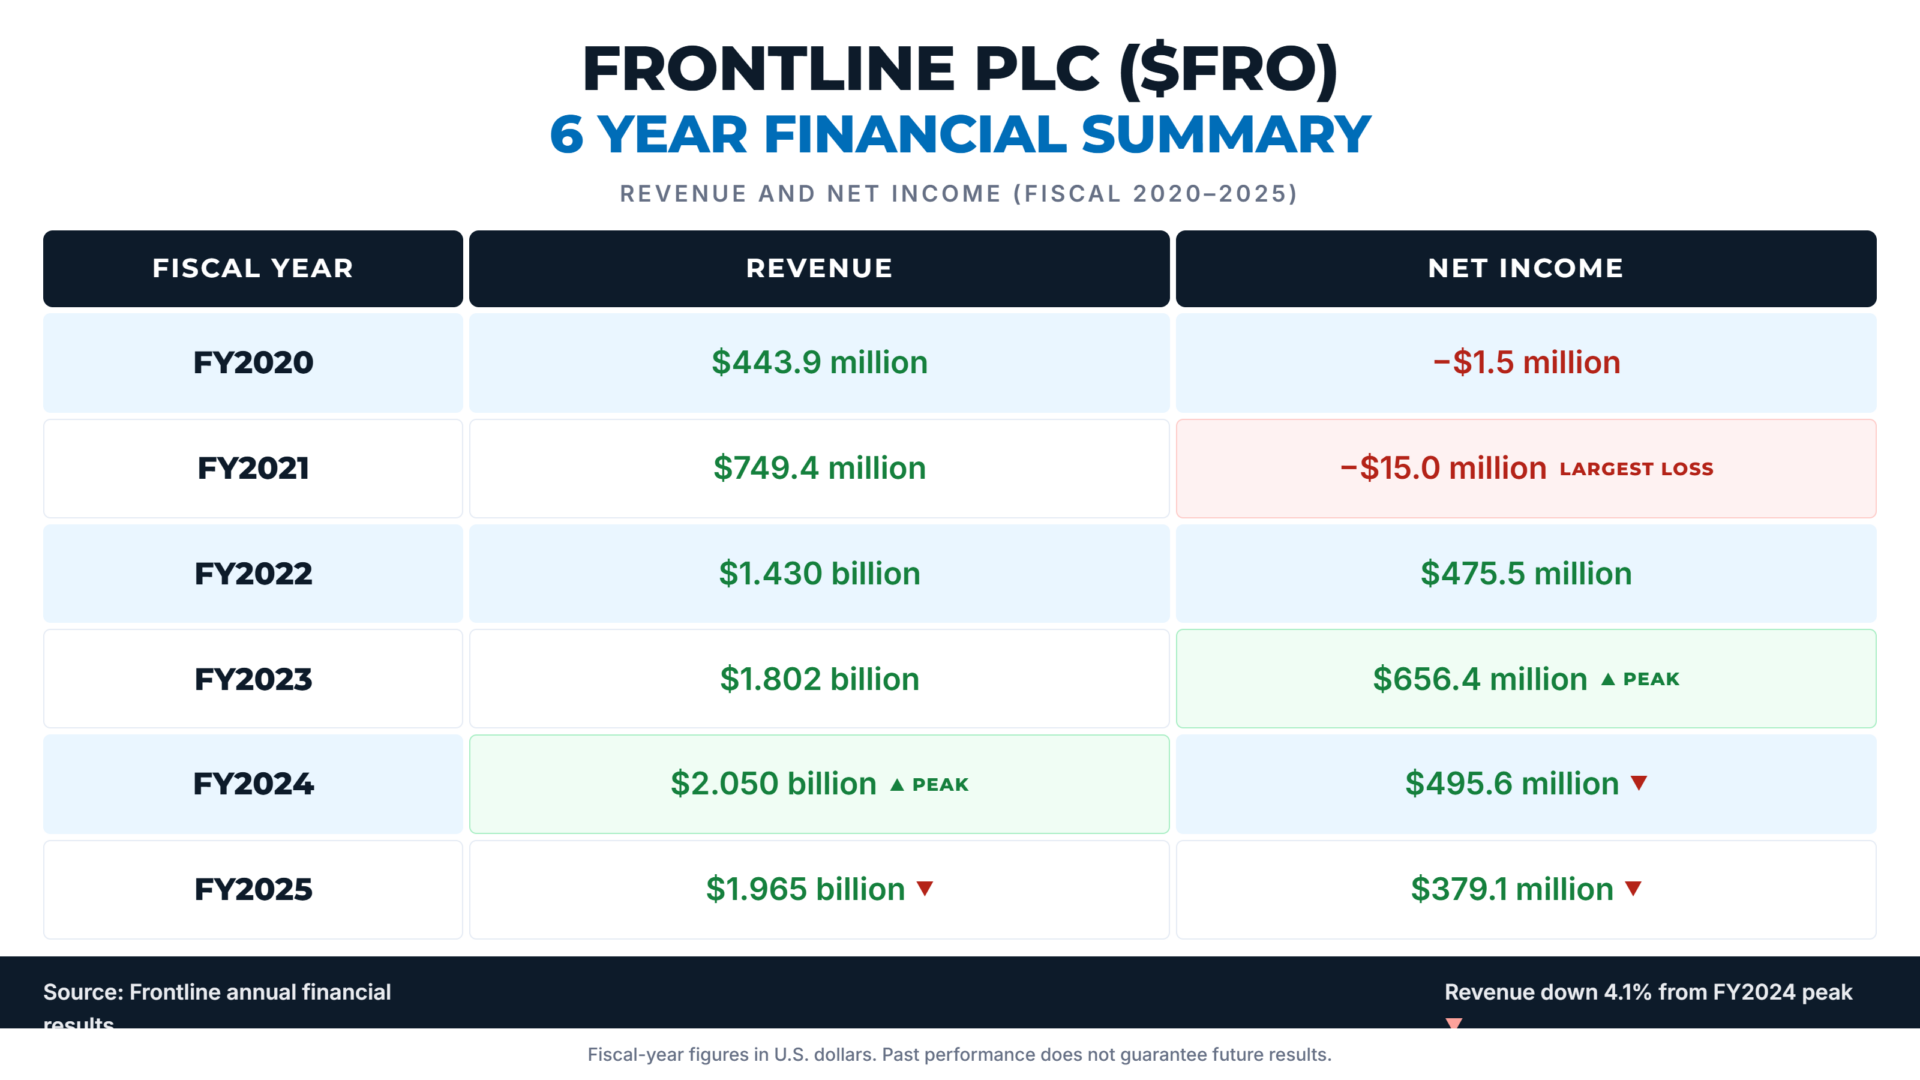
The rest of the numbers point the same direction. While fiscal 2025 revenue declined approximately 4% to $1.97 billion, Frontline reported second-quarter 2026 revenue of $943.3 million and adjusted profit of $580.2 million, or $2.61 per share. Reported net income reached $659.2 million, or $2.96 per share, while adjusted EBITDA reached approximately $681.1 million and operating cash flow reached approximately $579.5 million. Average Q2 spot TCE rates were $152,700 per day for VLCCs, $111,500 per day for Suezmax tankers, and $92,400 per day for LR2/Aframax vessels. The company also declared a $2.61 regular quarterly dividend and announced a separate $0.80 special dividend tied to expected net cash proceeds from the planned sale of two VLCCs. That is not merely a strong quarter. That is a dramatic demonstration of how tanker-rate strength can reshape Frontline’s earnings and cash-return profile.
Traders are really asking two questions now. First, can Frontline sustain daily tanker earnings at levels materially above its cash breakeven rates while revenue and operating cash flow remain strong? Second, can global oil movements, fleet supply, and charter demand remain supportive enough to keep tanker rates elevated after the company has already reported a record quarter? Those are considerably more useful questions than asking whether the stock will ever return to a prior cycle high.
The evidence supporting the bulls has been accumulating. Second-quarter 2026 net income reached $659.2 million, while adjusted profit reached $580.2 million, both company records. VLCC spot TCE rates reached $152,700 per day, Suezmax rates reached $111,500, and LR2/Aframax rates reached $92,400. The company expects a fleet of 77 vessels after planned deliveries and sales, with 40 VLCCs, 19 Suezmax tankers, and 18 LR2/Aframax vessels. Frontline entered into agreements to sell two 2017-built VLCCs for a total sale price of $270 million, expecting approximately $179 million of net cash proceeds. Management intends to distribute those proceeds through a one-time $0.80 special dividend. The company also declared a $2.61 regular dividend, demonstrating that strong operating cash flow is translating directly into shareholder distributions.
The most important news of the last 30 days has been a convergence of evidence. On August 28, Frontline reported second-quarter 2026 results showing its highest quarterly net income and adjusted profit ever. Management declared the regular $2.61 dividend, announced a planned $0.80 special dividend from VLCC-sale proceeds, and provided a detailed look at exceptionally strong tanker rates across the fleet. The company also confirmed that its expected post-delivery and post-sale fleet will remain concentrated in the large-tanker categories where current market economics have been strongest.
Some of this optimism is obviously reflected in the stock price. Through September 15, FRO had climbed from a 52-week low near $20.47 to an intraday high near $50.78. The stock’s recent price strength has outpaced the narrative of a normal dividend payer and instead reflects a market revaluing Frontline as a direct beneficiary of a powerful tanker-rate environment. The exact relative-strength comparison against the S&P 500 and other major indexes should be inserted from the final VantagePoint data table.
Why the change? Record net income, extraordinary VLCC and Suezmax rates, strong fleet utilization, a large and modern tanker fleet, substantial operating cash flow, a regular quarterly dividend, a separate special dividend, and a shipping market where investors have become increasingly focused on the limited supply of high-quality large tanker capacity. These developments are giving investors something Frontline has not had in several quarters: direct evidence that elevated tanker rates are translating into exceptional earnings and tangible cash returns.
That is also where the market could be wrong. Frontline carries substantial overhang. Tanker freight rates can fall quickly. The company’s earnings are sensitive to global oil demand, refinery utilization, fleet supply, vessel deliveries, vessel scrapping, shipping distances, geopolitical disruptions, financing costs, and global economic growth. The company remains exposed to a capital-intensive industry where ship values, debt costs, dry-dock expenses, regulations, and fuel economics can change. And although Frontline has far more analyst coverage than a micro-cap turnaround, the published target range from roughly $30 to $55 shows there is very little agreement about what today’s freight-rate environment is worth over the next 12 months.
The upside opportunity is substantial but contingent. If tanker supply stays disciplined, global oil-trade volumes remain strong, shipping routes stay extended, daily TCE rates remain well above cash breakevens, and Frontline continues producing strong operating cash flow, the company could sustain elevated earnings and distributions. The most meaningful upside surprise would be evidence that booked rates are holding or rising into 2027, forcing analysts to increase forward profit and dividend assumptions. Strong VLCC market conditions, rising charter coverage, and another record earnings quarter would reinforce the argument that the current tanker cycle has more durability than the market expects.
The biggest risk is that the tanker-rate story is wearing a convincing disguise. Earnings are extraordinarily strong, but Frontline is a cyclical shipping company, not a stable earnings compounder. If freight rates decline, fleet utilization softens, vessel supply rises, global trade slows, or oil-market disruptions normalize, investors may suddenly remember that they are holding a stock whose profit, cash flow, and dividend capacity are tied directly to a highly volatile daily-rate market. The stock is also trading near its 52-week high. If the company disappoints on booked TCE rates, dividend expectations, or shipping-market guidance, the shares could reprice quickly.
The catalyst calendar is dense. Third-quarter 2026 earnings are expected on November 30. The special dividend depends on the completion of the planned VLCC sales. The company’s regular Q2 dividend had a September 18 ex-dividend date and a September 28 payment date. Investors will also watch daily tanker rates, booked TCE coverage, fleet utilization, vessel sales and deliveries, oil-trade volumes, tanker-supply data, and management’s outlook for cash returns. The next quarterly report is the most important milestone because it will show whether the record Q2 rate environment carried into the second half of the year.
The company is performing better than the market expected. The stock has noticed. That means the risk is no longer whether Frontline can generate extraordinary profit when tanker rates are high. The risk is whether the current strength can last long enough to support the valuation now implied by a share price near the top of its annual range. At a reference price near $50.52 and a 52-week high near $50.78, the market is pricing in continued strength with very little technical room remaining before the stock enters fresh breakout territory.
FRO therefore looks best suited to cyclical traders and income-oriented investors comfortable with tanker-market volatility, not to investors looking for stable earnings or a fixed dividend. The trend can continue if booked TCE rates remain elevated, fleet supply stays constrained, and the company continues converting daily vessel earnings into cash distributions. The current cycle is showing real evidence of strength. Whether it is durable depends on what the next two quarters of tanker-rate and utilization data reveal.
The early warning sign is simple: watch booked TCE rates, utilization, and dividend capacity. If Frontline begins reporting lower vessel earnings while fleet coverage weakens, respect the message. Tanker cycles tend to resolve in one direction or the other very quickly. And with the shares trading near their 52-week high, Frontline may offer significant upside if rates remain strong, but nobody should confuse a record quarter with a safe one.
Wall Street Analysts Annual Forecasts
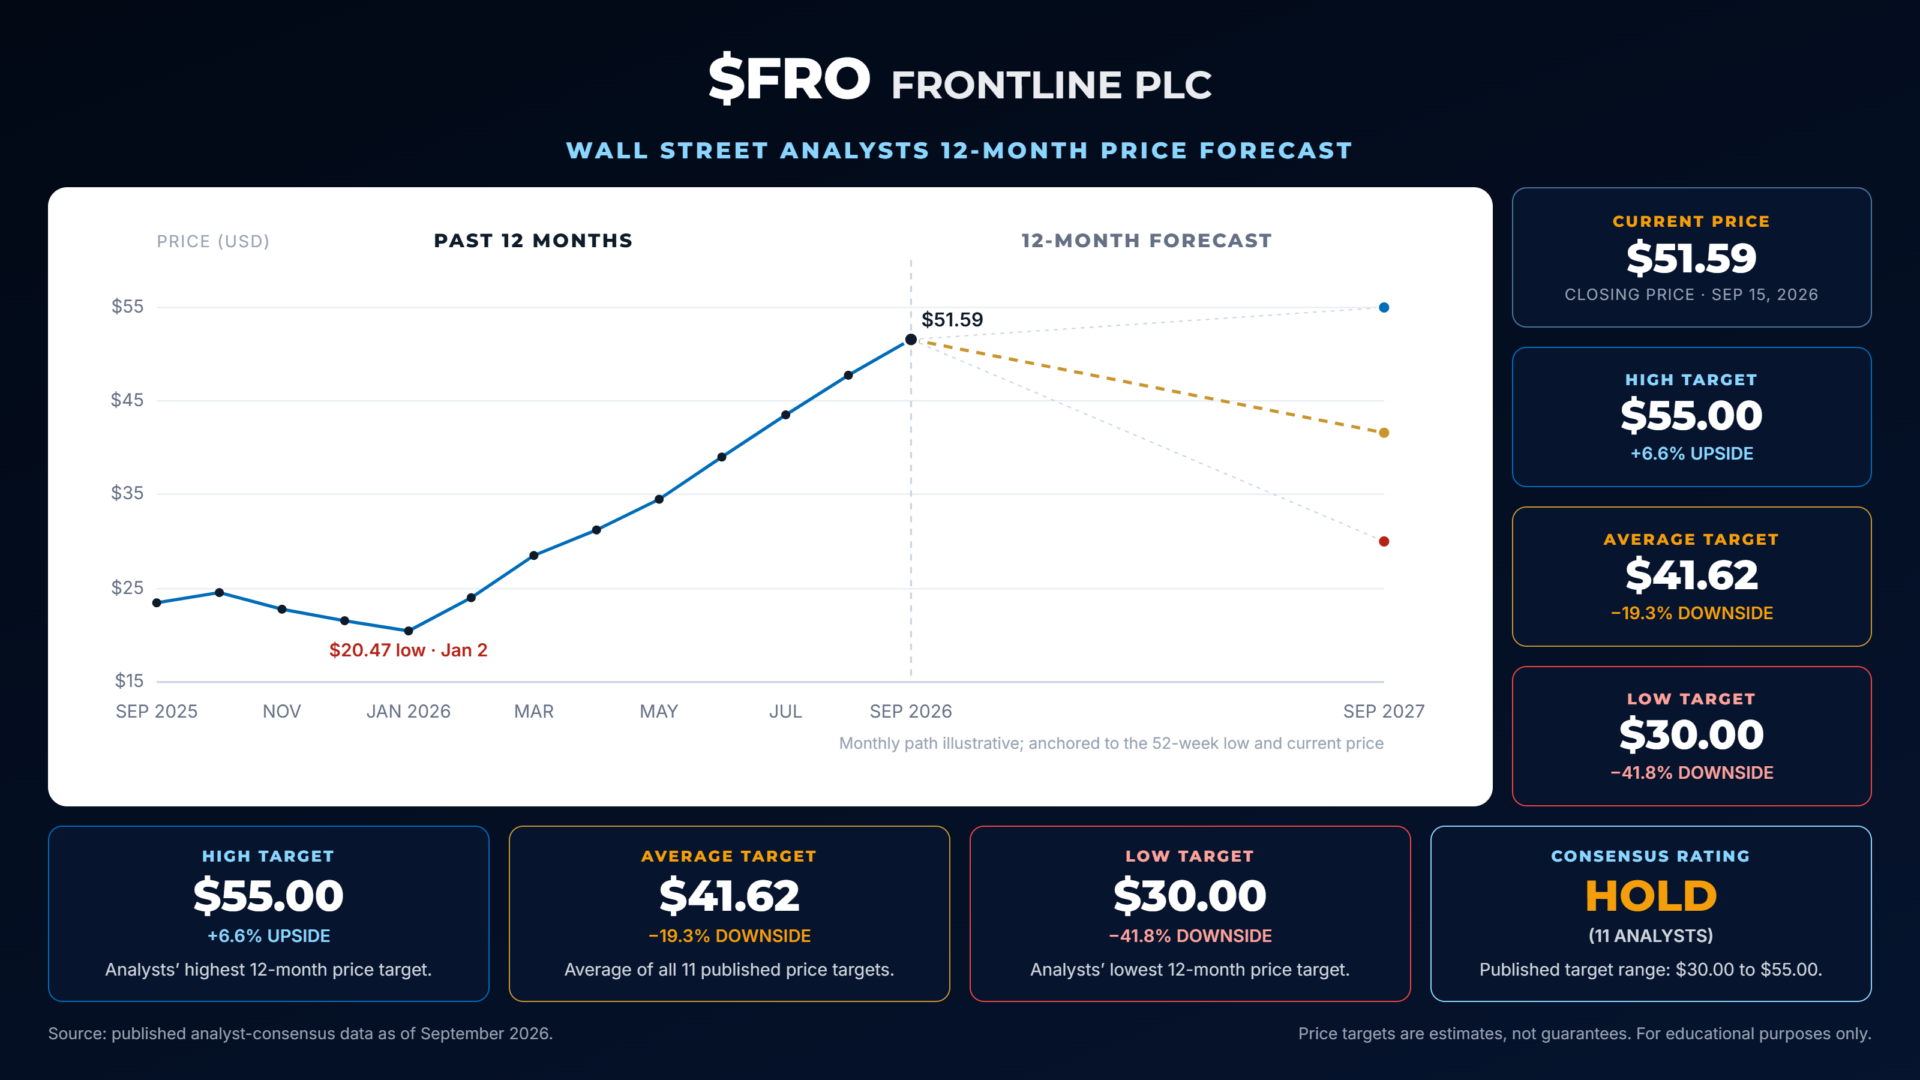
Before deciding whether to be bullish or bearish on Frontline, it helps to see what Wall Street’s professional fortune tellers are saying. In this case, the more revealing fact is how far apart the forecasts are. Published data shows that 11 analysts cover FRO, with an average 12-month price target of $41.62, against a recent closing price near $50.52. The consensus rating is Hold.
Compare that to a typical stable large-cap company where analysts may disagree about growth by a few percentage points. Frontline’s low target is $30.00, its high target is $55.00, and the spread between the two is $25.00. That is not merely a disagreement problem. It is a tanker-cycle problem. Traders and analysts are trying to estimate daily freight rates, global trade flows, vessel supply, dividend capacity, and asset values in a market where a small change in rates can cause a large shift in earnings.
The math is straightforward. The $41.62 average target sits approximately 17.6% below the current $50.52 price. That is a cautious reading, but it deserves an enormous asterisk. With a tanker stock, the target is built on assumptions about forward day rates, cash flow, fleet values, and dividend potential. A single quarter of stronger or weaker-than-expected booked rates can move those assumptions materially. On a stable company, an analyst average can reflect a broad view of the market. On a tanker company in a powerful cycle, it often reflects a collection of different views about when that cycle ends.
That forecast dispersion is itself the trading thesis, in both directions. Tanker stocks that continue delivering high rates and large cash returns can reprice sharply when analysts revise earnings estimates upward. The same disagreement means there may be little support if rates weaken, dividends fall, or the market decides the record profit was the peak rather than the beginning of a sustained cycle.
For traders, that is where things get interesting. FRO has record quarterly earnings, adjusted profit of $580.2 million, average VLCC TCE rates of $152,700 per day, a regular $2.61 dividend, a separate $0.80 special dividend, and a share price testing fresh 52-week highs. If daily rates remain elevated, if booked coverage stays strong, and if the next quarterly report confirms that the current environment is persisting, analysts may need to raise estimates rather than merely defend current targets. Disappointing rate data would leave the stock with a very different story underneath it. This remains a cyclical setup, and the wide spread in analyst targets is a reminder that the range of outcomes for Frontline is exceptionally wide.
52-Week High and Low Boundaries Analysis
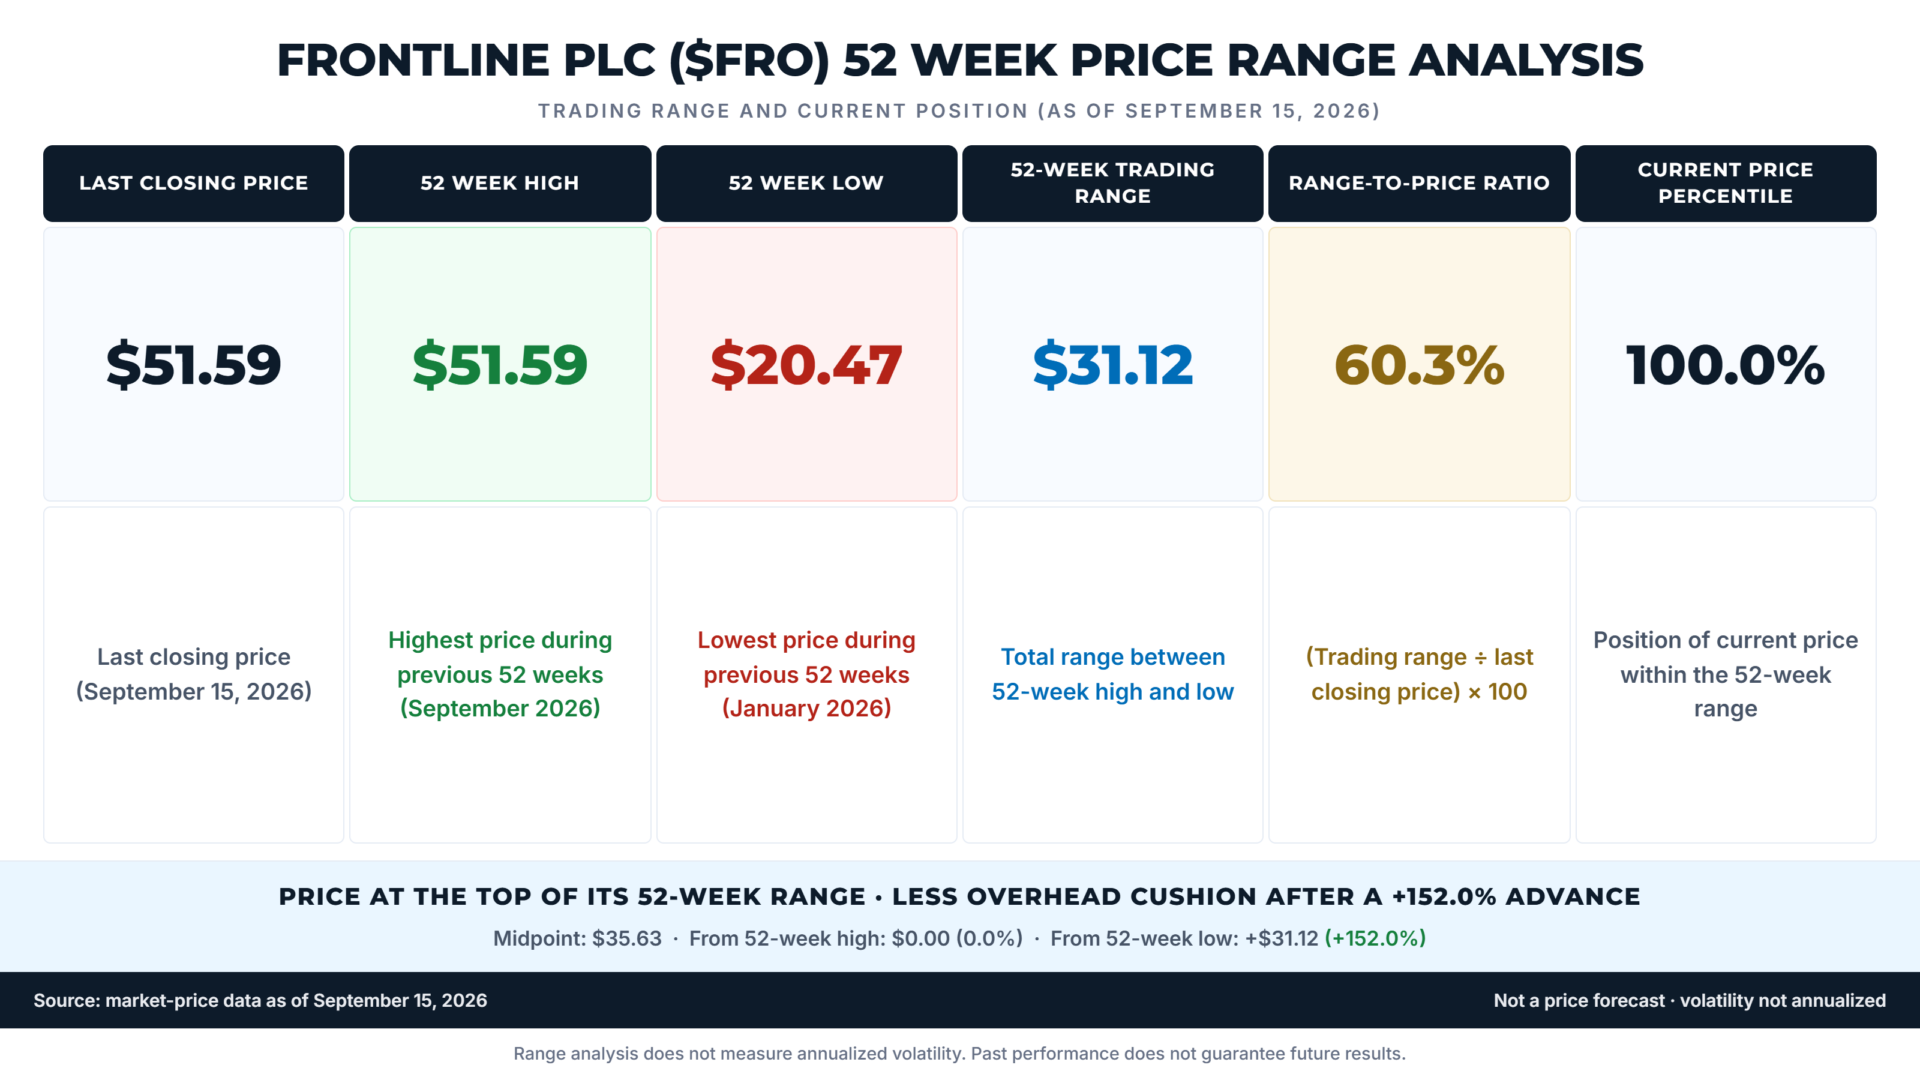
Another powerful way to understand volatility is to forget forecasts and study what FRO has already done. Over the past 52 weeks the stock traveled from $20.47 to $50.78, a $30.31 trading range. Divide that range by the current $50.52 price and you get a range-to-price ratio of 60.0%. This is not the same as annualized historical volatility, but it provides a useful measure of how much FRO has traveled over the past year relative to where it trades now. Put simply, FRO covered a distance equal to roughly 60% of its current price in twelve months. That tells you immediately what kind of stock this is.
Today it sits in the 99.1st percentile of that range, just $0.26 below its 52-week high and $30.05 above its 52-week low. The stock has recovered almost all the ground it lost and is now testing new territory. The high at $50.78 sits approximately 0.5% above the current $50.52 price, which means there is almost no measurable room overhead before FRO establishes a new 52-week high.
The midpoint of the 52-week range is approximately $35.63. FRO broke above that midpoint during its recent rally and now trades approximately 41.8% above it, signaling that buyers have taken control of the intermediate trend. Applying the 60.0% range-to-price ratio around the $35.63 midpoint produces theoretical boundaries so wide that they stop being useful, which is itself the lesson. On a stock whose annual range equals 60% of its current price, conventional volatility framing gives way to the practical realities of tanker markets. What matters is whether freight rates, fleet utilization, dividend capacity, and technical momentum remain supportive.
Now comes the part traders need to respect. FRO is strong, but strength in a tanker stock carries different risks than strength in a diversified large-cap name. At the 99.1st percentile, the stock is in the very top of its annual range. A clean move above $50.78 would put FRO into fresh 52-week high territory and confirm that the tanker-rate cycle has captured broader attention. A rejection followed by sustained weakness would tell us something has changed, with the $35.63 midpoint becoming an important longer-term reference point.
For cyclical traders the setup remains attractive because record profitability and strong TCE rates provide real fundamental support. But with a 60.0% annual range-to-price ratio and a share price near the top of its range, risk management is not optional. The trend says stay interested. The tanker cycle says stay alert.
Best-Case/Worst-Case Analysis
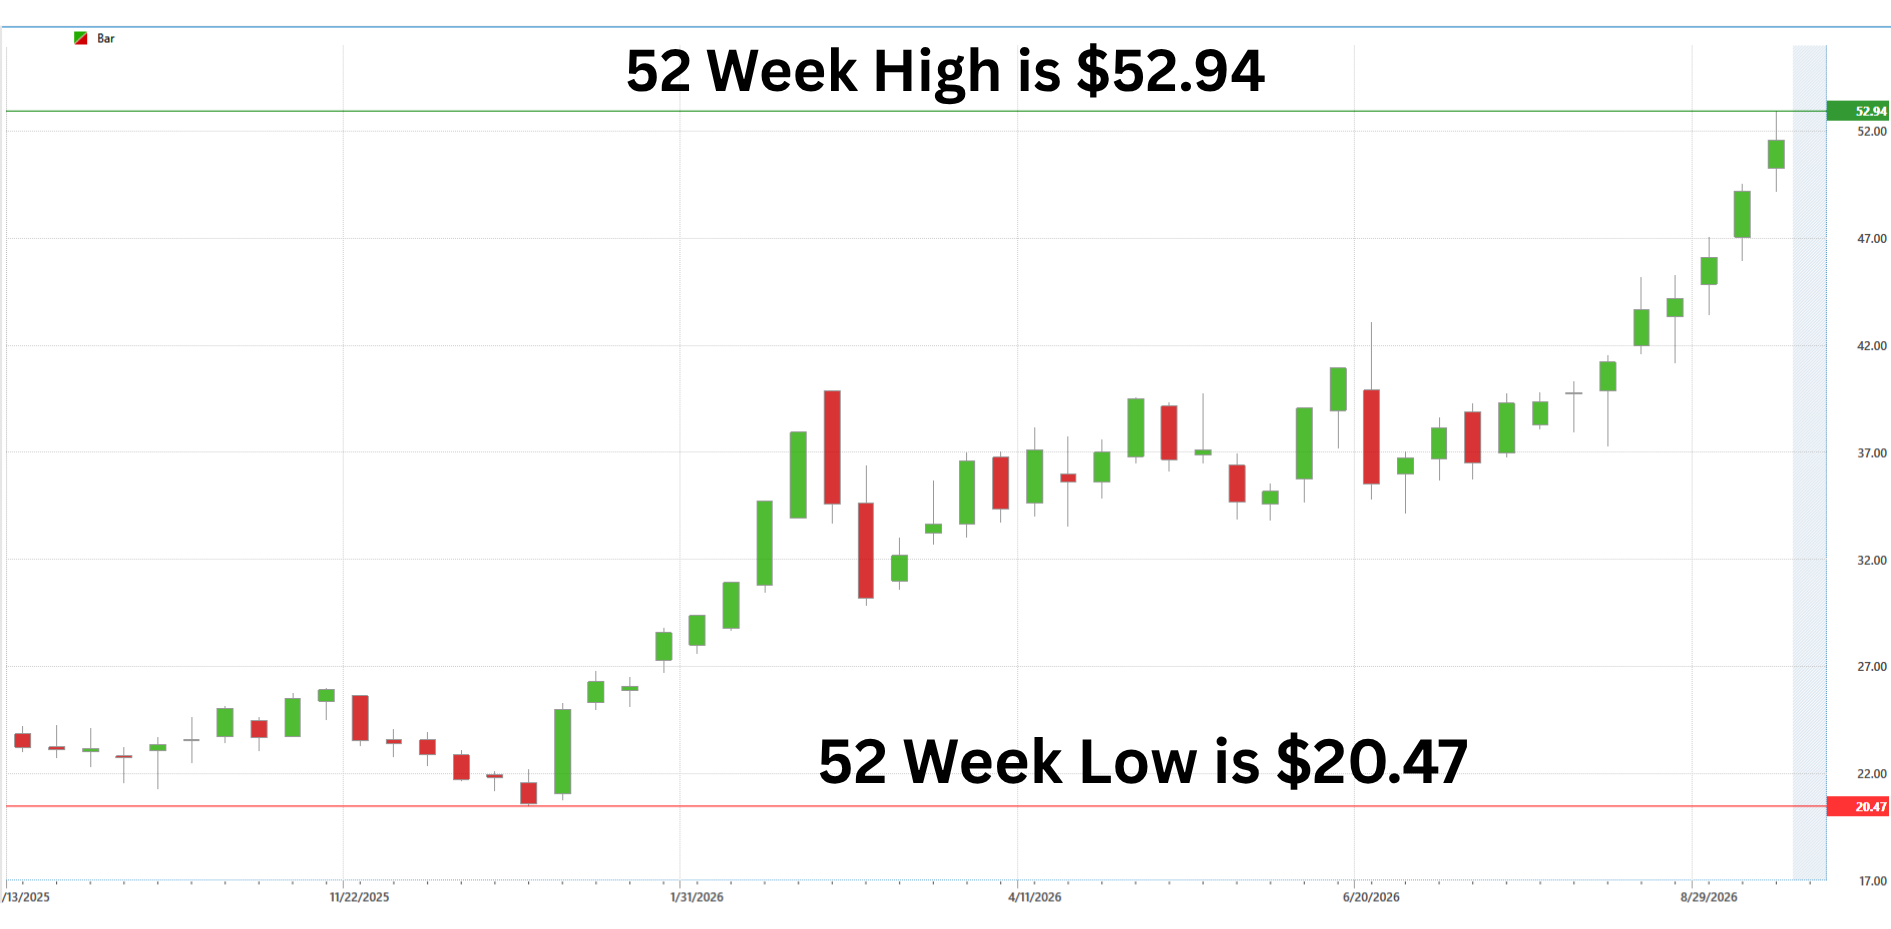
Frontline has been teaching traders an important lesson: a tanker-cycle stock does not travel in a straight line. The best-case analysis shows how aggressively FRO can move when tanker rates strengthen and buyers take control. The stock rallied approximately 151.8% from its January 2, 2026 low of $20.47 to its September 15, 2026 high of $51.55. Even the most recent leg, from roughly $41.34 in mid-August to $51.55 in mid-September, produced a gain of approximately 24.7% in a single month. The 52-week high of $51.55, set on September 15, 2026, demonstrates what this stock is capable of when freight-rate strength aligns with record earnings and strong shareholder distributions.
Those moves are not forecasts or price targets. They are historical evidence of what this stock has done when momentum arrives.
Now look at the other side of the ledger. FRO declined approximately 34.1% from its October 7, 2024 high of $25.68 to its April 4, 2025 low of $16.92. Softer tanker rates, shifting oil-market expectations, changing global trade conditions, and investor concern about the durability of the shipping cycle drove a sharp selloff that punished late buyers. The important lesson is not whether the next drawdown will be 10% or 30%. Nobody knows. The lesson is that tanker stocks with profits tied directly to daily charter rates can reprice sharply when sentiment shifts.
Put the two sides together and Frontline presents an extraordinary but demanding profile. The latest major rally reached approximately 151.8%. The prior material decline reached approximately 34.1%. None of this tells us what FRO will do next, but it gives traders a realistic framework for understanding what the stock can do. When a stock can routinely move 20%, 30%, 50%, or more as the freight-rate cycle changes, position sizing and disciplined risk management are not optional. They are the price of staying in the game.
So here is the line in the sand. As long as Frontline keeps reporting elevated tanker rates, strong booked coverage, substantial operating cash flow, and attractive shareholder distributions, the bulls have the fundamental argument. A clean move above $51.55 would establish fresh 52-week highs. The danger appears when the character changes: daily TCE rates weaken, forward vessel coverage falls, dividend expectations decline, or the company’s next quarterly results show that the record Q2 freight environment has begun to normalize. That would tell us the stock is no longer merely correcting inside an uptrend. It may be transitioning into something more dangerous.
The biggest mistake here would be looking at FRO’s 151.8% rally from its January low and concluding that the stock is safe. It isn’t. Momentum is not safety. The historical record says FRO can deliver 150% advances and more than 30% drawdowns. Cyclical traders have the advantage while tanker rates remain strong and the stock keeps attracting buyers, but they also need an exit plan before the market gives them a reason to use it.
That is the trade in one sentence: respect the tanker-rate strength, but remember what happens when a shipping cycle turns.
Relative Strength Comparison
Frontline is not a short-lived momentum story. It has been one of the market’s strongest cyclical shipping performers over the past year, and that distinction is the entire story. Over the past year FRO gained approximately 110.8%, while the S&P 500 gained roughly 15%, the Nasdaq roughly 16.5%, the Dow roughly 10%, and the Russell 2000 roughly 23%. A year ago FRO was trading near the low $20 range, then moved through a powerful advance toward $50 as tanker rates strengthened, Frontline reported record profitability, and investors began pricing in a more favorable freight-rate environment.
| Comparison period | FRO | S&P 500 | Nasdaq | Dow | Russell 2000 |
|---|---|---|---|---|---|
| Past year | +110.79% | ~15% | ~16.5% | ~10% | ~23% |
| Year to date | +131.66% | ~11% | ~12% | ~9% | ~18% |
| Past 3 months | +28.20% | ~1% | ~-2% | ~1% | ~6% |
| Past month | +22.68% | ~-2% | ~-2% | ~0% | ~1% |
| Latest week | +4.47% | ~-1% | ~-2% | ~-1% | ~-1% |
The shorter time frames tell an even more important story. FRO is up 131.7% year to date, compared with approximately 11% for the S&P 500. Over the past month FRO gained 22.7% while the S&P 500 declined roughly 2%. Even over the latest week FRO added 4.5% while the major benchmarks moved lower. That is exactly what traders want to see when a cyclical earnings thesis is working. The market can soften, but the stock keeps attracting buyers because Frontline is delivering record profitability, unusually strong tanker rates, and substantial cash returns to shareholders.marketwatch+2
The takeaway is precise, and it is worth stating carefully rather than overselling. FRO has beaten every major benchmark over the past year, year to date, three months, one month, and the latest week. What the data shows is not merely an inflection. It is an established period of exceptional relative strength. Exceptional momentum is usually where the money is, and it is also where the mistakes are. Until this relative-strength pattern breaks down, the evidence says traders should treat weakness as something to study rather than assuming the run is over. But nobody should mistake a year of outperformance for a permanent condition in a stock whose earnings, dividends, and valuation can change rapidly when tanker rates begin to normalize.
VantagePoint AI Predictive Blue Line
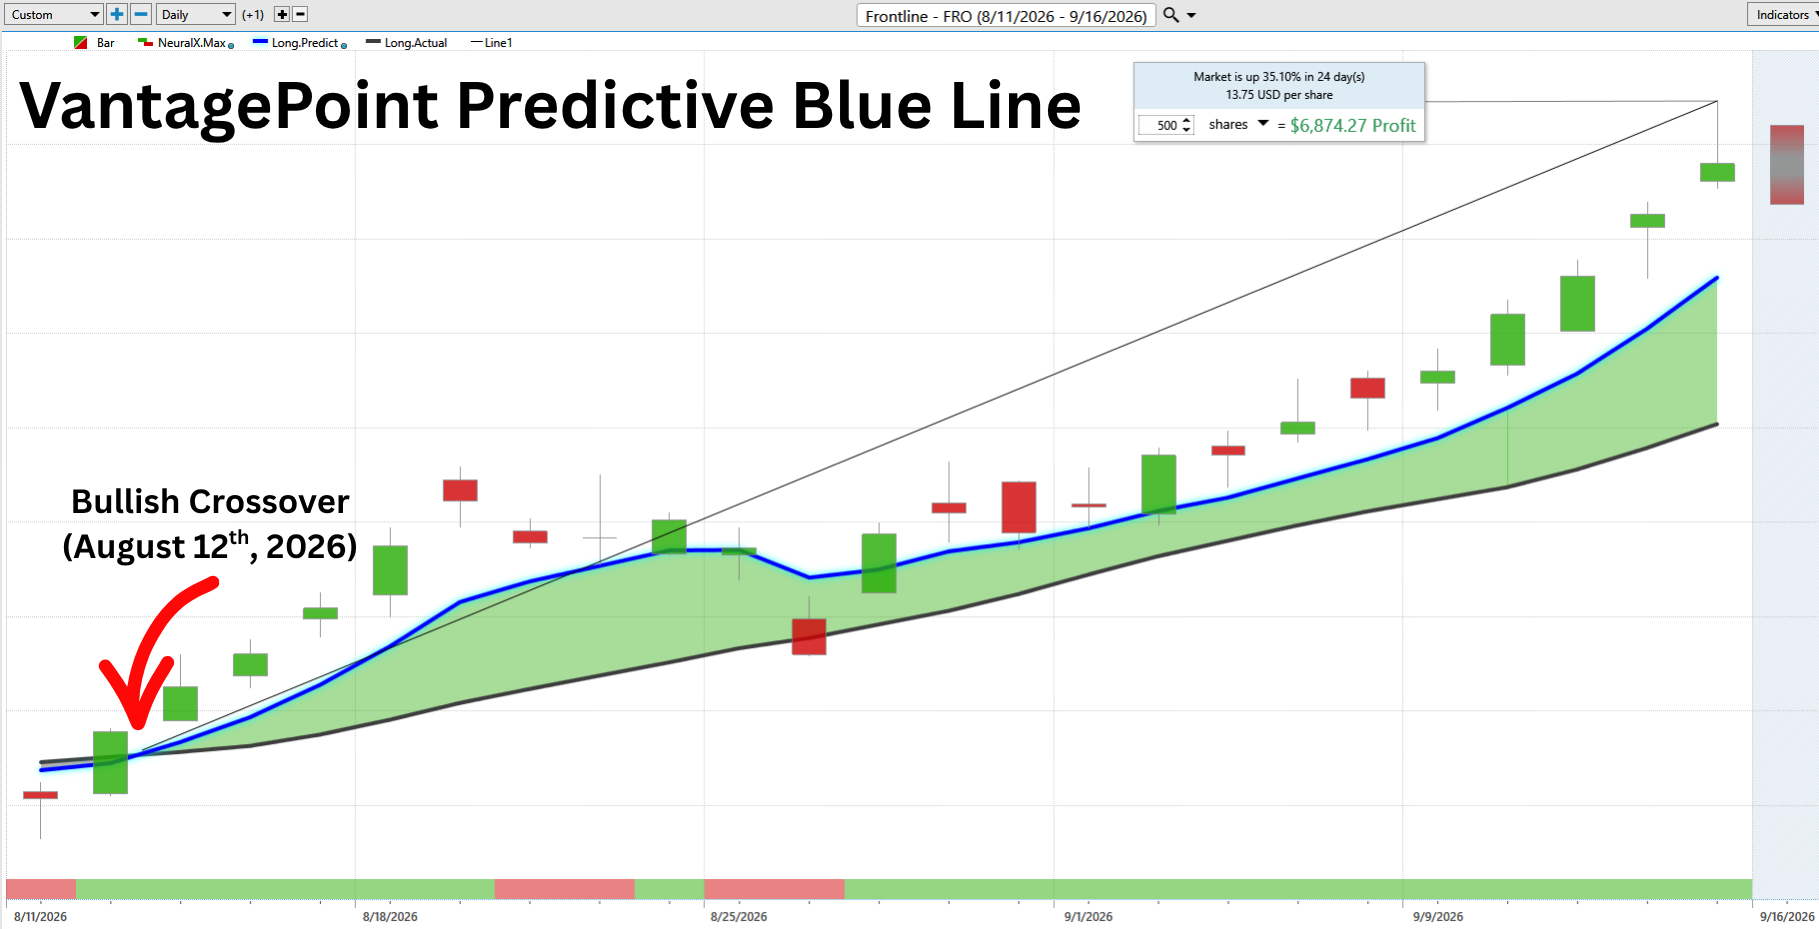
If Wall Street were a poker game, the Predictive Blue Line would be the one player quietly counting cards while everyone else argues about the last hand. Most traders spend their time staring at yesterday’s price. The Predictive Blue Line is trying to estimate where tomorrow’s trend is headed. That is a meaningful distinction because markets pay you for anticipating change, not admiring history.
The chart currently tells a constructive story. The meaningful bullish crossover, pictured above, occurred on August 12, 2026, when the Predictive Blue Line crossed above the black actual moving average. That signal marked the beginning of the strongest recent leg of Frontline’s advance and led to an approximate 35.1% gain over 24 trading days.
This is the move that best demonstrates how the Predictive Blue Line can help traders identify a more durable change in trend direction. The blue line moved above the actual moving average, maintained an upward slope, and was followed by sustained price strength as FRO advanced from the low $39 range toward fresh 52-week highs above $51.
The chart also shows why the Predictive Blue Line can function as a value zone. Instead of chasing FRO after an extended green candle or buying simply because the stock is making new highs, traders can watch for retracements toward the Predictive Blue Line while the blue line remains above the black actual moving average and continues sloping higher. Those pullbacks can identify areas where the balance of risk and reward becomes more attractive inside an established uptrend.
What stands out now is the strength and persistence of the move following the August 12 crossover. FRO gained approximately 35.1% in only 24 trading days, while the Predictive Blue Line remained above the actual moving average and continued rising. That is confirmation of trend strength. The separation between the predicted and actual moving averages also shows that the forecasted trend continues to lead the slower historical trend.
For traders, the message is straightforward: the primary trend remains bullish until the indicators say otherwise. We want the Predictive Blue Line rising, price generally trading above it, and the blue line remaining above the actual moving average. A flattening blue line would be the first reason to become more cautious. A decisive crossover lower, accompanied by a flattening of both lines, would be the first indication that momentum is fading. Until that happens, the chart continues to argue that Frontline remains in an established uptrend.
VantagePoint AI Neural Index
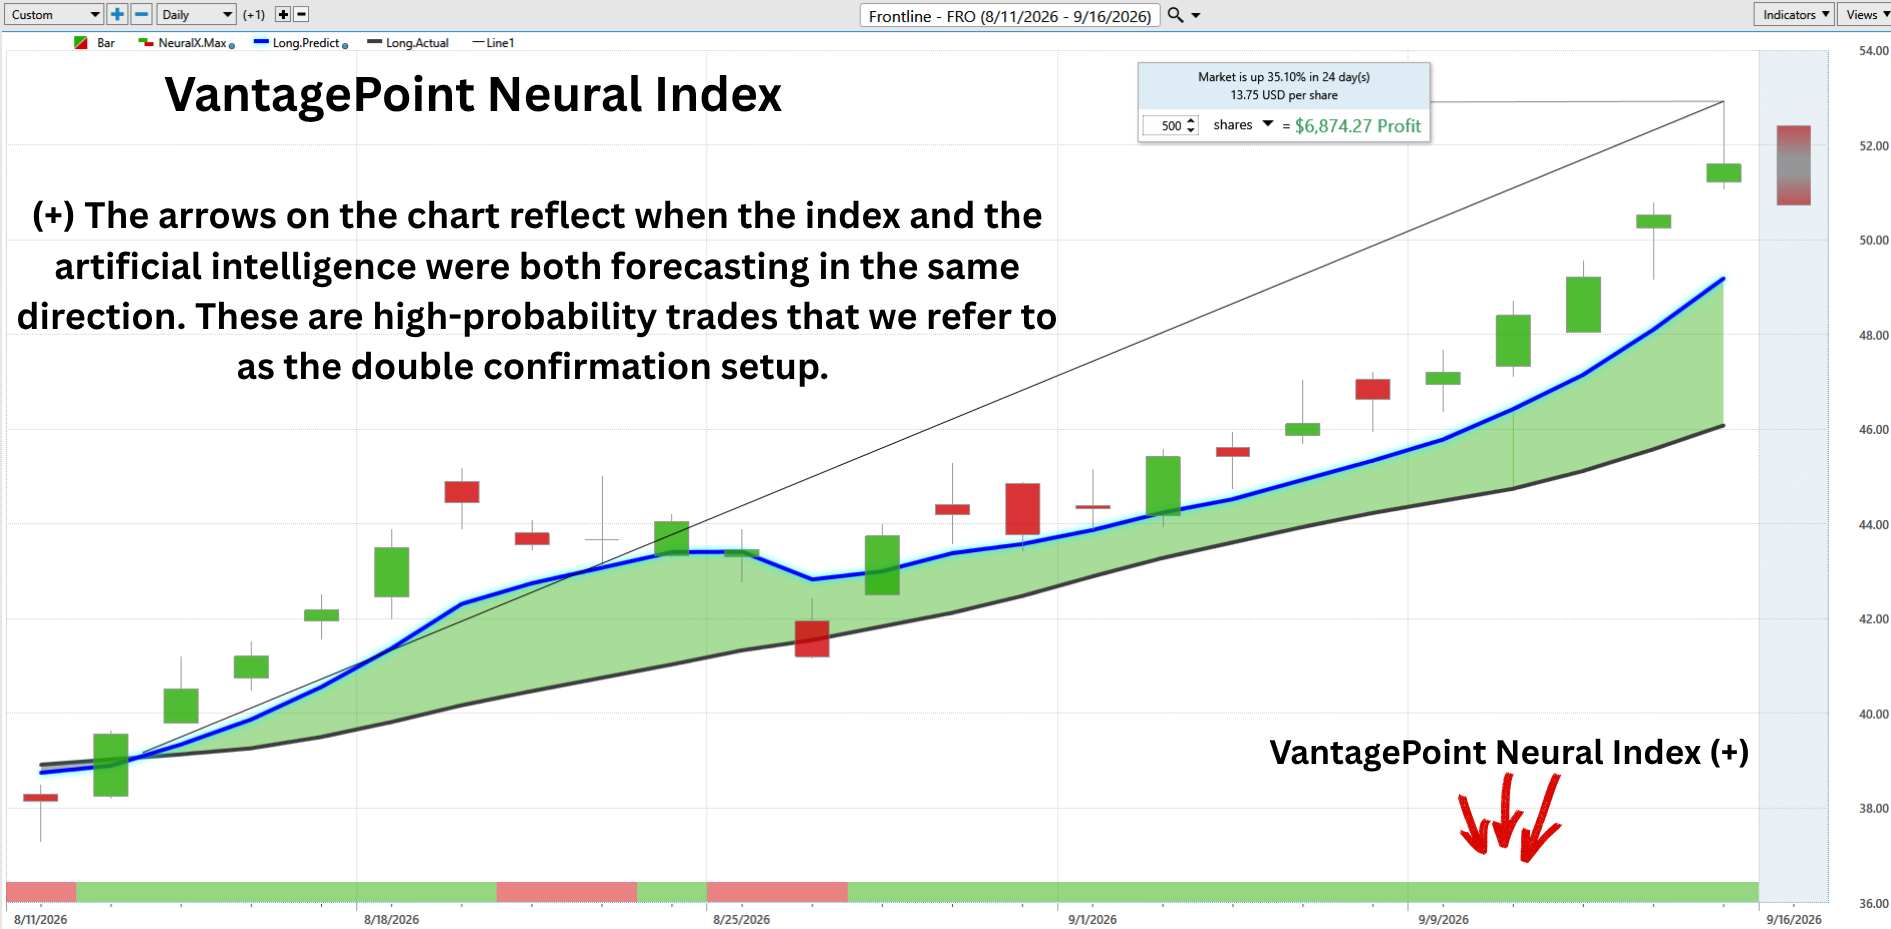
The Neural Index is designed to answer one question that every trader asks, whether they realize it or not: What are the odds the current trend continues over the next 48 to 72 hours? Instead of measuring how far the stock has already moved, the Neural Index looks for subtle shifts in market conditions that often appear before price reacts. Think of it as an early-warning system rather than a rearview mirror.
The chart is sending a constructive message. Since the August 12, 2026 bullish Predictive Blue Line crossover, the Neural Index has largely supported Frontline’s upward move from approximately $39.11 to above $51.50. The signal record matters because it shows the stock’s advance was not simply a one-day reaction to a headline. It developed through a sustained period in which short-term market conditions repeatedly favored the existing bullish trend.
There were several brief cautionary signals early in the move, reminding traders that even a strong trend can pause, consolidate, or experience profit taking. What matters is that these short interruptions did not develop into a sustained bearish pattern. FRO absorbed those periods of uncertainty and continued advancing as buyers regained control.
One of the more encouraging features is how well the Neural Index agrees with the Predictive Blue Line. The August 12 bullish crossover launched the strongest recent leg of Frontline’s rally, and the Neural Index supported that move as it developed. When both indicators point in the same direction, traders have what VantagePoint refers to as double confirmation. The Predictive Blue Line is forecasting a bullish trend, while the Neural Index is confirming that near-term market conditions have generally remained favorable.
The recent signal sequence is especially notable. Since August 27, every completed Neural Index reading has been green. That sustained positive sequence has coincided with FRO’s advance toward fresh 52-week highs and provides a cleaner confirmation of the trend than a single-day signal could offer. It does not guarantee that Frontline must continue higher, but it does indicate that VantagePoint’s short-term forecast has identified persistent positive market conditions rather than a brief burst of momentum.
The early cautionary readings should not be ignored. They remind us that Frontline remains a cyclical tanker stock with meaningful volatility, particularly after a rapid price advance. But the chart shows that the bears have interrupted the trend without reversing it. Since the August 12 crossover, periods of caution were followed by renewed demand, and the stock advanced from approximately $39.11 to above $51.50 as the Neural Index became increasingly supportive.
Our interpretation remains bullish. The current Neural Index supports the existing uptrend and indicates that the near-term probability continues to favor higher prices over the next several trading sessions. As long as the Neural Index remains green while the Predictive Blue Line continues rising, the path of least resistance favors the bulls. A sustained shift to cautionary and bearish readings, especially alongside a flattening or declining Predictive Blue Line, would be the first indication that short-term momentum is weakening.
VantagePoint AI Daily Range Forecast
One of the biggest mistakes traders make is assuming tomorrow will look like yesterday. The Daily Range Forecast is built on the opposite idea. Instead of reacting to where the stock has been, it estimates the likely trading range before the next session begins. For active traders, that shifts the focus from forecasting to preparation.
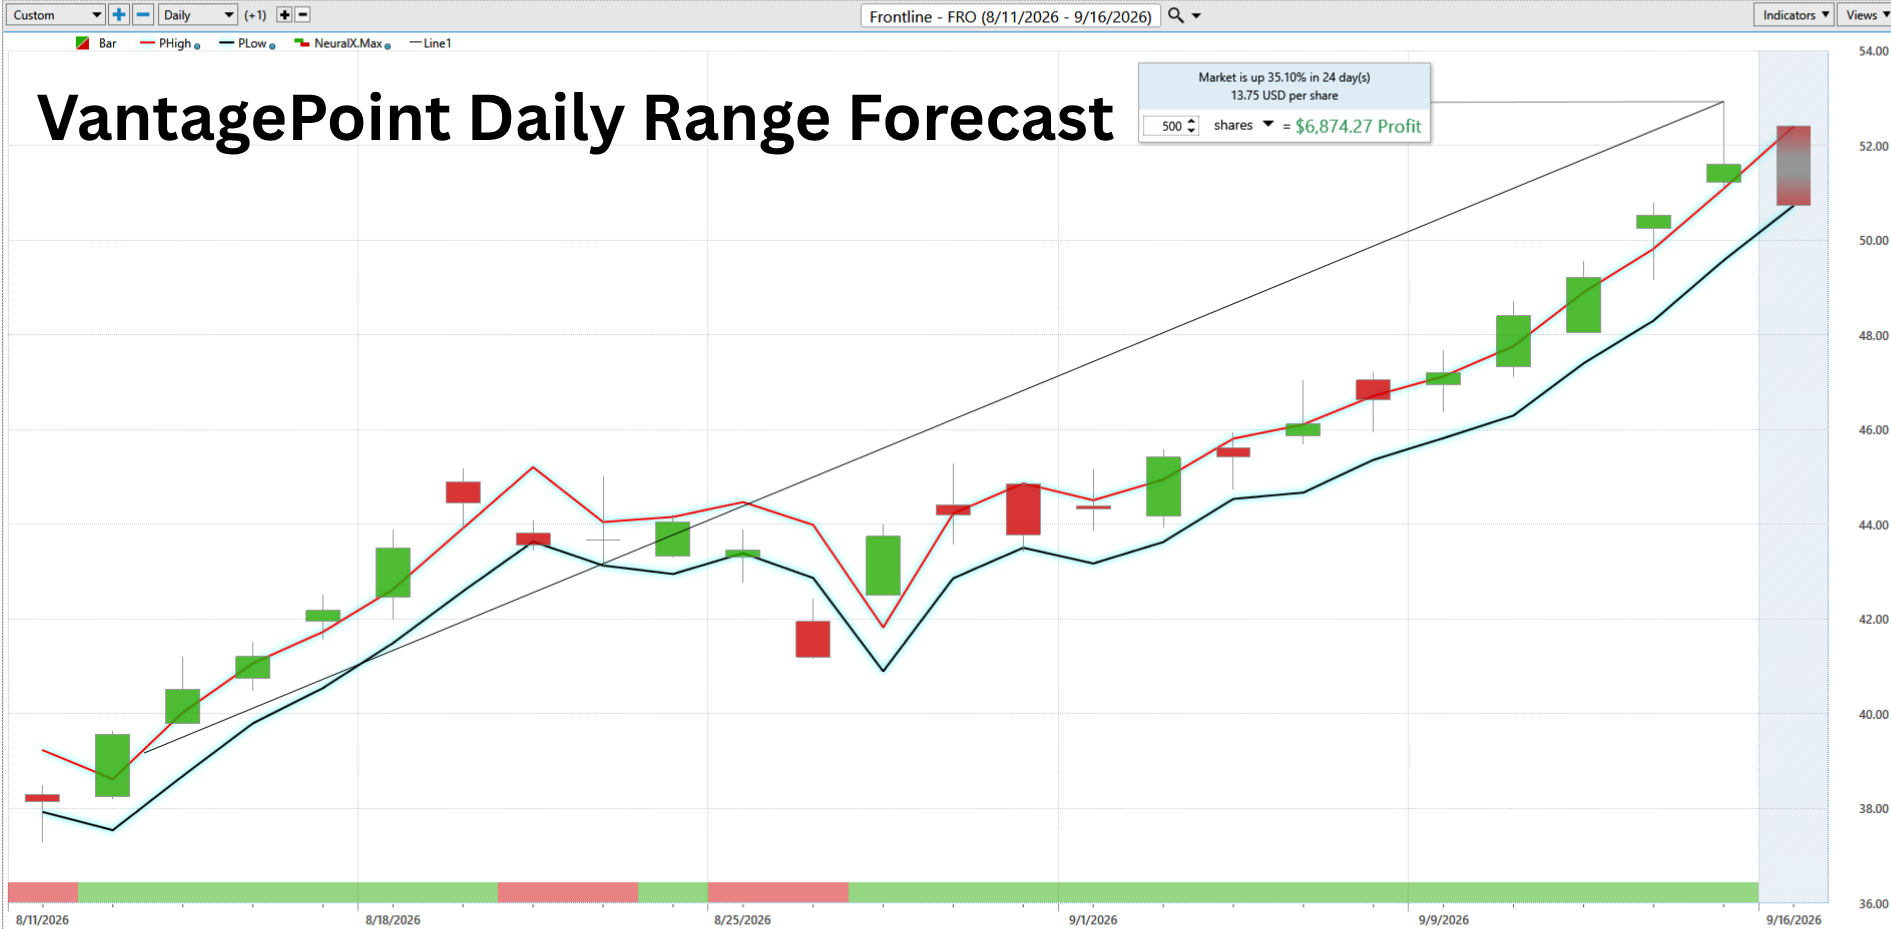
There is more than enough volatility in FRO to satisfy even an aggressive swing trader. From the August 12, 2026 bullish crossover through the current period, Frontline advanced from approximately $39.11 to $51.59, a gain of roughly 31.9%. That kind of move tells traders something important before the opening bell: FRO can provide significant room to make money, and it provides exactly as much room to be wrong. At a share price near $51.59, a normal 2% daily move represents roughly $1.03 per share. A 4% move represents approximately $2.06 per share. On more volatile days, particularly around tanker-rate developments, earnings news, dividend announcements, oil-market changes, or geopolitical headlines, the range can expand materially. That is not a forecast. It is a measure of the territory this stock has demonstrated it can cover.
The FRO chart shows why this matters. During the period displayed, beginning with the August 12 bullish crossover, Frontline repeatedly traded within or reacted around its forecasted daily boundaries as the stock advanced from approximately $39.11 to $51.59. The boundaries adjusted as volatility and direction changed, expanding during larger moves and shifting higher as the trend strengthened. As FRO climbed through the $40s and pushed toward fresh 52-week highs, the Daily Range Forecast moved higher alongside price, confirming the strength of the advance.
This gives traders a practical framework for execution. During a strong bullish trend, the forecasted low becomes an area to evaluate potential entries or additions to an existing position, while the forecasted high becomes an area to evaluate profit taking or short-term resistance. If the broader trend turns bearish, those considerations reverse, with rallies toward the forecasted high becoming more important areas to evaluate risk. The boundaries should never be treated as guaranteed support or resistance. Their value comes from giving traders predetermined areas to make decisions rather than chasing price emotionally.
Now focus on the far-right side of the chart. The forecasted daily high and low are both rising while price presses toward the upper portion of its recent range and fresh 52-week highs. That means the Daily Range Forecast is currently confirming rather than contradicting the broader bullish technical picture. It does not tell us that FRO must continue higher. It tells us the expected trading range itself has shifted upward. For traders, that is the real advantage: a forward-looking map of where tomorrow’s battle may occur, combined with disciplined risk management when price gets there.
Intermarket Analysis
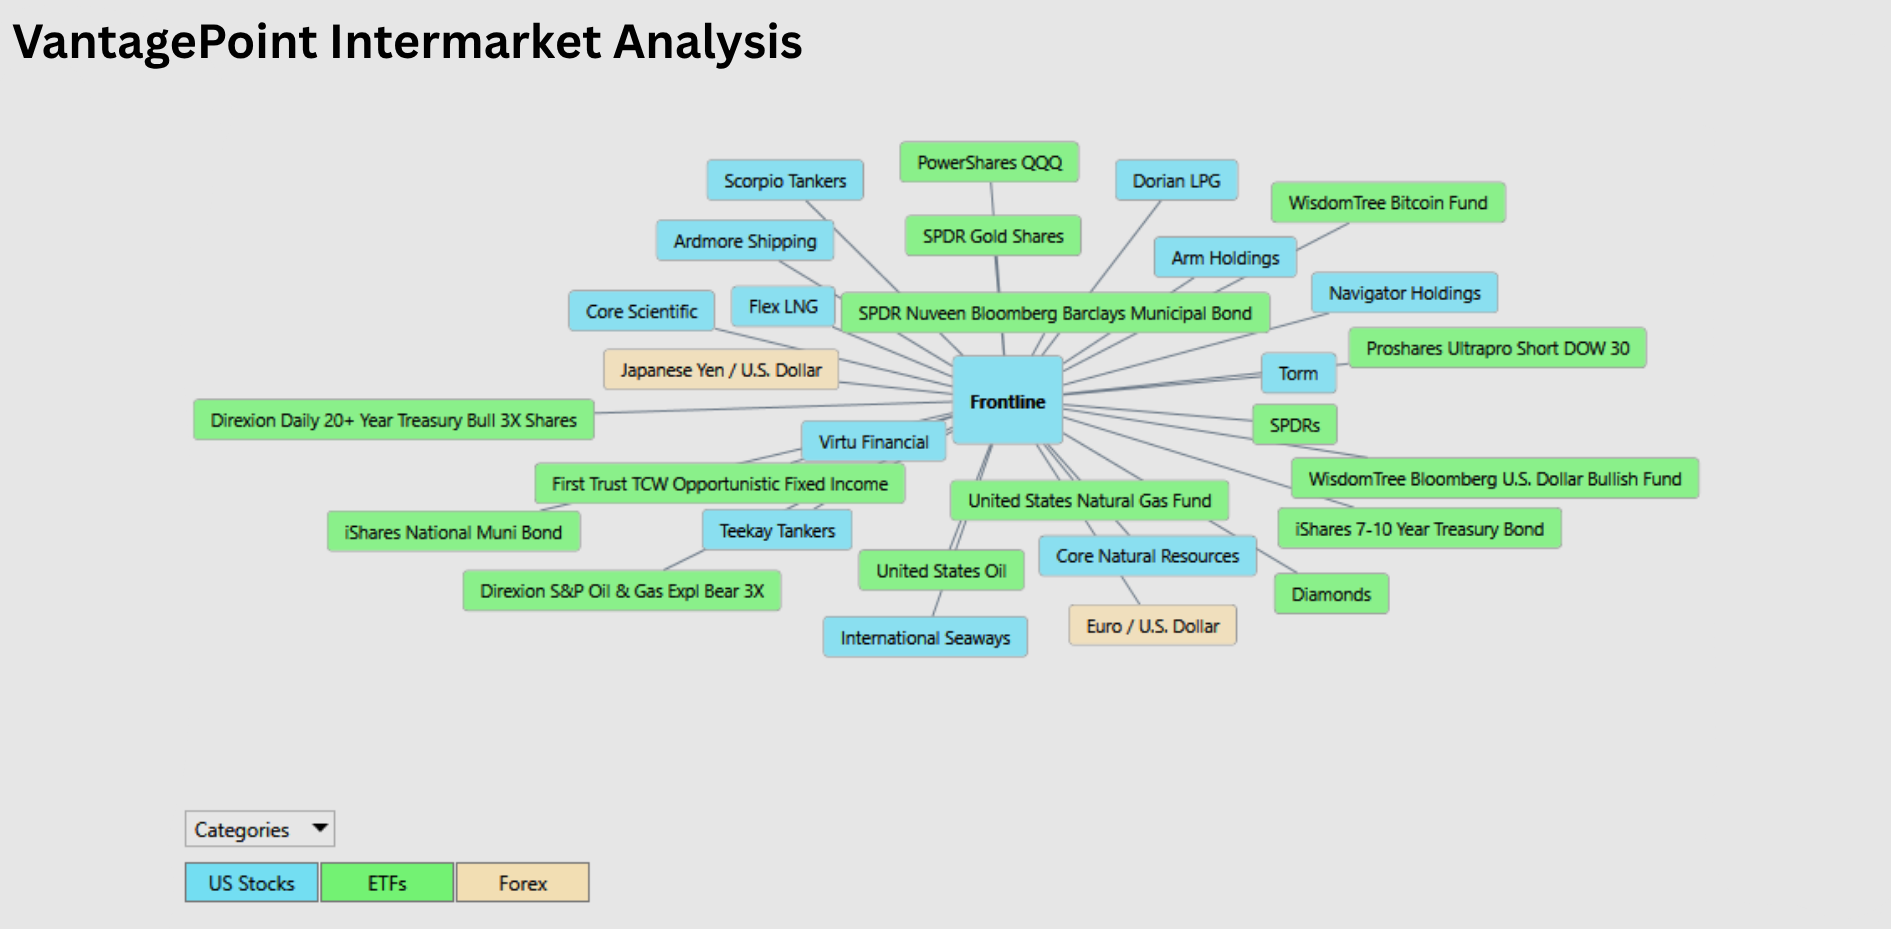
Frontline does not trade in a vacuum. Its price is connected to a much larger financial ecosystem that includes tanker stocks, energy markets, liquefied-natural-gas shippers, liquefied-petroleum-gas carriers, crude oil, natural gas, interest rates, currencies, Treasury bonds, gold, Bitcoin, municipal bonds, and broader equity-market risk appetite. The graphic makes that visible, connecting FRO to Scorpio Tankers, Ardmore Shipping, Teekay Tankers, International Seaways, TORM, Flex LNG, Dorian LPG, Navigator Holdings, United States Oil Fund, United States Natural Gas Fund, the Nasdaq-100, Treasury bonds, the U.S. dollar, the euro, the Japanese yen, and broad-market ETFs. Intermarket analysis matters because money is constantly moving between these markets, often creating tailwinds or headwinds for FRO before they become obvious on its own chart.
The strongest relationships surround tanker shipping, global energy movement, and maritime transportation. FRO is connected to Scorpio Tankers, Ardmore Shipping, Teekay Tankers, International Seaways, and TORM, which all provide exposure to various tanker and shipping-market conditions. It is also connected to Flex LNG, Dorian LPG, and Navigator Holdings, which provide exposure to related seaborne energy-transport markets. When tanker owners, product-tanker operators, LNG shippers, LPG carriers, and oil-related assets are rising together, Frontline has an important tailwind because institutional capital is flowing toward its neighborhood. When FRO rises while the broader shipping and energy complex begins weakening, traders should pay attention. A stock moving with its ecosystem has confirmation. A stock moving against it has something to explain.
Energy markets add another dimension. Frontline’s revenue is tied not simply to the price of oil, but to the physical movement of crude oil and petroleum products across international shipping routes. The United States Oil Fund and United States Natural Gas Fund can offer useful context for commodity sentiment, while the Direxion Daily S&P Oil & Gas Exploration & Production Bear 3X Shares ETF reflects bearish positioning toward the oil-and-gas industry. A rising oil price does not automatically mean tanker rates will rise. In some cases, strong oil demand, inventory changes, supply disruptions, and longer shipping routes can support tanker demand. In other cases, higher energy prices can weaken consumption or reduce trading activity. The point is not that one market dictates Frontline’s price. The point is that the broader energy complex provides evidence about the environment in which tanker demand is developing.
Interest rates, fixed income, and currencies add another layer. Frontline is a capital-intensive shipping company that owns and operates expensive vessels, so the cost of financing matters. The iShares 7-10 Year Treasury Bond ETF, Direxion Daily 20+ Year Treasury Bull 3X Shares, municipal-bond ETFs, and the First Trust TCW Opportunistic Fixed Income ETF all provide information about interest-rate expectations and capital-market conditions. Falling yields can ease financing pressure and make dividend-paying cyclical stocks more attractive. Rising yields can increase the cost of capital and give income-oriented investors more alternatives outside equities.
The U.S. dollar plays a supporting role as well. The euro/U.S. dollar and Japanese yen/U.S. dollar relationships matter because oil, charter markets, vessel values, and trade flows are global. A stronger dollar can affect commodity affordability, international demand, and global risk appetite. A weaker dollar can support commodity-linked activity in some environments. These relationships should not be treated as fixed rules, but they can help traders understand whether currency markets are supporting or challenging the broader energy and shipping trade.
The broader equity indexes provide additional context. FRO is connected to the Invesco QQQ Trust, SPDR broad-market funds, the Diamonds Trust, and leveraged short-Dow exposure through the ProShares UltraPro Short Dow 30 ETF. It also has intermarket connections to the SPDR Gold Shares ETF, WisdomTree Bitcoin Fund, and WisdomTree Bloomberg U.S. Dollar Bullish Fund. Those relationships show that Frontline can be influenced by much more than tanker rates. Changes in risk appetite can push capital toward cyclical energy names, defensive fixed-income instruments, gold, the dollar, technology equities, or speculative assets. When money rotates into commodity-linked and cash-generative businesses, Frontline can benefit. When capital flows toward large-cap technology, bonds, gold, or defensive safety, tanker stocks may face headwinds regardless of individual earnings strength.
The key insight is that intermarket analysis is really the study of capital migration. Trillions of dollars are constantly choosing between stocks, bonds, currencies, commodities, sectors, and countries. The FRO chart tells us what happened to Frontline. Intermarket analysis helps explain the financial currents pushing underneath it. When tanker peers, LNG and LPG carriers, crude oil, natural gas, Treasury bonds, currencies, and broader market conditions begin telling the same story, traders gain something far more valuable than another headline: confirmation.
This is the power behind VantagePoint AI’s intermarket analysis. Instead of treating FRO as an isolated ticker symbol, it examines relationships across markets to identify outside forces that may influence price behavior. When those relationships confirm the forecasted trend, conviction can strengthen. When they begin contradicting it, traders know to pay closer attention to risk. The chart shows you the tanker. Intermarket analysis shows you the current moving beneath it.
 Our Suggestion
Frontline ($FRO) presents one of those situations traders love and fear at the same time: the tanker market is showing extraordinary strength, the company has just reported the best quarterly profit in its history, and the stock has already advanced more than 150% from its January low. Revenue traveled from approximately $749.4 million in fiscal 2021 to a peak of roughly $2.05 billion in fiscal 2024, then eased to approximately $1.97 billion in fiscal 2025 as the tanker market normalized. Net income moved from a modest loss in 2021 to approximately $656 million in 2023, then declined to approximately $379 million in 2025. That is the nature of a tanker company. Freight rates do not move in straight lines, and neither do revenue, earnings, dividends, or share prices.
The important change is not in the annual table. It is in the latest quarterly numbers. Frontline reported $943.3 million in second-quarter 2026 revenue and a record $659.2 million in net income, equal to $2.96 per share. Adjusted profit reached $580.2 million, or $2.61 per share. Average spot TCE rates reached $152,700 per day for VLCCs, $111,500 per day for Suezmax tankers, and $92,400 per day for LR2/Aframax vessels. Those figures show how strongly Frontline can perform when tanker rates remain elevated and fleet utilization is favorable.
Management sounds confident because it has been delivering results rather than making promises. Frontline declared a regular quarterly dividend of $2.61 per share and entered into agreements to sell two 2017-built VLCCs for a total price of $270 million. The company expects approximately $179 million in net cash proceeds from those sales and intends to return that amount to shareholders through a one-time special dividend of $0.80 per share. Frontline’s fleet is expected to include 77 vessels after planned deliveries and sales, including 40 VLCCs, 19 Suezmax tankers, and 18 LR2/Aframax vessels. The company has demonstrated that its business can convert a favorable tanker market into record profit, operating cash flow, and substantial shareholder distributions.
The important issue for traders is how much of this strength is already reflected in the market price. Published analyst data shows an average 12-month price target of approximately $41.62, roughly 19% below FRO’s recent price near $51.59, with a consensus Hold rating and target range of $30 to $55. That average target is not a market view carved in stone. It is a collection of assumptions about daily freight rates, vessel availability, dividends, oil-market conditions, and how long the current tanker cycle can last. The market is pricing in strength that has already appeared in the company’s record Q2 results. Frontline has been rewarding that optimism with high TCE rates, large cash distributions, and a share price near fresh 52-week highs. That creates opportunity if rates remain strong. If they weaken, there is considerably less cushion beneath the stock than the recent advance suggests.
The technical evidence reinforces the fundamental picture. FRO has moved from approximately $20.47 on January 2 to $51.59 at the time of writing, a gain of roughly 152%. The stock sits at the top of its 52-week range, only marginally below fresh highs. The Predictive Blue Line first turned bullish on July 7, and a trader holding through the brief intervening crossovers would have captured approximately 35.97% in 49 trading days. The more decisive August 12 bullish crossover produced a 29.69% advance in 23 trading days, from approximately $39.11 to $51.59. The Neural Index has posted 17 green signals since that August 12 crossover, against only three yellow caution signals and three red high-caution signals. The last eight completed readings were green, with the ninth forecast to remain green. The Daily Range Forecast has continued stair-stepping higher as price has advanced toward fresh 52-week highs. Put those signals together and FRO currently has the type of double confirmation traders want to see. But the same advance adds an important warning: Frontline is a highly cyclical tanker stock, and its daily range can widen quickly when freight-rate expectations change.
Our suggestion is therefore to respect the tanker-rate strength without underestimating the cycle risk. $FRO currently checks several boxes traders want in a cyclical momentum setup: record quarterly profit, exceptionally high TCE rates, a large and comparatively young fleet, substantial operating cash flow, a regular dividend, a special dividend, and strong technical confirmation. A decisive move above the current high near $51.59 would establish fresh 52-week highs and strengthen the bullish case. But this stock has also demonstrated that it can move quickly in both directions when global shipping conditions change. At the top of its annual range, the stock has little cushion if tanker rates, dividend expectations, or market sentiment soften.
The next major catalyst is third-quarter 2026 earnings, expected on November 30, along with Frontline’s updated commentary on booked TCE rates, vessel coverage, realized earnings, fleet activity, and dividend capacity. The most important outside indicators will be daily tanker rates, global oil-trade activity, fleet-supply developments, financing conditions, and the direction of the broader energy and shipping complex. Management has earned credibility with a record Q2 earnings report, but now it must demonstrate that the rate environment is durable enough to support the market’s elevated expectations.
Practice great money management on every trade, and use the VantagePoint AI Daily Range Forecast to identify short-term trading opportunities while keeping risk firmly under control.
It’s not magic.
It’s machine learning.
Disclaimer: THERE IS A HIGH DEGREE OF RISK INVOLVED IN TRADING. IT IS NOT PRUDENT OR ADVISABLE TO MAKE TRADING DECISIONS THAT ARE BEYOND YOUR FINANCIAL MEANS OR INVOLVE TRADING CAPITAL THAT YOU ARE NOT WILLING AND CAPABLE OF LOSING.
EXAMPLES ARE SUCCESS STORIES AND ATYPICAL. PAST RESULTS DO NOT GUARANTEE FUTURE PERFORMANCE.
VANTAGEPOINT’S MARKETING CAMPAIGNS, OF ANY KIND, DO NOT CONSTITUTE TRADING ADVICE OR AN ENDORSEMENT OR RECOMMENDATION BY VANTAGEPOINT AI OR ANY ASSOCIATED AFFILIATES OF ANY TRADING METHODS, PROGRAMS, SYSTEMS OR ROUTINES. VANTAGEPOINT’S PERSONNEL ARE NOT LICENSED BROKERS OR ADVISORS AND DO NOT OFFER TRADING ADVICE.