Why The Fed Should Be Watching The Beer To Gold Ratio!
Gold is a paradox.
Let me explain.
The very individuals and institutions that continuously revile, chastise and ridicule gold, as a ‘barbarous relic’ no less, own more of it than anyone else in the world, and more importantly they continue to purchase it in record quantities in spite of their public commentaries.
It’s the darnedest thing!
A real head scratcher.
The record of fiat currencies through over 5,000 years of monetary history is eventual 100% failure. As hard and unpleasant as that statement may be to believe, it is 100% true. All fiat currencies fail. Their average life span is less than 50 years. Comparatively speaking, the record of gold for 5,000 years is 100% lack of failure and maintenance of purchasing power.
But, in spite of this illustrious track record, the yellow metal has been relegated into a vehicle of questionable reputation and disreputable character by most investors and the monetary authorities.
In spite of the persistent attacks that Gold has received, its detractors have been unable to remove its monetary value.
The following table will show you how much GOLD is being held by the largest nations’ central banks and financial institutions in the world.
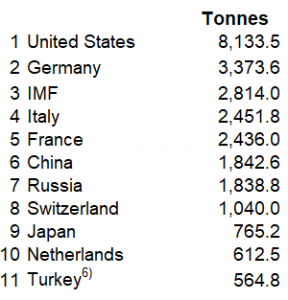
Gold Ownership By Central Banks
Since the 2008 financial crisis many of these same countries and institutions have increased their gold holdings by huge amounts, with the exception of the United States
I have often found that asking questions can be an important guide towards forming an educated opinion. A simple question when formed correctly opens the doors to honest and objective exploration. Here are some questions that I have been asking over the last few months:
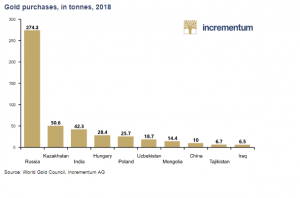
Why is Russia buying Gold in record quantities?
Why is China buying Gold in record quantities?
Why has the United States the world’s reserve currency, not been purchasing more gold over the last ten years?
How do we measure “trust” in the monetary authorities?
These questions lead me to the only thing which matters to citizens, investors, and traders – the purchasing power of their currency. When purchasing power is stable for a currency none of these questions matter. Trust is questioned when a threat to purchasing power of money arises.
People often think that currency and money are synonyms, which they are not! To understand the distinction which is critically important we need to look back at monetary history.
On August 15, 1971, President Richard M. Nixon removed the US Dollar from gold convertibility. This event established the current fiat monetary system worldwide. Up until that date, the U.S. dollar was convertible into Silver and Gold. All currencies of the world were convertible into dollars.
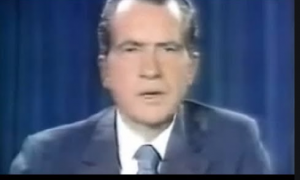
The Nixon Shock 8/15/71
From August 15, 1971 forward the U.S. dollar is backed only by the full faith and credit of the government and all currencies fluctuate on a daily basis to determine their value in relation to U.S. dollars. This monetary system is heavily stressed today and the major nations of the world have been organizing for the last 12 years to question the United States role as the world’s reserve currency. The new emerging superpowers include the B.R.I.C.S countries – Brazil, Russia, India, China and South Africa.
The key lesson that history will teach us is that currency has always been a receipt for money. Your receipts of currency were traditionally convertible into whatever asset was backing a currency.
Things like salt, cattle, seashells, beans, gold and silver have all acted as money. Today the U.S. dollar is recognized as money throughout the world but with the tremendous financial stresses that COVID-19 has brought to the American economy the value of the U.S. dollar is also being questioned on a daily basis.
Here’s why.
Often, very simple economic ideas become obfuscated in a sea of complex terminology. If you question this, try watching the testimony of a Federal Reserve Chairman when he speaks to Congress. You may recognize that they are speaking English but the complexity of the language is a wonder to behold. What everyone in the world is most concerned about is the stability of their currency and the value of its purchasing power. The best way to understand this very simple idea is by visualizing a simple arithmetical fraction.
Example:
1/100
The numerator represents your units of purchasing power. The denominator represents the number of units of purchasing power of your group/country. A threat to your purchasing power can only exist if we add more units to the denominator without adding anything to the numerator. This is exactly what everyone in the civilized world who has been affected by COVID-19 is evaluating right now.
Inflation is traditionally defined as a deterioration in purchasing power which comes about because more money is chasing the same amount of goods available. The graphic below will show you how U.S. Monetary policy has affected the purchasing power of the U.S. Dollar since the Federal Reserve was founded.
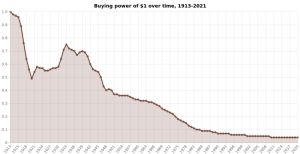
Purchasing Power U.S Dollar Since 1913
The Only Thing That Matters!
The study of Gold is the study of purchasing power over time. You can very easily do this for yourself by simply looking at the cost of any good at any point in history and compare it to how many units of Gold it took to acquire it. Then compare that metric to today.
This yardstick or metric is how value is determined.
When we as investors look at something that is consistently rising in price, we need to ask ourselves is that “thing” becoming more valuable, or is my currency becoming less valuable?
Maybe this is the exercise that Central Bankers want you to avoid doing?
Over the last 30 years over 28 countries have experienced the ravages of hyperinflation. In other words, their currencies were debased to the point where they eventually became worthless. I am not suggesting that will occur in the United States. But when the monetary authorities add trillions of new dollars to the American economy to try and save the system the long-term threat of loss of purchasing power is very, very real.
Here is the price of an average home when priced in dollars:
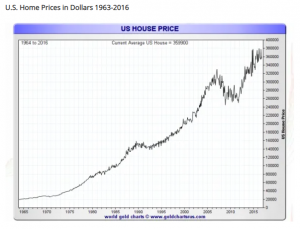
Price of an Average Home in US Dollars
Is the home becoming more valuable? Homes cost 1,900% more today than they did in 1960. Or is the currency through which you are looking at the home becoming worth less? That is the most basic and most important question.
Now let’s price that exact same home in terms of ounces of GOLD, and you get a chart that looks entirely differently.
Since the currency was not being perpetually debased you can see a relationship where “VALUE” can be established. The highs and lows are marked. You can see that, at gold’s most recent peak in 2011, it took only 143 ounces of gold to buy the average-priced home in the U.S. And when gold previously peaked in 1980, it took a mere 106 ounces. In otherwords, GOLD retained its purchasing power far better than the dollar over the last six decades.
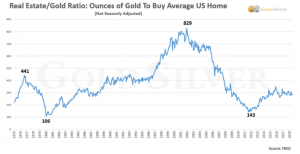
Average Home Priced In Gold
When priced in dollars alone the house is in a perpetual uptrend and this is primarily because the US dollar is continuously becoming worth less and less. The steady loss of purchasing power of the dollar is clearly visible, while gold has not lost purchasing power in the past five decades, despite some large fluctuations.
Once you start doing this purchasing power exercise you’ll find you want to do this towards everything you purchase or will ever consider purchasing.
Here is why it matters.
On August 15, 1971 when President Nixon removed Gold convertibility from the US dollar an ounce of Gold cost $35.
After almost 50 years we can see the results of how monetary policy had affected any choice you chose to make with that $35.
If you buried that $35 in a coffee can in your backyard, it would be worth about $5 today in 1971 purchasing power.
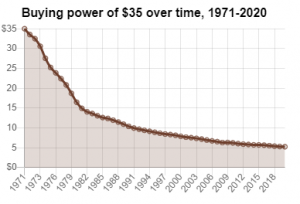
Value of $35 in 1971 dollars
If your $35 matched government inflation statistics exactly your $35 would be worth $223.06 today for a gain of 537%.
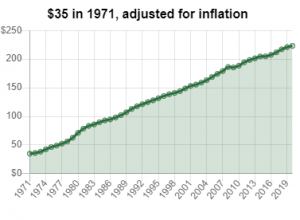
$35 adjusted for inflation
Today that same ounce of Gold which cost $35 in 1971 is worth over $1700. This represents a gain of 4,757%.
It’s the darnedest thing!
Here is how the Dow Jones Industrials Average is valued according to Gold. Clearly, we are still on the higher end of the scale.
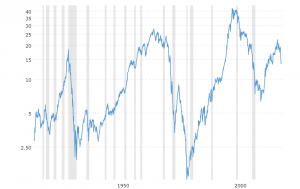
Dow Jones Industrials priced in Gold
When the authorities in government recently decided to shut down the American economy, they decided that “alcohol” stores were considered “essential” and they were permitted to remain open. From this sobering insight we can look at the historic relationship between Beer and Gold and decide what it portends for the future of the world economy.
Dr. Roni Stoeferle of Incrementum AG maintains a database of Beer prices at Oktoberfest in Munich Germany going back to 1950. In 1950, you could purchase a liter of beer for .83 Euro. Today that same liter of beer costs 11.50 Euro. Beer prices have gone up 928% in the last 70 years. (But there is good news.)
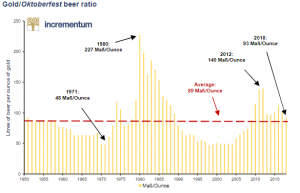
Gold to Beer Ratio
In August of 1971 when Nixon established the worldwide fiat currency system one ounce of Gold could buy 48 liters of beer. Eight years later, one ounce of Gold could purchase 227 liters of beer as Gold rallied to $800 an ounce.
Today, one ounce of gold can purchase about 135 liters of beer.
There is not one fiat currency in the world that has been able to keep pace with the rate of beer inflation!
It seems quite clear though that GOLD is the antidote to Beer Panics (and dry throats) historically. It clearly looks as though the beer price at Oktoberfest in 2020 will rise to close to 12 Euros per liter. This is bad news for paper currencies, but it clearly looks like for those fans of the chastised yellow metal that your purchasing power is safe. Central bankers be forewarned! More importantly, it looks as though over the next few years, that one ounce of Gold will challenge the all-time highs of 227 liters of Oktoberfest brew.
Gold will even protect your BEER purchasing power.
Headline Overwhelm
As I read the headlines I can easily become worried by the troubles in the American economy.
Nobody knows how the biggest monetary experiment in the history of the world will unfold. The alleged omnipotence of central bankers is certainly being questioned today. It is therefore better to have insurance and not need it, than to need it and not have the insurance. Gold fulfills exactly this function.
There is the old saying, “May you live in interesting times!”
The last few weeks have certainly fit the bill.
Record drop in services.
Record drop in consumer spending.
Record drop in industrial production.
Record spike in jobless claims.
Record drop in regional manufacturing.
Record drop in consumer confidence.
Record asset purchases from the Fed.
Record Government spending.
They say every bull market has to climb a wall of worry. I’d call these factors a Mount Everest of Worry.
The Fed just did something we’ve never seen before in human history.
They pumped $1.1 trillion into the markets in a single day. And there is talk of another 7 trillion in the works before all is said and done.
Forget helicopter money… This is thermonuclear ballistic missile money.
I’ve never seen anything like this.
What makes me even more grateful is that I have artificial intelligence to guide my trading decisions. Because quite honestly, the opinion I have offered in this article is completely inconsequential. The only thing that matters, and the only way wealth is created is if you do what the market does.
Doing what the market does is what a.i. is all about.
Throughout all of my years at trading I have discovered that you can be focused on a story or headline that completely overwhelms you and forces you to miss out on great trades.
Let me give you an example.
Since the COVID-19 lockdown began I became obsessed by the reality that 10 years of consistent job growth were wiped out in a single month. During the Great Recession we lost 8.7 million jobs, but from 2010 to 2020 we added 24.8 million jobs to the economy. Then in 30 days between mid March and mid April 2020 all of those gains were erased.
Poof!
Gone!
This is downright terrifying.
The unofficial numbers for unemployment are likely to be close to 20% when reported. I have more questions than answers.
- What metrics will determine when a city opens versus when it doesn’t?
- How is success measured when re-opening? What will signal it isn’t working?
- What is the process for pausing the re-opening if it is not going according to plan? This is a highly complex situation.
As a trader these questions are paralyzing.
The point that I am making is that while it is important to be aware of these realities that there are many, many factors which make markets move. And there are lots and lots of opportunities, both long and short to make money throughout all of this volatility.
How good do you think you are at finding them?
Machine learning, neural networks and artificial intelligence are an absolute necessity in times like these for finding these trading opportunities which the majority of traders will never see.
Look at the attached chart of the S&P 500 and look at how the artificial intelligence forecasted the top and bottom was in a few days after it occurred.
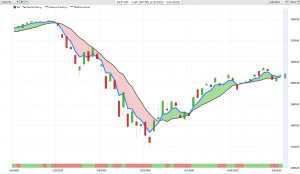
S&P 500 Index With Vanatgepoint A.I. Forecasts
The main problem of trading is the organization of information so that effective decisions can be made.
Do you really think you can effectively evaluate thousands of stocks, and determine which ones have the greatest statistical probability of success?
One day we’re up 1,000 points… one day we’re down 1,000 points.
The media blames coronavirus… the election… Fed rates… oil prices… Trump… Pelosi….
These are all great storylines that will create enough content to fill up a 24-hour news cycle.
But don’t let what the talking heads are saying, get in the way of being on the right side of the trend.
What has your performance been like over the past year?
I’d love to show you a handful of your favorite charts that will allow you to change the way you analyze and trade the markets forever!
Visit with us and check out the a.i. at our Next Live Training.
It’s not magic. It’s machine learning.
Make it count.